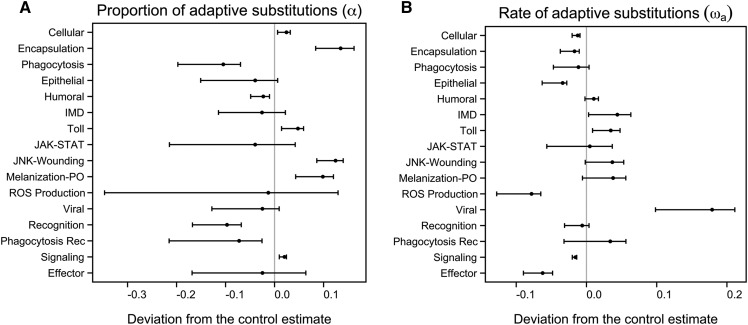
Figure 2.
Adaptive divergence of Drosophila immune gene groups. (A) Proportion of adaptive substitutions (α) and (B) relative rate of adaptive substitutions (ωa) calculated from D. melanogaster-D. simulans alignments using the DFE-alpha method (Eyre-Walker and Keightley 2009). Shown are the mean estimates with 95% C.I. calculated with jackknife resampling at the gene level. The vertical gray lines denote the 95% C.I. as calculated with a set of 1208 control genes. Values are presented as deviations from the control gene estimates. Rec, recognition; ROS, reactive oxygen species.

