

Abstract
Objective
Monitoring B-type natriuretic peptide (BNP) to guide pharmacotherapy might improve survival in patients with heart failure with reduced ejection fraction (HFrEF) or preserved ejection fraction (HFpEF). However, the cost-effectiveness of BNP-guided care is uncertain and guidelines do not uniformly recommend it. We assessed the cost-effectiveness of BNP-guided care in patient subgroups defined by age and ejection fraction.
Methods
We used a Markov model with a 3-month cycle length to estimate the lifetime health service costs, quality-adjusted life years (QALYs) and incremental net monetary benefits (iNMBs) of BNP-guided versus clinically guided care in 3 patient subgroups: (1) HFrEF patients <75 years; (2) HFpEF patients <75 years; and (3) HFrEF patients ≥75 years. There is no evidence of benefit in patients with HFpEF aged ≥75 years. We used individual patient data meta-analyses and linked primary care, hospital and mortality data to inform the key model parameters. We performed probabilistic analysis to assess the uncertainty in model results.
Results
In younger patients (<75 years) with HFrEF, the mean QALYs (5.57 vs 5.02) and costs (£63 527 vs £58 139) were higher with BNP-guided care. At the willingness-to-pay threshold of £20 000 per QALY, the positive iNMB (£5424 (95% CI £987 to £9469)) indicates that BNP-guided care is cost-effective in this subgroup. The evidence of cost-effectiveness of BNP-guided care is less strong for younger patients with HFpEF (£3155 (−£10 307 to £11 613)) and older patients (≥75 years) with HFrEF (£2267 (−£1524 to £6074)). BNP-guided care remained cost-effective in the sensitivity analyses, albeit the results were sensitive to assumptions on its sustained effect.
Conclusions
We found strong evidence that BNP-guided care is a cost-effective alternative to clinically guided care in younger patients with HFrEF. It is potentially cost-effective in younger patients with HFpEF and older patients with HFrEF, but more evidence is required, particularly with respect to the frequency, duration and BNP target for monitoring. Cost-effectiveness results from trials in specialist settings cannot be generalised to primary care.
Keywords: B-type natriuretic peptide, Cost-effectiveness, Markov model, Survival analysis
Strengths and limitations of this study.
We combined recent individual patient data meta-analyses of 2000 heart failure (HF) patients participating in several randomised controlled trials (RCTs) and evidence on the costs of care from routine data in a cost-effectiveness model.
We investigated the cost-effectiveness of B-type natriuretic peptide (BNP)-guided care in subgroups of HF patients which were not reported in the original RCT publications.
We conducted sensitivity analyses to estimate the uncertainty around our results and identify patient subgroups where further evidence is needed.
We used a simplified model structure as the majority of RCTs do not measure or report changes in functional status at follow-up.
None of the RCTs provided evidence on utility scores; hence, we used scores reported elsewhere in the HF literature which may not be representative of patients eligible for BNP monitoring.
Introduction
Heart failure (HF) is a major and growing public health problem worldwide. HF is associated with high risks of hospitalisation and mortality, making it one of the most costly conditions to manage. Global estimates indicate that HF results in US$65 billion direct care costs and US$43 billion in lost productivity annually.1 In the UK, ∼500 000 people live with HF,2 and this figure is likely to rise as the population continues to age. Each year, HF is the primary diagnosis in over 150 000 hospital episodes in the UK; many of these are emergency admissions.2 Healthcare costs increase sharply at the end of life and are dominated by hospital care.3 The case for many novel interventions in HF is based on the expectation that the upfront costs will be justified in the longer term by improved patient outcomes and/or savings due to reduced hospitalisations.4 5
Pharmacological treatment for HF includes ACE inhibitors, angiotensin receptor blockers, β blockers and mineralocorticoid receptor antagonists. Achieving optimal pharmacotherapy for HF is challenging and complicated by potential side effects such as renal failure and hypotension. Emerging evidence suggests that monitoring serum B-type natriuretic peptide (BNP) biomarkers can guide pharmacotherapy and improve survival.6 7 BNP is a neurohormone secreted primarily from the left ventricle of the heart in response to changes in pressure that occur when HF develops and worsens. In 2010, clinical guidelines8 in England and Wales recommended specialist monitoring of BNP in patients recently admitted to hospital, but also called for further research on cost-effectiveness. More recent North American guidelines9 considered the value of serial BNP measurement to be not well established. Evidence on the cost-effectiveness of BNP-guided care in HF includes economic evaluations conducted alongside randomised controlled trials (RCTs)10 11 and model-based analyses12–14 synthesising costs and outcomes over the lifetime of patients.
We conducted a model-based cost-effectiveness analysis of BNP-guided care in patients with HF. Our analysis differs from previous economic evaluations in two ways. First, we exploited recent individual patient data (IPD) meta-analyses6 7 in estimating the relative effect of BNP-guided care. Among the advantages of IPD meta-analysis is the opportunity to investigate the (cost-)effectiveness of BNP-guided care in subgroups of patients which are not analysed consistently or not reported in the original RCT publications. Second, we used linked data from the Clinical Practice Research Database (CPRD; http://www.cprd.com), Hospital Episode Statistics (HES; http://www.hscic.gov.uk/hesdata) and Office for National Statistics (ONS; http://www.ons.gov.uk) to inform key parameters of the model. In particular, we used these data to estimate the National Health Service (NHS) costs of care for patients with HF who are stable and treated in primary care compared with those who are admitted to hospital. Our objective was to synthesise the evidence on the cost-effectiveness of BNP-guided care in subgroups of the recently hospitalised HF population defined by age and left ventricular ejection fraction (LVEF) status.
Methods
Overview of the model
We compared specialist-led BNP-guided care with specialist-led clinically guided care in recently hospitalised patients with HF with a reduced ejection fraction (HFrEF) or preserved ejection fraction (HFpEF). Two RCTs15 16 included a third arm where usual care was provided by a primary care physician, but we focused on specialist-led care in common with the IPD meta-analyses of RCTs.6 7 We used a simple Markov process consisting of two health states: Alive and Dead (figure 1), which is similar to the structure of a previous cost-effectiveness model that was used to develop NICE clinical guidelines on the management of HF8 and later updated with additional RCT evidence.14
Figure 1.
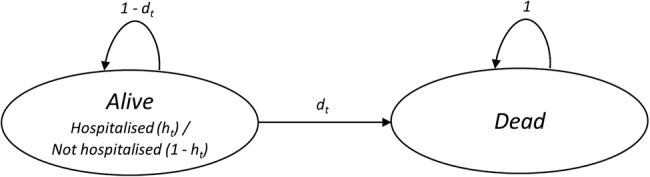
Markov model of disease progression.
We tracked the probabilities of death (dt) and hospitalisation (ht), which varied with time in the model. We did not model the interaction between the number of hospitalisations and the subsequent risk of death. This was a pragmatic decision as RCTs do not report mortality conditional on the number of hospitalisations. We chose a cycle length of 3 months to track changes in outcomes and resource use, as BNP was monitored every 3 months during follow-up in a number of RCTs16–18 and mortality differences have emerged by 3 months in IPD meta-analyses.6 7 We assumed that transitions between health states occur halfway through each cycle.
We estimated the average NHS costs and quality-adjusted life years (QALYs) of a hypothetical cohort of 1000 patients over their lifetime. Recent IPD meta-analyses of RCTs6 7 have explored the relative effectiveness of BNP-guided care in subgroups of the recently hospitalised HF population defined by age (<75/≥75 years) and LVEF (≤45%/>45%) status. The evidence that BNP-guided care is effective is strongest in younger patients (<75 years) and in those with HFrEF. However, there is no evidence to suggest that BNP-guided care is beneficial in older patients (≥75 years) with HFpEF (HR 1.56 (95% CI 0.90 to 2.70)).6 Therefore, we estimated the cost-effectiveness of BNP-guided care in three patient subgroups: (1) HFrEF patients <75 years; (2) HFpEF patients <75 years; and (3) HFrEF patients ≥75 years. Based on data from the IPD meta-analysis,6 we used the mean ages of 65 and 81 years at the inception of treatment for the age-subgroups <75 and ≥75 years, respectively. We tracked outcomes for a period of 30 years for the age-subgroup <75 and 15 years for the age-subgroup ≥75 years. This equated for both strategies that more than 99% of patients analysed have died.
We calculated QALYs by multiplying the health state utility score by the time spent in that state.19 Costs and QALYs were discounted at an annual rate of 3.5%.20 We estimated the cost-effectiveness of BNP-guided care based on the incremental net monetary benefit (iNMB):
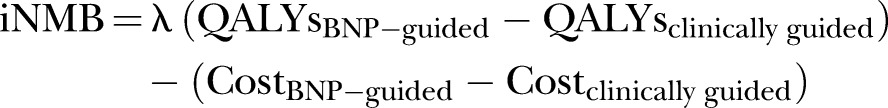 |
where λ represents the maximum amount that the NHS is ‘willing to pay’ to gain one QALY. We used the lower NICE threshold (λ=£20 000) in calculating iNMB.21 An iNMB value >0 would indicate that BNP-guided care is cost-effective. We present cost-effectiveness acceptability curves (CEACs) to demonstrate how the NHS willingness-to-pay threshold affects the probability that BNP-guided care is considered cost-effective.22 We also present incremental cost-effectiveness ratios (ICERs).
Model parameters
We used four sets of parameters (tables 1 and 2): (1) baseline probabilities of hospitalisation or death in the clinically guided group; (2) relative treatment effects (hazard ratios (HRs) and relative risks (RRs)), which determine how the baseline probabilities differ in the BNP-guided group; (3) utilities, which represent the health-related quality of life of patients in each state; and (4) NHS costs incurred in each state. The sources of these data are described below.
Table 1.
Transition probability parameters used in the model
| Parameter | Mean estimate | Distribution | Source |
|---|---|---|---|
| Baseline monthly hazard rate of all-cause mortality for the first 8 years of the model (<75 years) | 0.009 | LN (−4.718, 0.012 SE) | CPRD-ONS |
| HR (≥75 vs <75 years) of all-cause mortality for the first 8 years of the model | 2.801 | LN (1.030, 0.014 SE) | CPRD-ONS |
| 3-monthly risk of all-cause mortality in general population | Age variant | Fixed | ONS23 |
| RR (HF patients vs general population) of all-cause mortality | 3.14 | β (199, 94)* HF/ β (176, 410)* gen. pop. |
van Jaarsveld et al24 |
| RR (HFpEF patients vs HFrEF patients) of all-cause mortality | 0.78 | β (766, 2865)* HFpEF/ β (584, 1621)* HFrEF |
Nichols et al25 |
| BNP HR of all-cause mortality for HFrEF patients <75 years | 0.68 | LN (−0.386, 0.177 SE) | Brunner-La Rocca et al6 |
| BNP HR of all-cause mortality for HFpEF patients <75 years | 0.76 | LN (−0.274, 0.487 SE) | Brunner-La Rocca et al6 |
| BNP HR of all-cause mortality for HFrEF patients ≥75 years | 0.87 | LN (−0.139, 0.148 SE) | Brunner-La Rocca et al6 |
| Baseline monthly hazard rate of all-cause hospitalisation (<75 years) | 0.066 | LN (−2.711, 0.008 SE) | CPRD-ONS |
| HR (≥75 vs <75 years) of all-cause hospitalisation | 1.248 | LN (0.222, 0.010 SE) | CPRD-ONS |
| BNP HR of all-cause hospitalisation | 0.94 | LN (−0.062, 0.062 SE) | Troughton et al7 |
*β parameters were determined empirically.
CPRD, Clinical Practice Research Database; HES, Hospital Episode Statistics; LN, log normal; ONS, Office for National Statistics; RR, relative risk.
Table 2.
Utility, resource use and cost parameters used in the model
| Parameter | Mean estimate | Distribution | Source |
|---|---|---|---|
| HF utility score when hospitalised | 0.66 (0.26 SD) | β (7321, 3772)* | Reed et al26 |
| HF utility score when not-hospitalised | 0.77 (0.23 SD) | β (7978, 2383)* | Reed et al26 |
| Duration of hospitalisation (days) | 13.21 (0.39 SE) | γ (1148.29, 0.01)* | CPRD-HES3 |
| 3-monthly cost when hospitalised (age <75 years) | £9104 (349.61 SE) | γ (678.06, 13.43)* | CPRD-HES3 |
| 3-monthly cost when not-hospitalised (age <75 years) | £682 (23.72 SE) | γ (827.17, 0.82)* | CPRD-HES3 |
| 3-monthly cost when hospitalised (age ≥75 years) | £8057 (192.77 SE) | γ (1746.96, 4.61)* | CPRD-HES3 |
| 3-monthly cost when not-hospitalised (age ≥75 years) | £569 (14.52 SE) | γ (1536.51, 0.37)* | CPRD-HES3 |
| Clinically guided unscheduled outpatient visits (24 months) | 1.10 (0.13 SE) | γ (71.60, 0.02)* | PRIMA27 |
| BNP-guided unscheduled outpatient visits (24 months) | 1.40 (0.14 SE) | γ (94.52, 0.02)* | PRIMA27 |
| BNP-guided additional cost of medications (18 months) | £58.32 (6.20 SE) | γ (88.42, 0.66)* | TIME-CHF11 |
| Unit cost of an outpatient visit | £123 | Fixed | DoH28 |
| Unit cost of a BNP test | £25 | Fixed | NICE29 |
*β and γ parameters were determined using the methods of moments described elsewhere.30
CPRD, Clinical Practice Research Database; HES, Hospital Episode Statistics.
Baseline probabilities: mortality
We used routinely collected CPRD-ONS linked data from April 2005 up to the censoring date of April 2014, including 52 122 patients with a HF hospital admission (identified by ICD-10 diagnosis code), to estimate the monthly mortality rate in clinical practice in the absence of BNP-guided care. The mean (SD) age of the patients at admission was 77.9 (12) years, and 49% were female. This allowed us to estimate survival over a longer time period than is available from RCTs. We excluded patients who died in hospital or within 7 days of discharge, as they would be unlikely to be eligible for BNP-guided care, and a small minority who had frequent BNP testing indicating that they were already receiving BNP-guided care. Time between discharge from first HF admission to all-cause mortality and all-cause rehospitalisation were calculated. Parametric survival models (assuming an Exponential distribution and a Weibull distribution) were fitted to the data fitting age (dichotomised into <75 and ≥75 years) to obtain estimates of age-specific all-cause hazard rates. These survival analyses were carried out in Stata V.14.0. In our primary analyses, we used the exponential hazard rate of 0.009 to estimate survival for younger patients for the first 8 years of the model. In a sensitivity analysis (SA1), we used the Weibull hazard rate of 0.017 together with the ancillary parameter estimate of 0.842 to estimate survival for younger patients for the first 8 years of the model.
Beyond the initial period, we used age-specific and sex-specific ONS UK life-tables23 to estimate survival, assuming that two-thirds of patients were male7 and inflating population mortality for the HF population using a RR derived from an observational study.24 van Jaarsveld et al24 report 32% survival at 7-year for 293 incident HF cases diagnosed in the Netherlands between 1993 and 1998, compared with 70% survival among 586 age and sex-matched controls without HF. These 7-year survival probabilities were converted to 3-monthly survival probabilities. The majority of patients recruited to trials had HFrEF. After adjusting for age, gender and other covariates, mortality has been demonstrated to be lower in patients with HFpEF.25 31 Therefore, we adjusted survival in the HFpEF subgroup evaluated in our model, using results from a cohort of more than 6500 patients hospitalised for HF which reported an adjusted 1-year mortality RR of 1.25 (95% CI 1.12 to 1.41) in patients with HFrEF versus HFpEF.25
Relative effects: mortality
We used an IPD meta-analysis to estimate the relative effect of BNP-guided care on survival. Brunner-La Rocca et al6 analysed seven RCTs in patients (n=1580) with HFrEF and four RCTs in patients (n=296) with HFpEF. In younger patients (<75 years), they found the strongest evidence of a beneficial effect of BNP-guided care among patients with HFrEF (HR 0.68 (95% CI 0.48 to 0.96); n=881), while the evidence was weaker for younger patients with HFpEF (HR 0.76 (0.29 to 1.96); n=96). In older patients (≥75 years) with HFrEF, the evidence was inconclusive (HR 0.87 (0.65 to 1.16); n=850), but did not exclude the possibility of a clinically important effect.
Long-term follow-up is unavailable for most RCTs. In the TIME-CHF RCT,32 BNP-guided care ceased at 18 months; over a 5-year follow-up period, the study found a non-significant trend for improved survival in younger HFrEF patients with treatment guided by BNP (HR 0.62 (0.37 to 1.03)). Very few patients were followed-up for the full 5 years. In our primary analyses, we assumed that the relative effect of BNP-guided care would end after 4 years. However, it is plausible that BNP-guided care becomes ineffective or less effective before 4 years if, for example, compliance with care decreases or the efficacy of care decreases with age. Equally, the relative effect may extend beyond 4 years. To test the importance of this assumption, we performed sensitivity analyses assuming that the relative effect and cost of BNP-guided care cease at 2 years (SA2) or that the relative effect extends for the lifetime of patients (SA3).
Baseline probabilities and relative effects: hospitalisation
In the clinically guided group, we used survival analysis of CPRD-ONS linked data, as described earlier, to estimate the monthly hazard rate of all-cause hospitalisation. We then applied this hazard rate throughout the lifetime of patients in the model. Neither Troughton et al7 nor Brunner-La Rocca et al6 reported HRs for all-cause hospitalisation stratified by LVEF status. In the absence of evidence, to estimate the relative effect of all-cause hospitalisation in the BNP-guided group, we used a HR of 0.94 (0.84 to 1.07) for patients with any type of HF as reported in an IPD meta-analysis by Troughton et al.7 We modelled all-cause hospitalisation in our analyses. This is consistent with our focus on all-cause mortality and allows for the possibility that savings through reduced HF readmissions might be partially offset by more admissions for concomitant disorders or side effects of more intensive HF pharmacotherapy. Cohort data comparing patients with HFrEF versus HFpEF suggest that, after adjustment for covariates, there is negligible difference in the risk of all-cause hospitalisation at 1 year.25 Therefore, we used the same risk of all-cause hospitalisation for patients with HFrEF and HFpEF.
Cost parameters
We included the costs of: (1) BNP and renal testing; (2) BNP-related uptitration of pharmacotherapy; (3) unscheduled outpatient appointments; (4) managing patients with HF in the community; and (5) treating patients with HF in hospital.
The cost of a BNP blood test is £15–25.29 We used the top end of this range to include the costs of additional renal function tests. We tested the sensitivity of model results to a 50% decrease (SA4) and 50% increase (SA5) in the cost of BNP testing. Cumulative costs depend on the frequency and duration of BNP monitoring. Based on several RCTs,16–18 we assumed 3-monthly BNP testing and that costs of BNP testing and uptitration of medications would cease at 18 months.
There is mixed evidence of the effect of BNP-guided care on drug usage. Some trials17 18 27 reported increases in doses of some drugs in the BNP-guided arm, whereas others16 33 34 do not. In the TIME-CHF RCT economic evaluation,11 medication costs were 12% higher (US$747 vs US$668; p=0.04 (2006 values)) in the BNP-guided arm over an 18-month follow-up period. We used this incremental cost (US$79), inflated to 2013/2014 values and converted to £58.32, to estimate the potential increase in medication costs. BNP-guided care might also increase the number of unscheduled outpatient visits due to increased side effects of pharmacotherapy; however, most trials do not report this outcome. The PRIMA trial27 found inconclusive evidence of a higher mean number of unscheduled outpatient appointments in the BNP-guided arm than the clinically guided arm at 2 years (1.4 vs 1.1; p=0.06). We used this estimate and a unit cost of £123 per outpatient appointment.28
We used CPRD-HES linked data,3 to estimate the age-subgroup specific mean costs (table 2) of NHS care during a 3-month period for patients hospitalised with HF at some point during that period and patients not hospitalised during that period. In brief, we identified 1555 patients in England who died with HF in 2012/2013. Of these patients, 47.4% were female and 60.2% had HF diagnosis in the last 2 years, and the mean (SD) age at death was 83 (10) years. We estimated the cost of medications, primary and hospital healthcare during each 90-day period in the 5 years before death. These analyses found no strong evidence of additional NHS costs for patients with left ventricular dysfunction (mean incremental cost: £234 (95% CI −£113 to £580)), and therefore, we used the same estimates in HFrEF and HFpEF subgroup analyses. All costs were estimated in 2013/2014 GBP£.
Utility parameters
We conducted a structured search of MEDLINE and EMBASE to identify studies which reported utility scores, preferably using the EQ-5D, in patients with HF stratified by hospitalisation status. We included keywords and medical subject headings for HF, utilities and QALYs. The ASCEND-HF multinational trial26 reports utility scores among more than 6000 patients hospitalised with acute decompensated HF and randomised to nesiritide or placebo. EQ-5D-3L scores were collected at baseline, 24 hours, discharge and 30 days. In the placebo arm, the mean (SD) EQ-5D-3L utility scores increased from 0.55 (0.29) at admission to 0.66 (0.26) at 24 hours and 0.77 (0.23) at discharge. EQ-5D-3L scores did not change substantially postdischarge; 0.74 (0.25). We assumed that the utility score at 24 hours was representative of the average utility score (Uh) of patients with acute decompensation during hospitalisation and that the utility score at discharge was representative of average utility score (Unh) among patients with stable HF not-hospitalised. We assumed that these two utility values were independent of monitoring strategy; therefore, any improvement in quality of life from BNP-guided care in the model is the result of reducing the risk of readmission. Evidence from most RCTs,16 17 27 34 which have measured quality of life, indicates no difference between patients with BNP-guided versus clinically guided care. We assumed that utility values did not decline with age or differ by LVEF status.
Using the CPRD-HES linked data on the 1555 patients described above, we estimated that patients with HF hospitalised would have a mean (SE) length of stay of 13.21 (0.39) days within a 3-month cycle. Therefore, the mean QALYs gained during a 3-month (ie, 91.31-day) cycle which included a hospitalisation (QALYsh) and non-hospitalisation (QALYsnh) are:
 |
where Ph represents the proportion of hospitalised patients at each cycle and Pnh represents the proportion of not-hospitalised patients at each cycle.
Probabilistic sensitivity analysis
We used probabilistic sensitivity analysis (PSA) to estimate 95% CIs around the results.35 Monte Carlo simulation was used to draw a randomly selected estimate of each model parameter from the distribution described in tables 1 and 2 and calculate the iNMB. β distributions were used to represent the uncertainty in the probability and utility parameters because these values are typically bounded at zero and one. Log-normal distributions were used to estimate uncertainty in hazard rates and ratios. γ distributions were used to represent the uncertainty in the cost parameters because these values are constrained to be non-negative, but can have skewed distributions. We used 10 000 iterations to empirically estimate the uncertainty surrounding the mean iNMB. We built the model in Microsoft Excel, and programmed in Visual Basic for Applications.
Results
Our results indicate that BNP-guided care is more costly, but also more effective, than clinically guided care over the lifetime of younger patients (<75 years) with HFrEF (table 3). The median survival is longer in patients with BNP-guided care (7.75 vs 6.43 years; figure 2). The difference in the mean QALYs is smaller (5.57 vs 5.02; table 3), reflecting the imperfect health of survivors and the discounting of health gained in future years. Lifetime costs are estimated to be higher in patients with BNP-guided care (£63 527 vs £58 139; table 3) as the potential for decreased hospitalisation is more than offset by BNP testing and the costs of healthcare during the extended survival period. The positive iNMB statistic (£5424 (95% CI £987 to £9469); table 3) indicates that BNP-guided care is cost-effective in this subgroup. The CI is broad, primarily due to the uncertainty around the relative effect of BNP-guided care on mortality; however, it does not include zero. There is a high probability (0.99) that BNP-guided care is cost-effective in this subgroup at the willingness-to-pay threshold of £20 000 per QALY (figure 3).
Table 3.
Cost-effectiveness results in three patient subgroups
| Clinically guided |
BNP-guided |
|||||
|---|---|---|---|---|---|---|
| Subgroup | Cost* | QALYs* | Cost* | QALYs* | iNMB† (95% CI) | ICER* |
| HFrEF patients <75 years | £58 139 | 5.02 | £63 527 | 5.57 | £5424 (£987 to £9469) | £9840 |
| HFpEF patients <75 years | £67 694 | 5.86 | £71 097 | 6.23 | £3155 (−£10 307 to £11 613) | £9066 |
| HFrEF patients ≥75 years | £26 093 | 2.20 | £27 676 | 2.39 | £2267 (−£1524 to £6074) | £8123 |
*Deterministic analysis.
†Probabilistic sensitivity analysis.
ICER, incremental cost-effectiveness ratio; iNMB, incremental net monetary benefit.
Figure 2.

Survival curves for the three patient subgroups.
Figure 3.

Cost-effectiveness acceptability curves for each of the three patient subgroups in the B-type natriuretic peptide (BNP)-guided care. The circles represent the willingness-to-pay thresholds beyond which the BNP-guided care is most likely to be cost-effective.
The evidence of cost-effectiveness of BNP-guided care is less strong for the subgroup of younger patients with HFpEF. The median survival (9.54 vs 8.43 years; figure 2) and mean QALYs (6.23 vs 5.86; table 3) are higher in patients with BNP-guided care. However, the iNMB is relatively small with a broad CI spanning zero (£3155 (−£10 307 to £11 613); table 3). Nevertheless, there is a relatively high probability (0.75) that BNP-guided care is cost-effective in this subgroup at the willingness-to-pay threshold of £20 000 per QALY (figure 3).
There is some evidence that BNP-guided care has the potential to be cost-effective among older patients (≥75 years) with HFrEF. However, life expectancy (figure 2) is much shorter in this subgroup than in younger patients; and therefore, the estimated gain in QALYs (2.39 vs 2.20; table 3) and the iNMB are small, and the CI spans zero (£2267 (−£1524 to £6074); table 3). There is a relatively high probability (0.88) that BNP-guided care is cost-effective in this subgroup at the willingness-to-pay threshold of £20 000 per QALY (figure 3).
Sensitivity analyses
The estimated value of BNP-guided care is sensitive to assumptions about its sustained effect (table 4). If the relative effect and cost of BNP-guided care cease at 2 years (SA2), the incremental costs and QALYs are smaller. However, the conclusion that BNP-guided care is probably cost-effective in younger patients with HFrEF does not change (iNMB: £2834 (£284 to £5079)). If the benefit of BNP-guided care is sustained over patient lifetimes (SA3), the estimated cost-effectiveness (iNMB: £12 275 (£1090 to £24 289)) increases greatly. Substituting a Weibull survival model (SA1) and changing the unit cost of the BNP test (SA4, SA5) had minimal impact on conclusions about cost-effectiveness.
Table 4.
Sensitivity analyses based on heart failure with reduced ejection fraction patients <75 years
| Clinically guided |
BNP-guided |
|||||
|---|---|---|---|---|---|---|
| Sensitivity analysis (SA) | Cost* | QALYs* | Cost* | QALYs* | iNMB† (95% CI) | ICER* |
| SA1: Weibull form of survival function | £59 025 | 5.10 | £64 939 | 5.69 | £5775 (£936 to £10 073) | £9983 |
| SA2: BNP-guided care cease at 2 years | £58 139 | 5.02 | £61 327 | 5.33 | £2834 (£284 to £5079) | £10 387 |
| SA3: BNP-guided care continue for lifetime | £58 139 | 5.02 | £71 197 | 6.29 | £12 275 (£1090 to £24 289) | £10 274 |
| SA4: Low cost (£12.5) of a BNP test | £58 139 | 5.02 | £63 458 | 5.57 | £5453 (£993 to £9467) | £9714 |
| SA5: High cost (£37.5) of a BNP test | £58 139 | 5.02 | £63 596 | 5.57 | £5303 (£800 to £9328) | £9966 |
*Deterministic analysis.
†Probabilistic sensitivity analysis.
ICER, incremental cost-effectiveness ratio; iNMB, incremental net monetary benefit.
Discussion
Principal findings
We found strong evidence that BNP-guided care is a cost-effective alternative to clinically guided care in younger patients (<75 years) recently hospitalised with HFrEF. This conclusion holds even if the impact of BNP-guided care on mortality is assumed to dissipate after 2 years. The upfront costs of BNP-guided care are justified by improvements in survival. There is no strong evidence that costs of BNP-guided care will be offset by fewer hospitalisations. We also found that BNP-guided care has the potential to be cost-effective in younger patients with HFpEF and older patients (≥75 years) with HFrEF. However, more evidence is required before any firm conclusions can be drawn in these patient subgroups. Relatively, few younger patients with HFpEF are included in RCTs and, therefore, conclusions about cost-effectiveness in this subgroup are tentative. Although a larger number of older patients with HFrEF have participated in RCTs, the effectiveness of BNP-guided care appears to be attenuated in this subgroup and cost-effectiveness remains unproven.
Strengths and weaknesses
Our analyses used estimates from IPD meta-analyses6 7 of ∼2000 patients participating in several RCTs. We investigated the cost-effectiveness of BNP-guided care in subgroups of patients which were not reported in the original RCT publications. Within each subgroup, the meta-analysis preserves the original randomisation; however, comparison of effect sizes between subgroups may be confounded by study as some RCTs contribute no data to some subgroups (eg, HFpEF).36 In most RCTs, participants and clinicians were not blind to group allocation, introducing the possibility of performance bias including better ancillary care in the BNP-guided care group unrelated to BNP levels. We conducted the PSA to estimate the uncertainty around our estimates, which allowed us to identify patient subgroups where further evidence is needed. We had insufficient data to estimate the correlation between model parameters which would have allowed a better estimate of the uncertainty in our model results. Deterministic sensitivity analyses allowed us to demonstrate that plausible changes to assumptions about the sustained benefit of BNP-guided care do not alter conclusions that BNP-guided care is cost-effective in younger patients with HFrEF, but are influential in estimating the absolute health benefit for patients.
We used a highly simplified two-state Markov model to track costs and patient outcomes. A model tracking dysfunction (eg, NYHA class) and the probability of hospitalisation and death conditional on dysfunction would provide a more realistic representation of disease progression and the increase in healthcare costs at the end of life. For example, Ieva et al37 used routine data to model the decrease in time to readmission with each successive admission and the association between age, gender and readmission. The simplicity of our model might lead to poor estimates of cost-effectiveness if BNP-guided care has a large effect on functional decline among survivors. However, several RCTs16 17 27 34 provide little evidence of improved quality of life among survivors with BNP-guided care. None of the RCTs provided evidence on utility scores; therefore, we used scores reported elsewhere in the HF literature which may not be representative of patients eligible for BNP monitoring. Our analyses focus on costs to the health service, rather than wider costs falling on social care or patients and families. BNP-guided care will be more cost-effective if, for example, it results in fewer admissions to residential or nursing homes.
Comparisons with other studies
The TIME-CHF RCT economic evaluation11 in HFrEF patients (mean age 76 years) estimated higher costs (US$384 (−$3462 to $4803); after excluding residential costs) and higher QALYs (0.05 (−0.02 to 0.11)) in patients with BNP-guided care at 18 months.11 The authors concluded that BNP-guided care had a high probability of being cost-effective, but noted that this probability was lower in older patients. Laramée et al14 published the only UK-based economic model of BNP-guided care, developing previous work included in the NICE HF clinical guidelines.8 Their analysis is based on aggregate, rather than individual patient, data from six RCTs. The structure of their model is similar to ours, but the key model parameter estimates differ. They conclude that BNP-guided care is most probably cost-effective in patients with HFrEF and in younger patients with HF from any cause. An acknowledged limitation of their analysis is that they could not explore cost-effectiveness in patients with HFpEF.
Implications for clinicians and policymakers
Although BNP tests are relatively cheap, there will be logistical and financial challenges to routine implementation in the UK. If, as in most RCTs, BNP monitoring is conducted in an outpatient setting by physicians skilled in HF care, existing gaps between guidelines and current practice need to be bridged; many patients in the UK do not receive cardiology or HF nurse follow-up.38 Cost-effectiveness results based on trials of BNP monitoring by specialists in outpatient settings cannot be simply generalised to primary care. The BATTLESCARRED RCT16 compared BNP-guided and clinically guided care in a specialist clinic with usual primary care and found that usual primary care resulted in inferior survival at 1 year. The SIGNAL-HF RCT34 which recruited patients with stable HF in primary care found no important improvements in clinical outcomes for patients with BNP-guided care.
Another hurdle to implementing BNP-guided care is that there is little consensus on the optimal frequency, duration and BNP target for monitoring. Developments in medical therapy will also influence the use of monitoring. New drugs, such as Entresto, which inhibits neprilysin and increases the levels of natriuretic peptides, would require different monitoring strategies.39 However, NT-proBNP will remain a useful biomarker in this situation.40
Unanswered questions and future research
Most uncertainty in our model is caused by wide CIs surrounding the relative effect of BNP-guided care, particularly in patient subgroups not well represented in RCTs. The ongoing GUIDE-IT trial41 will be vital in providing better evidence in older patients with HFrEF and in supporting or refuting existing evidence from smaller RCTs for younger patients with HFrEF. Larger numbers of RCT participants will enable more detailed exploration of other patient subgroups. For instance, comorbidities may explain the lower efficacy of BNP-guided care in older patients.6 The potential for harm from aggressive medication titration among elderly patients or those with significant renal dysfunction needs to be explored further before firm conclusions can be drawn in these patient groups.42
Despite the high prevalence of HF, there is surprisingly little research on the economic impact on health systems, families and societies.3 Future research, particularly on residential care needs, informal care needs and productivity losses due to HF, is needed in order to better judge the economic case for interventions like BNP-guided care.
Acknowledgments
SM's time is supported by the National Institute for Health Research (NIHR) Collaboration for Leadership in Applied Health Research and Care West (CLAHRC West) at University Hospitals Bristol National Health Service (NHS) Foundation Trust. BR is supported in part by the NIHR Bristol Cardiovascular Biomedical Research Unit.
Footnotes
Contributors: BR, MP, CR, WH, MD and TM conceived the overall study design and acquired funding. SM and WH developed the Markov model and identified the model parameters, including the use of statistical analyses conducted by RM. MD, JM, TM and SP commented on the clinical validity of the model. SM and WH performed the model analysis and drafted the manuscript. All authors revised the manuscript critically for intellectual content and approved the submitted manuscript.
Funding: This study is part of a larger study funded by the UK NIHR Health Technology Assessment (HTA 11/102/03) programme.
Disclaimer: The views expressed are those of the authors and not necessarily those of the NHS, the NIHR or the Department of Health.
Competing interests: None declared.
Provenance and peer review: Not commissioned; externally peer reviewed.
Data sharing statement: No additional data are available.
References
- 1.Cook C, Cole G, Asaria P et al. The annual global economic burden of heart failure. Int J Cardiol 2014;171:368–76. 10.1016/j.ijcard.2013.12.028 [DOI] [PubMed] [Google Scholar]
- 2.Townsend N, Williams J, Bhatnagar P et al. Cardiovascular disease statistics 2014. London: British Heart Foundation, 2014. [Google Scholar]
- 3.Hollingworth W, Biswas M, Maishman RL et al. The healthcare costs of heart failure during the last five years of life: a retrospective cohort study. Int J Cardiol 2016;224:132–8. 10.1016/j.ijcard.2016.09.021 [DOI] [PubMed] [Google Scholar]
- 4.Mueller C. Cost-effectiveness of B-type natriuretic peptide testing. Congest Heart Fail 2008;14(Suppl 1):35–7. 10.1111/j.1751-7133.2008.08312.x [DOI] [PubMed] [Google Scholar]
- 5.National Institute for Clinical Excellence (NICE). Chronic heart failure: costing report. London: NICE, 2010. https://www.nice.org.uk/guidance/cg108/resources/costing-report-134800813 (accessed Mar 2015). [Google Scholar]
- 6.Brunner-La Rocca HP, Eurlings L, Richards AM et al. Which heart failure patients profit from natriuretic peptide guided therapy? A meta-analysis from individual patient data of randomized trials. Eur J Heart Fail 2015;17:1252–61. 10.1002/ejhf.401 [DOI] [PubMed] [Google Scholar]
- 7.Troughton RW, Frampton CM, Brunner-La Rocca HP et al. Effect of B-type natriuretic peptide-guided treatment of chronic heart failure on total mortality and hospitalization: an individual patient meta-analysis. Eur Heart J 2014;35:1559–67. 10.1093/eurheartj/ehu090 [DOI] [PMC free article] [PubMed] [Google Scholar]
- 8.National Institute for Health and Clinical Excellence (NICE). CG108 Chronic heart failure in adults: management, 2010. https://www.nice.org.uk/guidance/cg108/resources/chronic-heart-failure-in-adults-management-35109335688901 (accessed Mar 2015).
- 9.Yancy CW, Jessup M, Bozkurt B et al. 2013 ACCF/AHA guideline for the management of heart failure: a report of the American College of Cardiology Foundation/American Heart Association Task Force on Practice Guidelines. J Am Coll Cardiol 2013;62:e147–239. 10.1016/j.jacc.2013.05.019 [DOI] [PubMed] [Google Scholar]
- 10.Adlbrecht C, Huelsmann M, Berger R et al. Cost analysis and cost-effectiveness of NT-proBNP-guided heart failure specialist care in addition to home-based nurse care. Eur J Clin Invest 2011;41:315–22. 10.1111/j.1365-2362.2010.02412.x [DOI] [PubMed] [Google Scholar]
- 11.Sanders-van Wijk S, van Asselt AD, Rickli H et al. Cost-effectiveness of N-terminal pro-B-type natriuretic-guided therapy in elderly heart failure patients: results from TIME-CHF (Trial of Intensified versus Standard Medical Therapy in Elderly Patients with Congestive Heart Failure). JACC Heart Fail 2013;1:64–71. 10.1016/j.jchf.2012.08.002 [DOI] [PubMed] [Google Scholar]
- 12.Moertl D, Steiner S, Coyle D et al. Cost-utility analysis of NT-proBNP-guided multidisciplinary care in chronic heart failure. Int J Technol Assess Health Care 2013;29:3–11. 10.1017/S0266462312000712 [DOI] [PubMed] [Google Scholar]
- 13.Morimoto T, Hayashino Y, Shimbo T et al. Is B-type natriuretic peptide-guided heart failure management cost-effective? Int J Cardiol 2004;96:177–81. 10.1016/j.ijcard.2003.05.036 [DOI] [PubMed] [Google Scholar]
- 14.Laramée P, Wonderling D, Swain S et al. Cost-effectiveness analysis of serial measurement of circulating natriuretic peptide concentration in chronic heart failure. Heart 2013;99:267–71. 10.1136/heartjnl-2012-302692 [DOI] [PubMed] [Google Scholar]
- 15.Berger R, Moertl D, Peter S et al. N-terminal pro-B-type natriuretic peptide-guided, intensive patient management in addition to multidisciplinary care in chronic heart failure a 3-arm, prospective, randomized pilot study. J Am Coll Cardiol 2010;55:645–53. 10.1016/j.jacc.2009.08.078 [DOI] [PubMed] [Google Scholar]
- 16.Lainchbury JG, Troughton RW, Strangman KM et al. N-terminal pro-B-type natriuretic peptide-guided treatment for chronic heart failure: results from the BATTLESCARRED (NT-proBNP-Assisted Treatment To Lessen Serial Cardiac Readmissions and Death) trial. J Am Coll Cardiol 2009;55:53–60. 10.1016/j.jacc.2009.02.095 [DOI] [PubMed] [Google Scholar]
- 17.Pfisterer M, Buser P, Rickli H et al. BNP-guided vs symptom-guided heart failure therapy: the Trial of Intensified vs Standard Medical Therapy in Elderly Patients with Congestive Heart Failure (TIME-CHF) randomized trial. JAMA 2009;301:383–92. 10.1001/jama.2009.2 [DOI] [PubMed] [Google Scholar]
- 18.Troughton RW, Frampton CM, Yandle TG et al. Treatment of heart failure guided by plasma aminoterminal brain natriuretic peptide (N-BNP) concentrations. Lancet 2000;355:1126–30. 10.1016/S0140-6736(00)02060-2 [DOI] [PubMed] [Google Scholar]
- 19.Weinstein MC, Torrance G, McGuire A. QALYs: the basics. Value Health 2009;12(Suppl 1):S5–9. 10.1111/j.1524-4733.2009.00515.x [DOI] [PubMed] [Google Scholar]
- 20.National Institute for Clinical Excellence (NICE). Guide to the methods of technology appraisal 2013. http://www.nice.org.uk/article/pmg9/resources/non-guidance-guide-to-the-methods-of-technology-appraisal-2013-pdf
- 21.Rawlins MD, Culyer AJ. National Institute for Clinical Excellence and its value judgments. BMJ 2004;329:224–7. 10.1136/bmj.329.7459.224 [DOI] [PMC free article] [PubMed] [Google Scholar]
- 22.Fenwick E, Byford S. A guide to cost-effectiveness acceptability curves. Br J Psychiatry 2005;187:106–8. 10.1192/bjp.187.2.106 [DOI] [PubMed] [Google Scholar]
- 23.Office for National Statistics. United Kingdom, national life tables, 1980–82 to 2012–14, 2015. https://www.ons.gov.uk/file?uri=/peoplepopulationandcommunity/birthsdeathsandmarriages/lifeexpectancies/datasets/nationallifetablesunitedkingdomreferencetables/current/nltuk1315reg.xls (accessed Nov 2015).
- 24.van Jaarsveld CH, Ranchor AV, Kempen GI et al. Epidemiology of heart failure in a community-based study of subjects aged > or = 57 years: incidence and long-term survival. Eur J Heart Fail 2006;8:23–30. 10.1016/j.ejheart.2005.04.012 [DOI] [PubMed] [Google Scholar]
- 25.Nichols GA, Reynolds K, Kimes TM et al. Comparison of risk of re-hospitalization, all-cause mortality, and medical care resource utilization in patients with heart failure and preserved versus reduced ejection fraction. Am J Cardiol 2015;116:1088–92. 10.1016/j.amjcard.2015.07.018 [DOI] [PubMed] [Google Scholar]
- 26.Reed SD, Kaul P, Li YH et al. Medical resource use, costs, and quality of life in patients with acute decompensated heart failure: findings from ASCEND-HF. J Card Fail 2013;19:611–20. 10.1016/j.cardfail.2013.07.003 [DOI] [PubMed] [Google Scholar]
- 27.Eurlings LW, van Pol PE, Kok WE et al. Management of chronic heart failure guided by individual N-terminal pro-B-type natriuretic peptide targets: results of the PRIMA (Can PRo-brain-natriuretic peptide guided therapy of chronic heart failure IMprove heart fAilure morbidity and mortality?) study. J Am Coll Cardiol 2010;56:2090–100. 10.1016/j.jacc.2010.07.030 [DOI] [PubMed] [Google Scholar]
- 28.Department of Health. NHS reference costs 2013 to 2014, 2014. https://www.gov.uk/government/uploads/system/uploads/attachment_data/file/380322/01_Final_2013-14_Reference_Costs_publication_v2.pdf (accessed May 2015).
- 29.National Institute for Clinical Excellence (NICE). Chronic heart failure shared learning: use of the scenarios simulation in the introduction of serum natriuretic peptide testing. London: NICE, 2011. [Google Scholar]
- 30.Briggs A, Sculpher M, Claxton K. Decision modelling for health economic evaluation. Oxford University Press, 2006. [Google Scholar]
- 31.Meta-analysis Global Group in Chronic Heart Failure. The survival of patients with heart failure with preserved or reduced left ventricular ejection fraction: an individual patient data meta-analysis. Eur Heart J 2012;33:1750–7. 10.1093/eurheartj/ehr254 [DOI] [PubMed] [Google Scholar]
- 32.Sanders-van Wijk S, Maeder MT, Nietlispach F et al. Long-term results of intensified, N-terminal-pro-B-type natriuretic peptide-guided versus symptom-guided treatment in elderly patients with heart failure: five-year follow-up from TIME-CHF. Circ Heart Fail 2014;7:131–9. 10.1161/CIRCHEARTFAILURE.113.000527 [DOI] [PubMed] [Google Scholar]
- 33.Karlström P, Alehagen U, Boman K et al. Brain natriuretic peptide-guided treatment does not improve morbidity and mortality in extensively treated patients with chronic heart failure: responders to treatment have a significantly better outcome. Eur J Heart Fail 2011;13:1096–103. 10.1093/eurjhf/hfr078 [DOI] [PubMed] [Google Scholar]
- 34.Persson H, Erntell H, Eriksson B et al. Improved pharmacological therapy of chronic heart failure in primary care: a randomized Study of NT-proBNP Guided Management of Heart Failure—SIGNAL-HF (Swedish Intervention study—Guidelines and NT-proBNP AnaLysis in Heart Failure). Eur J Heart Fail 2010;12:1300–8. 10.1093/eurjhf/hfq169 [DOI] [PubMed] [Google Scholar]
- 35.Claxton K. Exploring uncertainty in cost-effectiveness analysis. Pharmacoeconomics 2008;26:781–98. 10.2165/00019053-200826090-00008 [DOI] [PubMed] [Google Scholar]
- 36.Thompson SG, Higgins JP. Treating individuals 4: can meta-analysis help target interventions at individuals most likely to benefit? Lancet 2005;365:341–6. 10.1016/S0140-6736(05)17790-3 [DOI] [PubMed] [Google Scholar]
- 37.Ieva F, Jackson CH, Sharples LD. Multi-state modelling of repeated hospitalisation and death in patients with heart failure: the use of large administrative databases in clinical epidemiology. Stat Methods Med Res 2015:1–23. 10.1177/0962280215578777 [DOI] [PMC free article] [PubMed] [Google Scholar]
- 38.British Society for Heart Failure. National Heart Failure Audit: April 2013—March 2014. National Institute for Cardiovascular Outcomes Research. London, 2015. [Google Scholar]
- 39.McMurray JJV, Packer M, Desai AS et al. Angiotensin-neprilysin inhibition versus enalapril in heart failure. N Engl J Med 2014;371:993–1004. 10.1056/NEJMoa1409077 [DOI] [PubMed] [Google Scholar]
- 40.Langenickel TH, Dole WP. Angiotensin receptor-neprilysin inhibition with LCZ696: a novel approach for the treatment of heart failure. Drug Discov Today Ther Strateg 2012;9:e131–9. 10.1016/j.ddstr.2013.11.002 [DOI] [Google Scholar]
- 41.Felker GM, Ahmad T, Anstrom KJ et al. Rationale and design of the GUIDE-IT study: guiding evidence based therapy using biomarker intensified treatment in heart failure. JACC Heart Fail 2014;2:457–65. 10.1016/j.jchf.2014.05.007 [DOI] [PMC free article] [PubMed] [Google Scholar]
- 42.Desai AS. Are serial BNP measurements useful in heart failure management? Serial natriuretic peptide measurements are not useful in heart failure management: the art of medicine remains long. Circulation 2013;127:509–16. 10.1161/CIRCULATIONAHA.112 [DOI] [PubMed] [Google Scholar]