Abstract
Acetoacetate (AA) is an important ketone body, which produces reactive oxygen species (ROS). Advanced glycation end products (AGEs) are defined as final products of glycation process whose production is influenced by the levels of ROS. The accumulation of AGEs in the body contributes to pathogenesis of many diseases including complications of diabetes, and Alzheimer’s and Parkinson's disease. Here we evaluated the impact of AA on production of AGEs upon incubation of human serum albumin (HSA) with glucose. The effect of AA on the AGEs formation of HSA was studied under physiological conditions after incubation with glucose for 35 days. The physical techniques including circular dichroism (CD) and fluorescence spectroscopy were used to assess the impact of AA on formation and structural changes of glycated HSA (GHSA). Our results indicated that the secondary and tertiary structural changes of GHSA were increased in the presence of AA. The fluorescence intensity measurements of AGEs also showed an increase in AGEs formation. Acetoacetate has an activator effect in formation of AGEs through ROS production. The presence of AA may result in enhanced glycation in the presence of glucose and severity of complications associated with accumulation of AGEs.
Keywords: Advanced glycation end products (AGEs), Acetoacetate, Reactive oxygen species (ROS), Ketone body, Glycated HSA, prolonged incubation
1. Introduction
Acetoacetate (AA) is an important ketone body. There are three types of ketone bodies in the body: 3-β-hydroxybutyrate (3BHB), acetone, and AA. Among these, AA and 3BHB are the major forms, and acetone is the least abundant ketone body (Laffel, 1999, and Persson, 1970). The lipolysis is increased when the relative or absolute deficiency of insulin is achieved (Guthrie & Jordan, 1972). Enhancement of lipolysis releases free fatty acids resulting in overproduction of ketone bodies in the blood (Adrogue, Wilson, 3rd Boyd, Suki, & Eknoyan, 1982). The pathological problems associated with increased concentrations of ketone bodies include diabetes, childhood hypoglycemia, growth hormone deficiency, intoxication with alcohol or salicylates, and several inborn metabolic disorders (Galan, Hernandez, & Jimenez, 2001).
Fasting and prolonged exercise can increase the amount of ketone bodies in normal individuals (Fery & Balasse, 1985). The amounts of ketone bodies may increase up to 25 mM in diabetic patients (Stephens, Sulway, & Watkins, 1971). The amount of ketone bodies in normal individuals is less than 0.5 mM (Candiloros et al., 1995). The high level of ketone bodies in the blood is a clinical feature of diabetes (Sulway, Trotter, Trotter, & Malins, 1971). Among ketone bodies, AA can produce reactive oxygen species (ROS), while 3BHB cannot (Jain, McVie, & Bocchini, 2006). Cell culture studies also showed AA can increase lipid peroxidation (Jain & Mcvie, 1999, Jain, Kannan, & Lim, 1998 and Jain, Kannan, & McVie, 1999) through enhancement of oxidative stress resulting from oxygen radical production (Jain, McVie, & Bocchini, 2006). Many studies have now shown the generation of oxygen radicals by AA (Jain, McVie, Jaramillo, & Chen, 1998 and Kelly, 1994). The 3BHB and acetone cannot produce oxygen radicals (Jain, McVie, & Bocchini, 2006).
ROS are also produced during glycation process resulting in enhanced glycation (Baynes & Thorpe, 2000). Glycation is a spontaneous reaction, which is called “Maillard reaction”. It occurs between the amino groups of biomacromolecule and reducing sugars (Voziyan et al., 2003). During the first stage (early stage) of this reaction, the carbonyl group of reducing sugars can binds to amino group of proteins via a nucleophilic attack forming a Schiff base within hours. During the second stage (intermediate stage), the Amadori products are produced through rearrangement of the Schiff base within weeks (Lapolla, Traldi, & Fedele, 2005). The first and second stages are reversible (Brownlee, Vlassara, & Cerami, 1984). In the irreversible late stage, AGEs are formed through oxidation, dehydration, and cyclization (Friedlander et al., 1996). Based on fluorescence property and cross-link formation, AGE components are classified into three groups. The first is AGEs which are fluorescent and have crosslinks (i.e. pentosidine). The second is AGEs which are fluorescent and lack crosslinks (i.e. N-(carboxymethyl) lysine (CML)). The third is AGEs which have crosslinks but are not fluorescent (i.e. pyrroline) (Ahmed, 2005). Pentosidine, which is an AGE with crosslink between arginine and lysine residues, has an excitation at 335 nm and its maximum emission is about 375–385 nm (Meerwaldt et al., 2005), and Crossline, which is an AGE with crosslink between two lysine, has an excitation at 380 nm and its emission is at 440 nm (A. Schmitt, J. Schmitt, Munch, & Gasic-Milencovic, 2005). Many diseases are attributed to accumulation of AGEs in different forms, including diabetes complications (Frye, Degenhardt, Thorpe, & Baynes, 1998), Parkinson’s (Stitt, 2001) and Alzheimer’s disease (Munch et al., 2002), and aging (Wolff, Jiang, & Hunt, 1991). In addition, the ROS which are generated during early and advanced glycation processes, exhibit cytotoxicity (Rahbar & Figarola, 2003). Thus, understanding the mechanisms which impact formation of AGEs has significant clinical implications.
Human serum albumin (HSA) is a globular protein with 585 amino acid residues consisting of three homologous domains (Sugio, Kashima, Mochizuki, Noda, & Kobayashi, 1999; Iranfar, Rajabi, Salari, & Chamani, 2012; Sarzehi, & Chamani, 2012; Khorsand Ahmadi, Mahmoodian Moghadam, Mokaberi, Saberi, & Chamani, 2015). HSA has 58 lysine residues, and 10 of these lysine residues can interact with carbonyl groups of other molecules. The lysine residues corresponding to amino acid positions 525, 439, 281 and 199 in HSA are most reactive (Iberg & Fliick, 1986; Kuznetsova, Sulatskaya, Povarova, & Turoverov, 2012; Sattar, Iranfar, Asoodeh, Saberi, Mazhari, & Chamani, 2012). The increasing concentration of AA in diabetes, and its role in ROS generation and glycation processes, suggests a relationship between AA and glycation process enhancing the pathogenesis of diabetes complications. The aim of this work was to investigate the effects of AA on glycation process and formation of AGEs.
2. Materials and Methods
2.1. Materials
HSA (96%, essentially fatty acid free) and AA were obtained from Sigma-Aldrich. β-D-glucose (Glc) and 2,4,6-trinitrobenzene sulfonic acid (TNBSA; 0.01%) were from Fluka. Luminol was purchased from Merck (Germany). All other chemicals were of analytical grade and were used without further purification.
2.2. Preparation of AGE-HSA
HSA (40 mg/ml) was dissolved in a buffer containing 50 mM potassium phosphate (pH 7.4), 1 mM EDTA and 1 mM sodium azide. HSA glycation process was initiated by adding 16.5 mM β-D-glucose in the presence or absence of 3.125 mM AA. The AA concentration was selected based on the concentration detected in diabetic individuals (Laffel, 1999). All samples were incubated under sterile conditions at 37°C, pH 7.4 in the dark (physiological-like condition) for 35 days. The incubation time (35 days) was selected to allow sufficient time for the completion of the last stages of HSA glycation to produce AGEs (Sattarahmady et al., 2007). At the end of incubation time, all samples were dialyzed against 50 mM sodium phosphate buffer (pH 7.4) at 4°C for 48 h, and then stored at −30°C. Protein concentration was determined by Bicinchoinic acid (BCA) assay using a standard curve. The standard curve was generated using bovine serum albumin (BSA). Incubation for every sample was repeated three times and the results were reported as averages of three independent experiments.
2.3. Free lysine measurements
The free amino groups of all HSA samples were determined using 2,4,6-trinitrobenzene sulfonic acid (TNBSA; 0.01% (W/V)) (Kakade & Liener, 1962). For this purpose, the proteins samples were directly dissolved (0.2 mg/ml) in buffer (0.1 M sodium bicarbonate, pH 8.5), and 0.25 ml of the 0.01% (w/v) solution of TNBSA was then added to 0.5 ml of each sample. After mixing, the samples were incubated at 37°C for 2 h, and 0.25 ml of 10% SDS and 0.125 ml of 1 N HCl was then added to each sample. The sample absorbance was read against a blank, which was prepared as control (a sample without albumin) at 335 nm. The results are presented as the degree of glycation (τ). τ =[(ODcontrol−ODmodified)×58]/ODcontrol (Cayot & Tainturier, 1997).
2.4. Thiol group measurements
The level of free thiol groups in all HSA samples was determined by Ellman's assay using 5, 5′-dithiobis, 2-nitrobenzoic acid (DTNB) (Ellman, 1959). Briefly, 100 µL of diluted protein samples in buffer (0.2 M phosphate buffer, pH 7.4) was mixed well with 50 µL of DTNB (3 mM) in 0.2 M phosphate at pH 7.4. The mixture was incubated for 15 minute at 37°C. The content of thiol groups for each sample was measured by reading the absorbance at 412 nm. The standard curve was prepared using various concentrations of L-cysteine (Sigma). The obtained results are expressed as the number of free –SH groups per mole of HSA.
2.5. ROS measurements
The determination of the level of ROS in all samples of HSA was carried out by chemiluminescence method (Shourian, Tavakoli, Ghourchian, & Rafiee-Pour, 2010). Briefly, 10 µl of luminol solution (final concentration was 2 × 10⁻⁷M in 100 mM carbonate buffer, pH 11) was added to 480 µl of diluted protein samples in buffer (100 mM carbonate buffer, pH 11) inside a cuvette. Then, 10 µl of diperiodatocuprate (DPC) solution (final concentration was 2 × 10⁻⁵ M in 100 mM carbonate buffer, pH 11) was added to the above solution. After the final step, chemiluminescence at 425 nm was recorded immediately during 3 seconds in the chemiluminescence mode of the fluorescence spectrophotometer (Eclipse; Varian Co, Australia). Each set of experiment was repeated at least 3 times. The results are reported as the chemiluminescence of incubated HSA with Glc+ AA and Glc alone that are normalized with HSA control.
2.6. Secondary structure measurements
The amounts of secondary structure were obtained using a CD spectrometer J-810 at 25°C. The protein concentrations were 0.5 mg/ml in 50 mM sodium phosphate buffer, pH 7.4. All CD spectra were converted to[θ]λ using the following equation (Eq. 1):
| (1) |
Where [θ]λ is the mean residue ellipticity (degcm2mol−2) at wavelength λ (nm), θλ is ellipticity (millidegrees) at λ, M0 is the mean residue weight, c is protein concentration (mg/ml), and l is path length (cm). The percentages of secondary structures were calculated using the CDNN CD Spectra Deconvolution Software (Version 2.1).
2.7. Trp- fluorescence measurements
The Trp-fluorescence spectra of all HSA samples were measured using Cary eclipse fluorescence spectrophotometer. The protein concentrations were 0.5 mg/ml in 50 mM sodium phosphate buffer (pH 7.4). The excitation of samples was at 285 nm and the emission spectra were collected at 300–600 nm. The excitation and emission slits were 5 nm.
2.8. AGEs- fluorescence measurements
The fluorescence from the glycated materials were collected at excitation wavelengths of 322, 335, 365 and 375 nm. The concentration of samples was 1.5 mg/ml in 50 mM sodium phosphate buffer pH 7.4. The emission spectra were collected over a wavelength range of 300–600 nm using a Cary eclipse fluorescence spectrophotometer. The slits of the excitation and emission were equal to 5 and 10 nm, respectively.
3. Results
3.1. Free lysine measurements
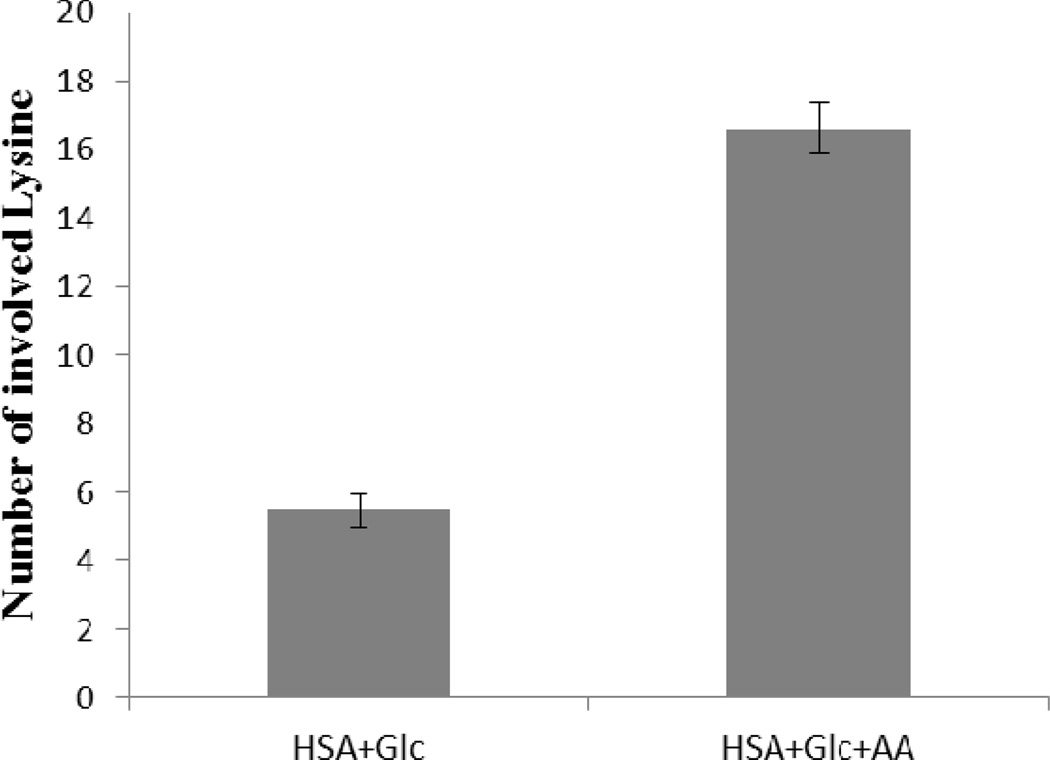
Figure 1 shows the number of modified Lys residues in HSA (HSA+Glc and HSA+Glc+AA) after 35 days of incubation. All data were normalized using HSA-control (the 35 day incubated HSA at 37°C and pH 7.4 without any modifying agent). Figure 1 shows that the numbers of involved lysine residues in HSA incubated with Glc+AA were higher than the number of involved lysine residues in HSA incubated with Glc alone. The number of involved lysine residues in HSA+Glc+AA was 3 times higher than HSA+Glc.
Figure 1.
Number of involved Lys residues in HSA+Glc and HSA +Glc+AA after 35 days of incubation at 37°C in 50 mM phosphate buffer with pH 7.4. All data were normalized using HSA- control (HSA 35D).
3.2. Thiol group measurements
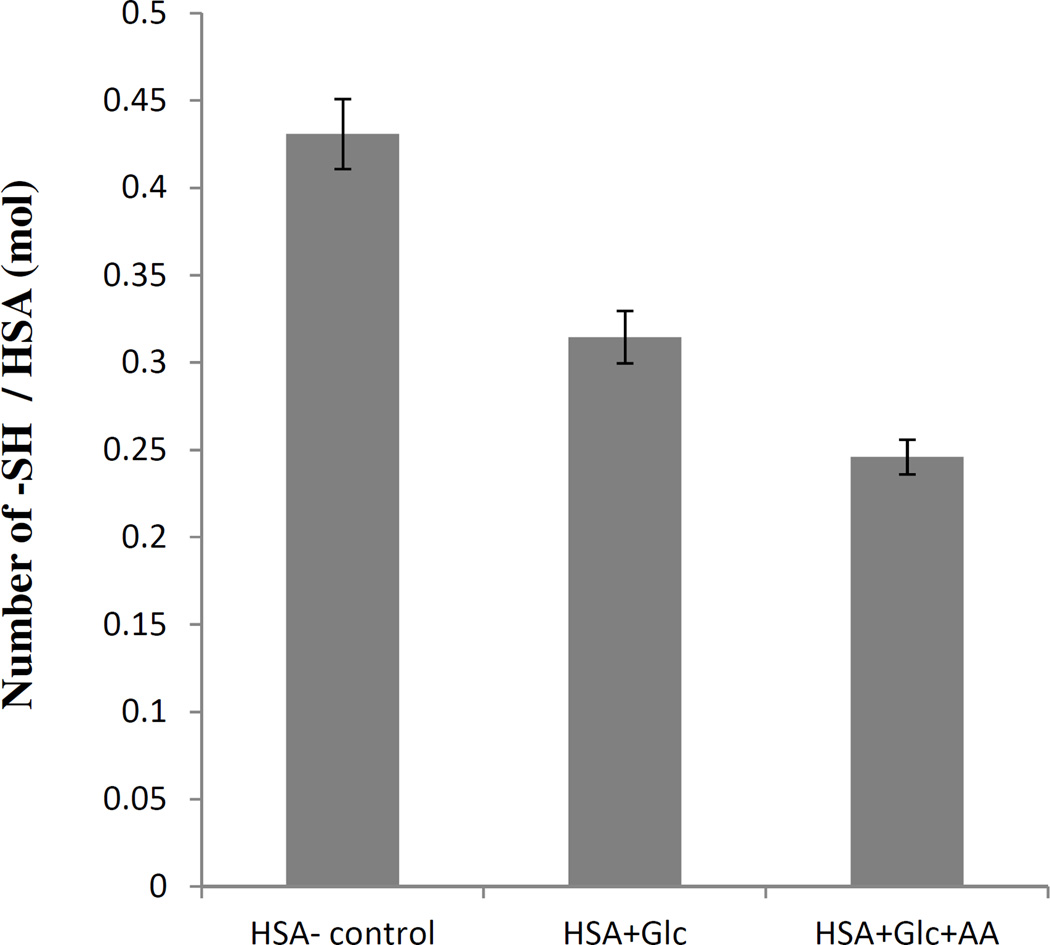
The determination of free thiol groups was performed according to Ellman's assay and the results are presented in Figure 2. These results showed a significant decrease in the number of free thiol groups in modified HSA. In comparison with HSA-control incubated, this decrease was more obvious for HSA incubated with AA+Glc.
Figure 2.
Thiol group contents of HAS-control, HSA+Glc and HSA +Glc+AA after 35 days of incubation at 37°C in 50 mM phosphate buffer pH 7.4.
3.3. ROS measurements
The amount of ROS formation was carried out according to chemiluminescence method. The results (Figure 3) showed a significant increase in the chemiluminescence intensity of HSA+Glc+AA than HSA+Glc sample.
Figure 3.
Chemilumiescnce intensity of HSA+Glc and HSA+Glc+AA at 425 nm using 2 × 10⁻⁷ M luminol and 2 × 10⁻⁵ M DPC as a catalyst in carbonate buffer (100 mM, pH 11) at 25°C. Before sample incubated in 50 mM sodium phosphate buffer (pH 7.4), 1 mM EDTA and 0.1 mM sodium azide at 37 °C.
3.4. Secondary structure measurements
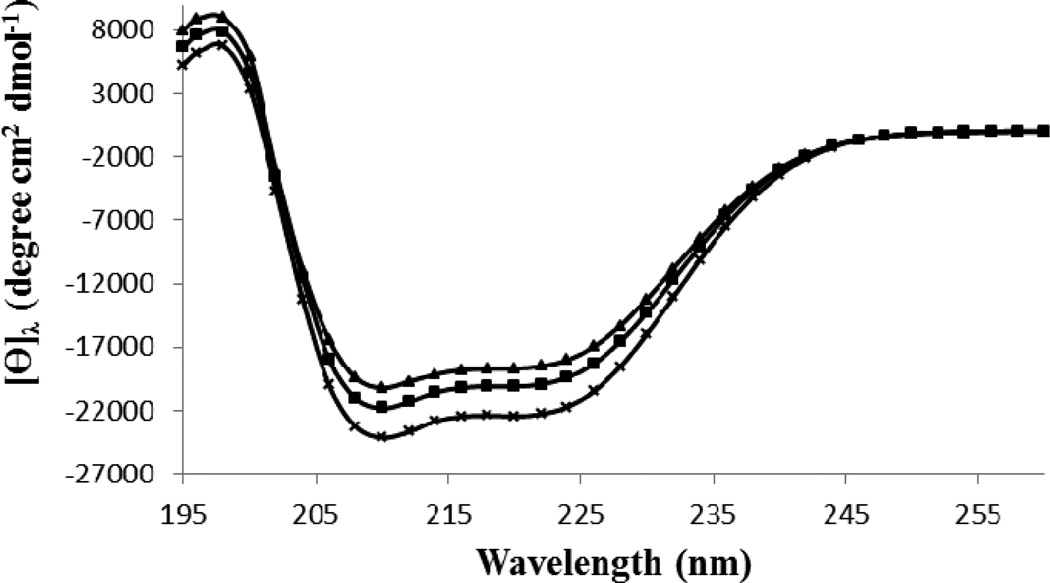
The secondary structure of all protein samples at pH 7.4 and 25°C were determined by far UV circular dichorism (CD) spectroscopy (Figure 4). The content of secondary structures was obtained using the provided software by the manufacturer (Table 1). The HSA-control, had the secondary structure contents including 61.1%±0.6 α-helix content, 3.6%±0.2 antiparallel β-sheet content, 4.2%±0.1 parallel β-sheet content, 13.3%±0.2 β-turn content and 17.8%±0.8 unordered structure. The modified HSA+Glc had a α-helix content of 57.2%±0.4, which was less than the HSA-control. Interestingly, the α-helix content of HSA+Glc+AA was the lowest (54.7%±0.9), which suggest a contributory role for AA in increasing the effect of Glc on the secondary structure of HSA.
Figure 4.
The percentage secondary structure of HSA-control, HSA+Glc and HSA+Glc +AA in 50 mM sodium phosphate buffer (pH 7.4), 1 mM EDTA and 0.1 mM sodium azide, incubated at 37 °C. The CD spectra of HSA-control ( ), HSA+Glc (
 ) and HSA+Glc+AA (
 ) are given above.
Table 1.
The percentage secondary structure of HSA-control, HSA+Glc and HSA+Glc +AA in 50 mM sodium phosphate buffer (pH 7.4), 1 mM EDTA and 0.1 mM sodium azide, incubated at 37 °C.
| Sample | α – Helix | Antiparallel | Parallel | β – Turn | Random-coil |
|---|---|---|---|---|---|
| HSA-control | 61.1%±0.6 | 3.6%±0.2 | 4.2%±0.1 | 13.3%±0.2 | 17.8%±0.8 |
| HSA+Glc | 57.2%±0.4 | 4.3%±0.5 | 4.6%±0.2 | 13.9%±0.1 | 20.0%±0.3 |
| HSA+Glc+AA | 54.7%±0.9 | 4.6%±0.1 | 5.1%±0.1 | 14.2%±0.1 | 21.4%±0.6 |
3.3. Trp- fluorescence measurements
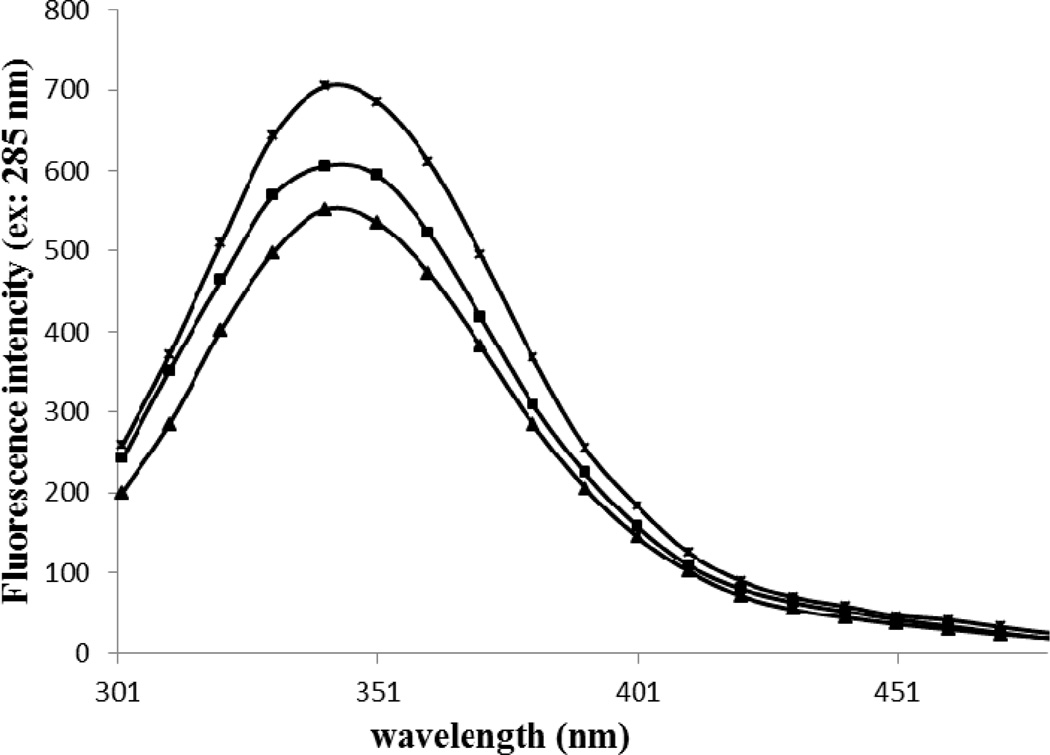
The spectra of Trp fluorescence for the HSA-control, HSA+Glc and HSA+Glc+AA at the excitation wavelength of 285 nm is shown in Figure 5. The emission intensity of HSA+ Glc+AA was significantly decreased compared with the emission intensity of HSA+Glc, which was lower than HSA-control.
Figure 5.
Fluorescence emission spectra of HSA-control, HSA+Glc and HSA+Glc+AA at the excitation wavelength of 285 nm in 50 mM sodium phosphate buffer (pH 7.4), 1 mM EDTA and 0.1 mM sodium azide, incubated at 37 °C. The emission spectra of HSA-control ( ), HSA+Glc (
 ) and HSA+Glc+AA (
 ) are given above.
3.4. AGEs- fluorescence measurements
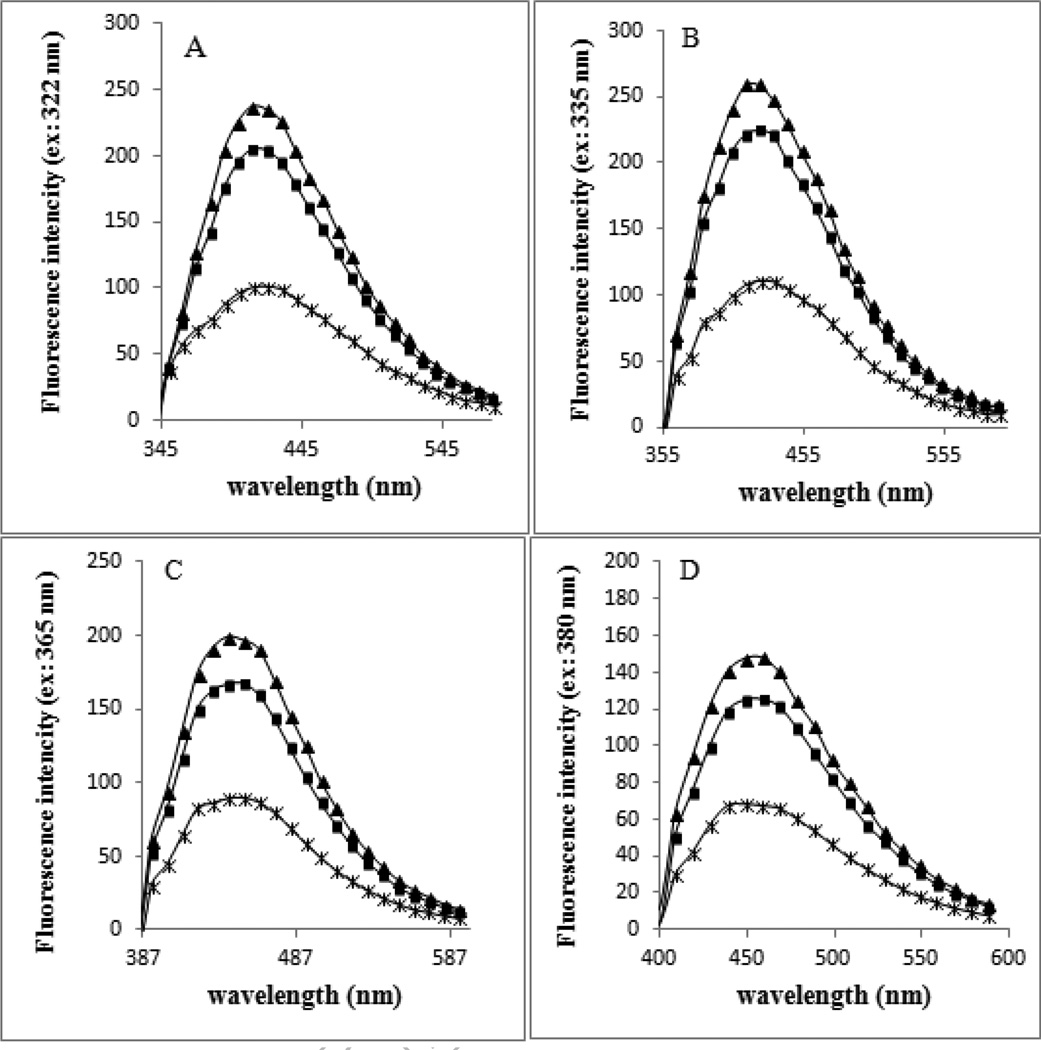
Figure 6 (panels A–D) shows the fluorescence spectra of HSA-control, HSA+Glc and HSA+Glc+AA after 35 days of incubation at 37°C at the excitation wavelengths of 322, 335, 365 and 380 nm, and emissions over a wavelength range of 300–600 nm. The fluorescence intensity of HSA+Glc+AA was higher than HSA+Glc (Figure 6A–D).
Figure 6.
Fluorescence emission spectra of HSA-control, HSA+Glc and HSA+Glc+AA at excitation wavelengths of 322 nm(A), 335 nm (B), 365 nm (C) and 380 nm (D) in 50 mM sodium phosphate buffer (pH 7.4), 1 mM EDTA and 0.1 mM sodium azide, incubated at 37 °C. The emission spectra of HSA-control ( ), HSA+Glc (
 ) and HSA+Glc+AA (
 ) are given above.
4. Discussion
Glycation process starts with strong covalent binding between free amino groups of proteins and carbonyl groups of sugars. This binding initiates the formation of glycation products and extensive protein structural changes (Shaklai, Garlick, & Bunn, 1984 and Brownlee, Cerami, & Vlassara, 1988). According to TNBSA test (free lysine content assay), involved lysine residues in HSA+Glc+AA were approximately 3 times higher than involved lysine residues in HSA+Glc (Figure 1). Thus, AA increases the lysine residue modifications, and enhances the effect of protein glycation. Also, the results of free thiol group determinations (Ellman's assay) show the number of modified cysteine residues in HSA+Glc+AA is higher than HSA+Glc (Figure 2). AA can bind covalently to nucleophilic group (lysine and cysteine residues) of HSA through carbonyl groups. This result is in agreement with previous studies (R. Nagai, M. Nagai, Shimasaki, Baynes, & Fujiwara, 2010).
Based on the chemiluminescence results, the ROS generation was increased in HSA+Glc+AA which is higher than HSA+Glc (Figure 3). These results are in agreement with previous study which the glycation process can cause ROS formation (Baynes & Thorpe, 2000).
The CD results of HSA+Glc indicated a decrease in α-helix content, increased β-sheet structure, turns, and unordered elements. However, a higher change in the secondary structure was detected for HSA+Glc+AA (Fig. 4 and Table 1). According to previous studies, the glycation process can lead to decreased α-helix content of HSA (Bohlooli et al., 2013 and Singh, Barden, Mori, & Beilin, 2001) and BSA (Takeda, Wada, Yamamoto, Moriyama, & Aoki, 1989). Based on the above mentioned results, AA increased the secondary structure changes (i.e. the decrease in α-helix content of HSA). Thus, AA can act as an activator and/or enhancer of the glycation process.
The glycation also causes a decrease in the intrinsic (tryptophan) fluorescence intensity of proteins such as HSA (Singh, Barden, Mori, & Beilin, 2001) and BSA (Takeda, Wada, Yamamoto, Moriyama, & Aoki, 1989). Figure 3 showed a significant decrease in the Trp-fluorescence intensity of HSA+Glc+AA compared with HSA+Glc. Thus, AA can intensify the Glc effect on Trp-fluorescence intensity. The reduction in Trp-fluorescence intensity of modified HSA indicate Trp transition to polar solvent, so the partial denaturation of HSA was done during glycation (Sattarahmady et al., 2007). Also, the glycation process causes the HSA stabilization (Bohlooli et al., 2014a).
The increase in fluorescence intensity of HSA+ Glc+ AA was more than HSA+Glc at the maximum excitation wavelengths of 322, 335, 365 and 380 nm. These excitation wavelengths were detected because of their report in AGEs formation in previous studies (A. Schmitt, J. Schmitt, Munch, & Gasic-Milencovic, 2005 and Singh, Barden, Mori, & Beilin, 2001). Argpyrimidine and pentosidine are two fluorophores, which have been previously studied for the detection of AGEs formation (A. Schmitt, J. Schmitt, Munch, & Gasic-Milencovic, 2005 and Kessel, Kalinin, Nagaraj, Larsen, & Johansson, 2002). Argpyrimidine has high absorbance between 320 and 335 nm, and a fluorescence emission maximum of about 400 nm, while pentosidine absorbs between 325 and 335 nm, and has a maximum emission at 375–385 nm (A. Schmitt, J. Schmitt, Munch, & Gasic-Milencovic, 2005). Here the analysis of the fluorescence emission spectra suggested that the levels of pentosidine and argpyrimidine were increased in the presence of AA. In addition, the level of another fluorophore with the excitation wavelengths of 365 and 380 nm was increased.
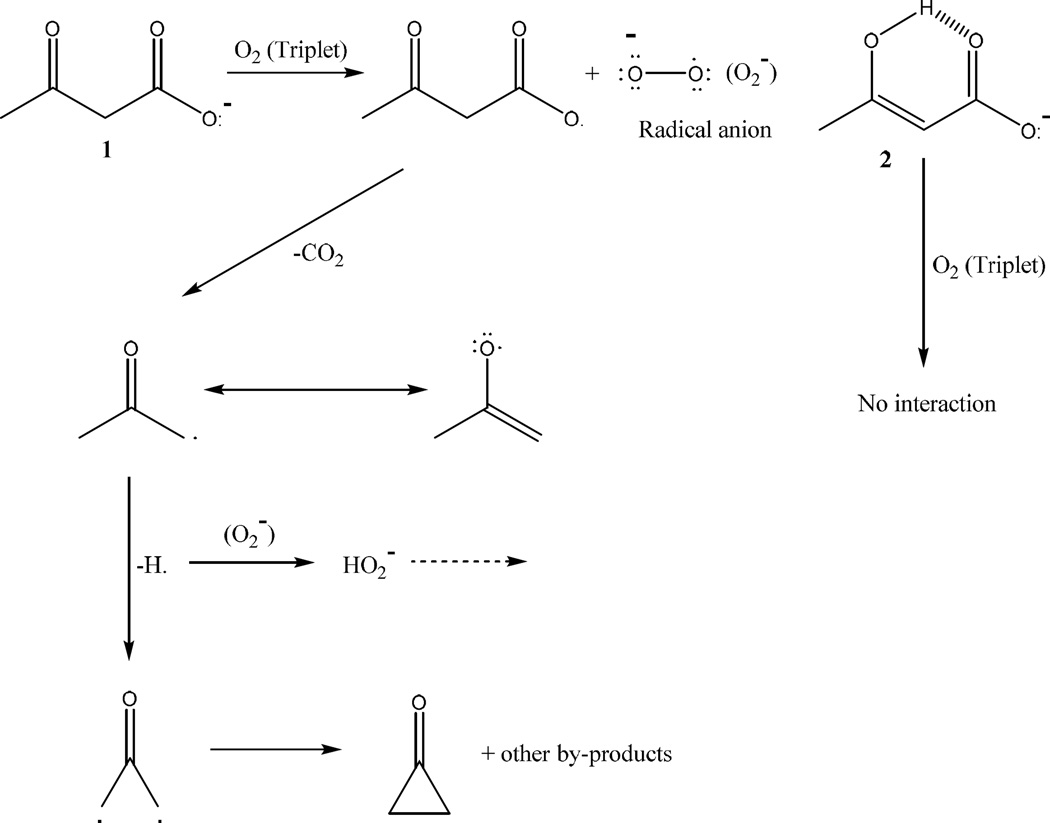
Collectively our results suggested that AA causes an enhancement in alterations of secondary and tertiary structure of HSA, which are induced by the glycation process. In addition, AA increased the formation of AGEs. We recently reported that 3BHB, which is an abundant ketone body, inhibited the formation of AGEs in HSA (Bohlooli et al., 2014b). Here our results demonstrated that AA activates the formation of AGEs. This conflict between the two ketone bodies is mainly attributed to their chemical structure and behavior. AA can produce ROS, while 3BHB cannot produce it (Jain, McVie, & Bocchini, 2006, Jain, McVie, Jaramillo, & Chen, 1998 and Kelly, 1994). This effect may be related to chemical structure of these ketone bodies. A plausible Mechanism for the formation of O2·− and H2O2 in this process was illustrated in Figure 7.
Figure 7.
Proposed mechanism for ROS formation from AA. ROS cannot be produced by 3BHB.
In this figure, fragmentation of acetoacetate anion 1 was observed. Molecular oxygen (triplet) was present in the reaction medium which could capture hydrogen radical, whereby a hydrogen superoxide radical was formed. Capturing of another H radical would produce H2O2. Fragmentation of anion 2 would not happen because of the intramolecular hydrogen bonding which was occurred in it.
5. Conclusion
Acetoacetate a ketone body, whose level is increased during ketosis process in diabetic patients. Our results demonstrated that AA has an activator effect in formation AGEs and structural change of HSA during glycation process. The mechanism of activator effect of AA was attributed to its ability to produce ROS. Thus, a relationship between ROS production and AGEs formation may exist. Glycation also induces ROS production, and ROS are involved in AGE formation. Increased formation of AGEs can lead to enhancement of diseases which arise from accumulation of glycation products such as diabetes complications, Alzheimer’s and Parkinson's disease, and physiological senile.
Acknowledgments
The support of UNESCO Chair on Interdisciplinary Research in Diabetes at University of Tehran is gratefully acknowledged. This is because of annual report for UNESCO.
Abbreviations
- AA
Acetoacetate
- ROS
reactive oxygen species
- AGEs
Advanced glycation end products
- HSA
Human Serum Albumin
- GHSA
glycated human serum albumin
- 3BHB
3-β-hydroxybutyrate
- CD
Circular Dichroism
Reference
- Adrogue HJ, Wilson H, 3rd, Boyd AE, Suki WN, Eknoyan G. Plasma acid–base patterns in diabetic ketoacidosis. The New England Journal of Medicine. 1982;307:1603–1610. doi: 10.1056/NEJM198212233072603. [DOI] [PubMed] [Google Scholar]
- Ahmed N. Advanced glycation endproducts—role in pathology of diabetic complications. Diabetes Research and Clinical Practice. 2005;67:3–21. doi: 10.1016/j.diabres.2004.09.004. [DOI] [PubMed] [Google Scholar]
- Baynes JW, Thorpe SR. Glycoxidation and lipoxidation in atherogenesis. Free Radical Biology & Medicine. 2000;28:1708–1716. doi: 10.1016/s0891-5849(00)00228-8. [DOI] [PubMed] [Google Scholar]
- Bohlooli M, Moosavi-Movahedi AA, Taghavi F, Maghami P, Saboury AA, Moosavi-Movahedi, Habibi-Rezaei M. Investigation of thermal reversibility and stability of glycated human serum albumin. International Journal of Biological Macromolecules. 2013;62:358–364. doi: 10.1016/j.ijbiomac.2013.09.015. [DOI] [PubMed] [Google Scholar]
- Bohlooli M, Moosavi-Movahedi AA, Taghavi F, Saboury AA, Maghami P, Seyedarabi A, Habibi-Rezaei M. Inhibition of fluorescent advanced glycation end products (AGEs) of human serum albumin upon incubation with 3-β-hydroxybutyrate. Molecular Biology Reports. 2014b;41:3705–3713. doi: 10.1007/s11033-014-3235-1. [DOI] [PubMed] [Google Scholar]
- Bohlooli M, Moosavi-Movahedi AA, Ghaffari-Moghaddam M, Ali Akbar Saboury AA, Khajeh M, Najafi S, Shahraki S. Comparative study of thermal domains analyzing of glycated and non-glycated human serum albumin. Thermochimica Acta. 2014a;594:24–30. [Google Scholar]
- Brownlee M, Cerami A, Vlassara H. Advanced glycosylation end-products in tissue and the biochemical basis of diabetic complications. The New England Journal of Medicine. 1988;318:1315–1321. doi: 10.1056/NEJM198805193182007. [DOI] [PubMed] [Google Scholar]
- Brownlee M, Vlassara H, Cerami A. Nonenzymatic glycation and the pathogenesis of diabetic complications. Journal Annals of Internal Medicine. 1984;101:527–537. doi: 10.7326/0003-4819-101-4-527. [DOI] [PubMed] [Google Scholar]
- Candiloros H, Muller S, Zeghari N, Donner M, Drouin P, Ziegler O. Decreased erythrocyte membrane fluidity in poorly controlled IDDM. Influence of ketone bodies. Diabetes Care. 1995;18:549–551. doi: 10.2337/diacare.18.4.549. [DOI] [PubMed] [Google Scholar]
- Cayot P, Tainturier G. The quantification of protein amino groups by the trinitrobenzenesulfonic acid: a reexamination. Analytical Biochemistry. 1997;249:184–200. doi: 10.1006/abio.1997.2161. [DOI] [PubMed] [Google Scholar]
- Ellman GL. Tissue sulfhydryl groups. Archives of Biochemistry and Biophysics. 1959;82:70–77. doi: 10.1016/0003-9861(59)90090-6. [DOI] [PubMed] [Google Scholar]
- Fery F, Balasse EO. Ketone body production and disposal in diabetic ketosis. A comparison with fasting ketosis. Diabetes. 1985;34:326–332. doi: 10.2337/diab.34.4.326. [DOI] [PubMed] [Google Scholar]
- Friedlander MA, Witko-Sarsat V, Nguyen AT, Wu YC, Labrunte M, Verger C, Descamps-Latscha B. The advanced glycation endproduct pentosidine and monocyte activation in uremia. Clinical Nephrology. 1996;45:379–382. [PubMed] [Google Scholar]
- Frye EB, Degenhardt TP, Thorpe SR, Baynes JW. Role of the Maillard reaction in aging of tissue proteins. The Journal of Biological Chemistry. 1998;273:18714–18719. doi: 10.1074/jbc.273.30.18714. [DOI] [PubMed] [Google Scholar]
- Galan A, Hernandez J, Jimenez O. Measurement of blood acetoacetate and β-hydroxybutyrate in an automatic analyser. Journal of Analytical Methods in Chemistry. 2001;23:69–76. doi: 10.1155/S1463924601000086. [DOI] [PMC free article] [PubMed] [Google Scholar]
- Guthrie JP, Jordan F. Amine catalyzed decarboxylation of acetoacetic acid: the rate constant for decarboxylation of a β-imino acid. Journal of the American chemical society. 1972;94:9136–9141. [Google Scholar]
- Iberg N, Fliick R. Nonenzymatic glycosylation of albumin in Vivo. The Journal of Biological Chemistry. 1986;261:13542-1345. [PubMed] [Google Scholar]
- Iranfar H, Rajabi O, Salari R, Chamani J. Probing the interaction of human serum albumin with ciprofloxacin in the presence of silver nanoparticles of three sizes: multispectroscopic and ζ potential investigation. The Journal of Physical Chemistry B. 2012;116:1951–1964. doi: 10.1021/jp210685q. [DOI] [PubMed] [Google Scholar]
- Jain SK, Mcvie R. Hyperketonemia can increase lipid peroxidation and lower glutathione levels in human erythrocytes in vitro and in type-1 diabetic patients. Diabetes. 1999;48:1850–1855. doi: 10.2337/diabetes.48.9.1850. [DOI] [PubMed] [Google Scholar]
- Jain SK, Kannan K, Lim G. Ketosis (acetoacetate) can generate oxygen radicals and cause increased lipid peroxidation and growth inhibition in human endothelial cells. Free Radical Biology & Medicine. 1998;25:1083–1088. doi: 10.1016/s0891-5849(98)00140-3. [DOI] [PubMed] [Google Scholar]
- Jain SK, Kannan K, McVie R. Effect of hyperketonemia on blood monocyttes in type-1 diabetic patients and apoptosis in cultured U937 monocytes. Antioxid. Redox Signal. 1999;1:211–220. doi: 10.1089/ars.1999.1.2-211. [DOI] [PubMed] [Google Scholar]
- Jain SK, McVie R, Bocchini JA., Jr Hyperketonemia (ketosis), oxidative stress and type 1 diabetes. Pathophysiology. 2006;13:163–170. doi: 10.1016/j.pathophys.2006.05.005. [DOI] [PubMed] [Google Scholar]
- Jain SK, McVie R, Jaramillo JJ, Chen Y. Hyperketonemia (acetoacetate) increases the oxidizability of LDL + VLDL in type-I diabetic patients. Free Radical Biology & Medicine. 1998;24:175–181. doi: 10.1016/s0891-5849(97)00213-x. [DOI] [PubMed] [Google Scholar]
- Kakade ML, Liener IE. Determination of available lysine in proteins. Analytical Biochemistry. 1962;27:273–280. doi: 10.1016/0003-2697(69)90032-3. [DOI] [PubMed] [Google Scholar]
- Kelly J. Making sense of free radicals and their effects on the body. Nursing Times. 1994;90:34–36. [Google Scholar]
- Kessel L, Kalinin S, Nagaraj RH, Larsen M, Johansson JB. Time-resolved and steady-state fluorescence spectroscopic studies of the human lens with comparison to argpyrimidine, pentosidine and 3-OH-kynurenine. Photochemistry and Photobiology. 2002;76:549–554. doi: 10.1562/0031-8655(2002)076<0549:trassf>2.0.co;2. [DOI] [PubMed] [Google Scholar]
- Khorsand Ahmadi S, Mahmoodian Moghadam M, Mokaberi P, Reza Saberi M, Chamani J. A comparison study of the interaction between β-lactoglobulin and retinol at two different conditions: spectroscopic and molecular modeling approaches. Journal of Biomolecular Structure and Dynamics. 2015;33:1880–1898. doi: 10.1080/07391102.2014.977351. [DOI] [PubMed] [Google Scholar]
- Kuznetsova IM, Sulatskaya AI, Povarova OI, Turoverov KK. Reevaluation of ANS binding to human and bovine serum albumins: key role of equilibrium microdialysis in ligand - receptor binding characterization. PLoS One. 2012;7:e40845. doi: 10.1371/journal.pone.0040845. [DOI] [PMC free article] [PubMed] [Google Scholar]
- Laffel L. Ketone bodies: A Review of Physiology. Pathophysiology and Application of Monitoring to Diabetes. 1999;15:412–426. doi: 10.1002/(sici)1520-7560(199911/12)15:6<412::aid-dmrr72>3.0.co;2-8. [DOI] [PubMed] [Google Scholar]
- Lapolla A, Traldi P, Fedele D. Importance of measuring products of non-enzymatic glycation of proteins. Clinical Biochemistry. 2005;38:103–115. doi: 10.1016/j.clinbiochem.2004.09.007. [DOI] [PubMed] [Google Scholar]
- Meerwaldt R, Links T, Graaff R, Thorpe SR, Baynes JW, Hartog J, Smit A. Simple noninvasive measurement of skin autofluorescence. You have full text access to this content. Annals of the New York Academy of Sciences. 2005;1043:290–298. doi: 10.1196/annals.1333.036. [DOI] [PubMed] [Google Scholar]
- Munch G, Shepherd CE, Mccann H, Brooks WS, Kwok JB, Arendt T, Hallidays GM. Intraneuronal advanced glycation end products in presenilin-l Alzheimer`s disease. Neuroreport. 2002;13:601–604. doi: 10.1097/00001756-200204160-00013. [DOI] [PubMed] [Google Scholar]
- Nagai R, Nagai M, Shimasaki S, Baynes JW, Fujiwara Y. Citric acid inhibits development of cataracts, proteinuria and ketosis in streptozotocin (type 1) diabetic rats. Biochemical and Biophysical Research Communications. 2010;393:118–122. doi: 10.1016/j.bbrc.2010.01.095. [DOI] [PMC free article] [PubMed] [Google Scholar]
- Persson B. Determination of plasma acetoacetate and D-β-hydroxybutyrate in newborn infants by an enzymatic fluorometric micro-method. Scandinavian Journal of Clinical & Laboratory Investigation. 1970;25:9–18. doi: 10.3109/00365517009046184. [DOI] [PubMed] [Google Scholar]
- Rahbar S, Figarola JL. Novel inhibitors of advanced glycation endproducts, Arch. Archives of Biochemistry and Biophysics. 2003;419:63–79. doi: 10.1016/j.abb.2003.08.009. [DOI] [PubMed] [Google Scholar]
- Sarzehi S, Chamani J. Investigation on the interaction between tamoxifen and human holo-transferrin: determination of the binding mechanism by fluorescence quenching, resonance light scattering and circular dichroism methods. International Journal of Biological Macromolecules. 2012;47:558–569. doi: 10.1016/j.ijbiomac.2010.08.002. [DOI] [PubMed] [Google Scholar]
- Sattar Z, Iranfar H, Asoodeh A, Saberi MR, Mazhari M, Chamani J. Interaction between holo transferrin and HSA-PPIX complex in the presence of lomefloxacin: an evaluation of PPIX aggregation in protein-protein interactions. Spectrochimica Acta Part A: Molecular and Biomolecular Spectroscopy. 2012;97:1089–1100. doi: 10.1016/j.saa.2012.07.034. [DOI] [PubMed] [Google Scholar]
- Sattarahmady N, Moosavi-Movahedi AA, Ahmad F, Hakimelahi GH, Habibi-Rezaei M, Saboury AA, Sheibani N. Formation of the molten globule-like state during prolonged glycation of human serum albumin. Biochimica et Biophysica Acta. 2007;1770:933–942. doi: 10.1016/j.bbagen.2007.02.001. [DOI] [PubMed] [Google Scholar]
- Schmitt A, Schmitt J, Munch G, Gasic-Milencovic J. Characterization of advanced glycation end products for biochemical studies: side chain modifications and fluorescence characteristics. Analytical Biochemistry. 2005;388:201–215. doi: 10.1016/j.ab.2004.12.003. [DOI] [PubMed] [Google Scholar]
- Shaklai N, Garlick RL, Bunn HF. Non enzymic glycosylation of human serum albumin alters its conformation and function. The Journal of Biological Chemistry. 1984;259:3812–3817. [PubMed] [Google Scholar]
- Shourian M, Tavakoli H, Ghourchian H, Rafiee-Pour HA. Detection and dosimetry of gamma ray emitted from thallium-201 and technetium-99m based on chemiluminescence technique. Radiation Measurements. 2010;45:906–910. [Google Scholar]
- Singh R, Barden A, Mori T, Beilin L. Advanced glycation products: a review. Diabetologia. 2001;44:129–146. doi: 10.1007/s001250051591. [DOI] [PubMed] [Google Scholar]
- Stephens JM, Sulway MJ, Watkins PJ. Relationship of blood acetoacetate and 3-hydroxybutyrate in diabetes. Diabetes. 1971;20:485–489. doi: 10.2337/diab.20.7.485. [DOI] [PubMed] [Google Scholar]
- Stitt AW. Advanced glycation: an important pathological event in diabetic and age related ocular disease. The British Journal of Ophthalmology. 2001;85:746–753. doi: 10.1136/bjo.85.6.746. [DOI] [PMC free article] [PubMed] [Google Scholar]
- Sugio S, Kashima A, Mochizuki S, Noda M, Kobayashi K. Crystal structures of human serum albumin at 2.5 A° resolution. Protein Engineering Design and Selection. 1999;12:439–446. doi: 10.1093/protein/12.6.439. [DOI] [PubMed] [Google Scholar]
- Sulway MJ, Trotter E, Trotter MD, Malins JM. Acetone in uncotrolled diabetes. Journal of Postgraduate Medical. 1971;47:382–387. [PubMed] [Google Scholar]
- Takeda K, Wada A, Yamamoto K, Moriyama Y, Aoki K. Conformational change of bovine serum albumin by heat treatment. Journal of Protein Chemistry. 1989;8:653–659. doi: 10.1007/BF01025605. [DOI] [PubMed] [Google Scholar]
- Voziyan PA, Khalifah RG, Thibaudeau C, Yildiz A, Jacob J, Serianni AS, Hudson BG. Modification of proteins in vitro by physiological levels of glucose: pyridoxamine inhibits conversion of Amadori intermediate to advanced glycation end-products through binding of redox metal ions. The Journal of Biological Chemistry. 2003;278:46616–46624. doi: 10.1074/jbc.M307155200. [DOI] [PubMed] [Google Scholar]
- Wolff SP, Jiang ZY, Hunt JV. Protein glycation and oxidative stress in diabetes mellitus and ageing. Free Radical Biology & Medicine. 1991;10:339–352. doi: 10.1016/0891-5849(91)90040-a. [DOI] [PubMed] [Google Scholar]


