Significance
Intellectual disability is a common clinical entity with few therapeutic options. Kabuki syndrome is a genetically determined cause of intellectual disability resulting from mutations in either of two components of the histone machinery, both of which play a role in chromatin opening. Previously, in a mouse model, we showed that agents that favor chromatin opening, such as the histone deacetylase inhibitors (HDACis), can rescue aspects of the phenotype. Here we demonstrate rescue of hippocampal memory defects and deficiency of adult neurogenesis in a mouse model of Kabuki syndrome by imposing a ketogenic diet, a strategy that raises the level of the ketone beta-hydroxybutyrate, an endogenous HDACi. This work suggests that dietary manipulation may be a feasible treatment for Kabuki syndrome.
Keywords: epigenetics, histone machinery, adult neurogenesis, intellectual disability, ketone bodies
Abstract
Kabuki syndrome is a Mendelian intellectual disability syndrome caused by mutations in either of two genes (KMT2D and KDM6A) involved in chromatin accessibility. We previously showed that an agent that promotes chromatin opening, the histone deacetylase inhibitor (HDACi) AR-42, ameliorates the deficiency of adult neurogenesis in the granule cell layer of the dentate gyrus and rescues hippocampal memory defects in a mouse model of Kabuki syndrome (Kmt2d+/βGeo). Unlike a drug, a dietary intervention could be quickly transitioned to the clinic. Therefore, we have explored whether treatment with a ketogenic diet could lead to a similar rescue through increased amounts of beta-hydroxybutyrate, an endogenous HDACi. Here, we report that a ketogenic diet in Kmt2d+/βGeo mice modulates H3ac and H3K4me3 in the granule cell layer, with concomitant rescue of both the neurogenesis defect and hippocampal memory abnormalities seen in Kmt2d+/βGeo mice; similar effects on neurogenesis were observed on exogenous administration of beta-hydroxybutyrate. These data suggest that dietary modulation of epigenetic modifications through elevation of beta-hydroxybutyrate may provide a feasible strategy to treat the intellectual disability seen in Kabuki syndrome and related disorders.
Kabuki syndrome [KS; Mendelian Inheritance in Man (MIM) 147920, 300867] is a monogenic disorder, the manifestations of which include intellectual disability, postnatal growth retardation, immunological dysfunction, and characteristic facial features. Mutations in either lysine (K)-specific methyltransferase 2D (KMT2D) or lysine (K)-specific demethylase 6A (KDM6A) are known to lead to KS (1–3). Interestingly, each of these genes plays an independent role in chromatin opening, a process essential for transcription, as KMT2D encodes a lysine methyltransferase that adds a mark associated with open chromatin (histone 3, lysine 4 trimethylation; H3K4me3), whereas KDM6A encodes a histone demethylase that removes a mark associated with closed chromatin (histone 3, lysine 27 trimethylation; H3K27me3). If a deficiency of chromatin opening plays a role in KS pathogenesis, agents that promote open chromatin states, such as histone deacetylase inhibitors (HDACis), could ameliorate ongoing disease progression (4).
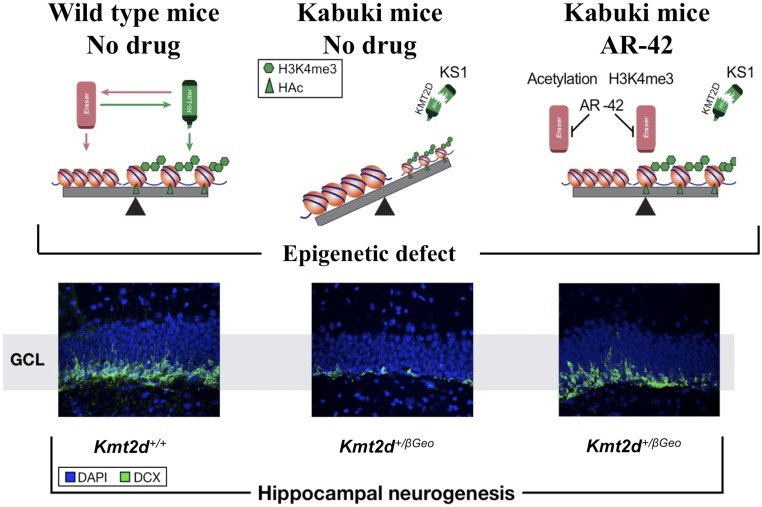
Previously, in a mouse model of KS (Kmt2d+/βGeo), we observed a deficiency of adult neurogenesis, a dynamic process during adult life (5), in association with hippocampal memory deficits (6). After 2 wk of treatment with the HDACi AR-42, an antineoplastic agent, we observed normalization of these phenotypes (6) (Fig. S1). However, transitioning an antineoplastic drug to patients with a nonlethal intellectual disability disorder may prove problematic. Recently, beta-hydroxybutyrate (BHB), a ketone body that is the natural end product of hepatic fatty acid beta oxidation, has been shown to have HDACi activity (7). Because BHB is actively transported into the central nervous system during ketosis (8), and furthermore has been shown to directly enter the hippocampus (9), it should be readily available to modulate histone modifications in relevant cells (neurons); this would be expected to ameliorate the deficiency of adult neurogenesis in Kmt2d+/βGeo mice (6). A dietary intervention could be quickly transitioned to the clinic and is unlikely to have major adverse effects.
Fig. S1.
Schematic summary of prior findings. Kmt2d+/βGeo mice on a mixed C57BL/6J and 129SvEv background demonstrated a global deficiency of the open chromatin mark H3K4me3 in association with decreased neurogenesis in the GCL of the DG (Middle) compared with littermate Kmt2d+/+ mice (Left). These defects were rescued with AR-42 (Right) (6), a class 1 and 2 histone deacetylase inhibitor (24), which has recently been shown to inhibit HDAC5 in liver cells (49).
Here, we demonstrate that treatment with a ketogenic diet (KD) for 2 wk normalizes the global histone modification state and corrects the deficiency of neurogenesis seen in the granule cell layer (GCL) of the dentate gyrus (DG). This dietary change also rescues the hippocampal memory defects in Kmt2d+/βGeo mice. Furthermore, administration of exogenous BHB also rescues the neurogenesis defect in Kmt2d+/βGeo mice, suggesting that the increased levels of BHB play a major role in the observed therapeutic effect of the KD. Our data show that some of the neurological effects of a debilitating germline mutation can be offset by dietary modification of the epigenome and suggest a mechanistic basis of the KD, a widely used therapeutic strategy in clinical medicine.
Results
Phenotype of the Kmt2d+/βGeo Mice.
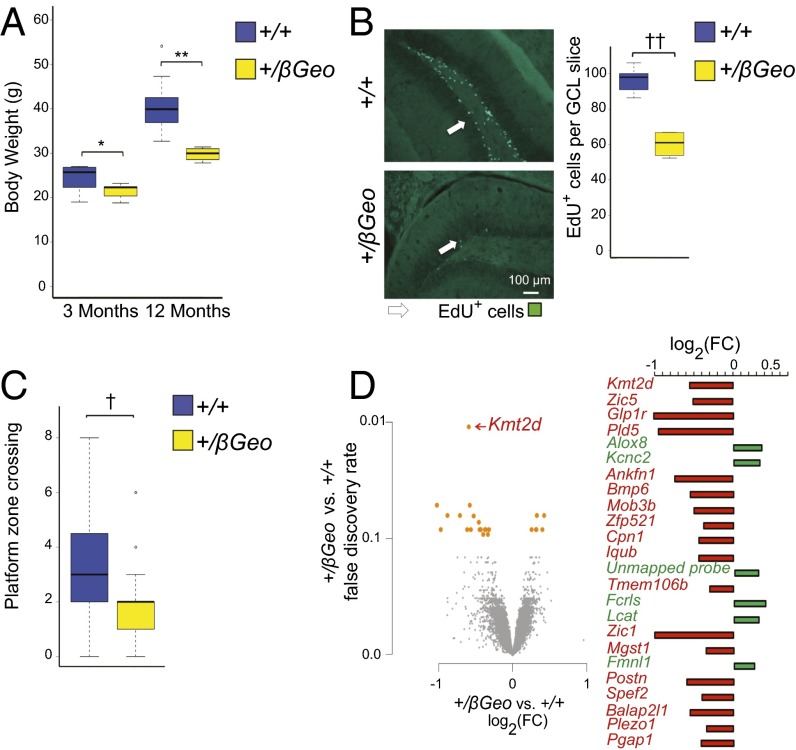
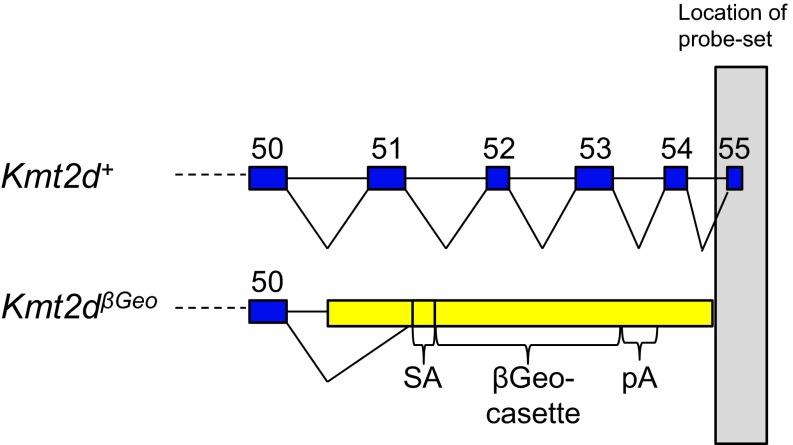
Our mouse model of KS (Kmt2d+/βGeo) demonstrates many features seen in patients with this disorder, including similar craniofacial abnormalities (6) and postnatal growth retardation (Fig. 1A). In addition, Kmt2d+/βGeo mice demonstrate a deficiency of adult neurogenesis (Fig. 1B), as well as hippocampal memory defects (Fig. 1C). All these features are observed in both mixed (6) and congenic C57BL/6J (Fig. 1 A–C) backgrounds (>10 generations). Hippocampal gene expression profiling in Kmt2d+/βGeo and Kmt2d+/+ littermates using microarrays reveals that differentially expressed genes tend to be down-regulated in Kmt2d+/βGeo compared with in Kmt2d+/+ littermates, as would be expected, as the Kmt2d enzyme promotes transcriptional expression. Specifically, we find that 18 of 24 significantly differentially expressed probe-sets [false discovery rate (FDR) < 10%; n = 6–7 mice per group] are down-regulated in Kmt2d+/βGeo mice (Fig. 1D). This shift toward down-regulation in Kmt2d+/βGeo mice is also present in the top 1,000 genes ranked by fold change (FC) (64% are down-regulated; P < 2.2e−16; Fig. S2). However, gene-specific changes in Kmt2d+/βGeo mice are relatively subtle: Only 52 genes have an absolute log2 FC larger than 0.5. Note that Kmt2d itself shows the most highly significantly differentially expressed probe-set (Fig. 1D). As expected, the site of hybridization for the particular Kmt2d probe-set that shows differential expression between genotypes covers the mRNA that is missing in the Kmt2d+/βGeo mice (Fig. S3).
Fig. 1.
Phenotypes observed in fully backcrossed (C57BL/6J) Kmt2d+/βGeo mice. (A) Kmt2d+/βGeo mice weigh significantly less than age-matched Kmt2d+/+ mice at 3 mo, and this weight difference becomes more pronounced at 12 mo (n = 4–10 per group, both sexes). (B) Kmt2d+/βGeo mice demonstrate significantly fewer (P < 0.005) EdU+ cells in the GCL of the DG compared with Kmt2d+/+ littermates, following an EdU proliferation staining assay (n = 4–7 per group). (C) Kmt2d+/βGeo mice (yellow) demonstrate a significant decrease (P < 0.005) in platform zone crosses during a MWM probe trial compared with Kmt2d+/+ (blue) littermates (n = 23–27 per group). (D) Gene expression microarray from hippocampus reveals 18 significantly down-regulated probe-sets between Kmt2d+/βGeo and Kmt2d+/+ littermates, as well as six that were significantly up-regulated (n = 6–7 per group; FDR < 10%). *P < 0.05; **P < 0.01; †P < 0.005; ††P < 0.001.
Fig. S2.
Kmt2d+/βGeo mice demonstrate a generalized tendency toward down-regulation of gene expression. Even when data were explored below the level of statistical significance for the top 1,000 most highly expressed genes and put into bins, there was a generalized tendency toward down-regulation of gene expression at all fold change (FC) bins (n = 6 per group).
Fig. S3.
The Kmt2d probe-set that shows differential expression from microarray analysis is downstream of the SET domain. Schematic of the probe-set that overlaps the last exon of Kmt2d.
In Vitro and in Vivo Elevation of BHB.
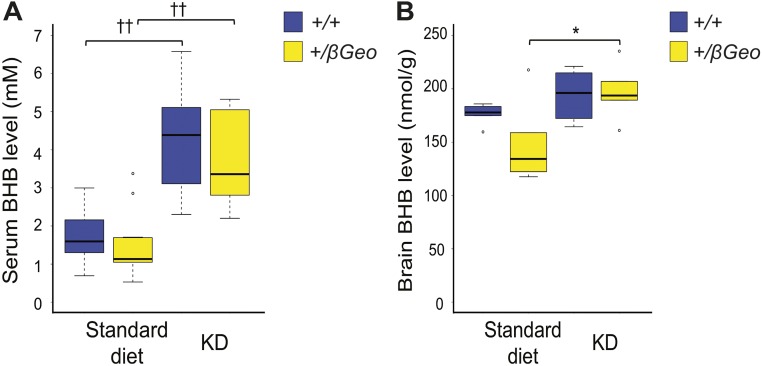
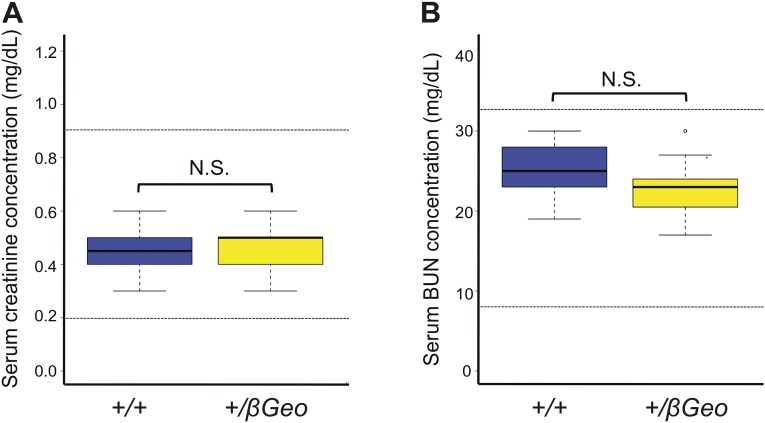
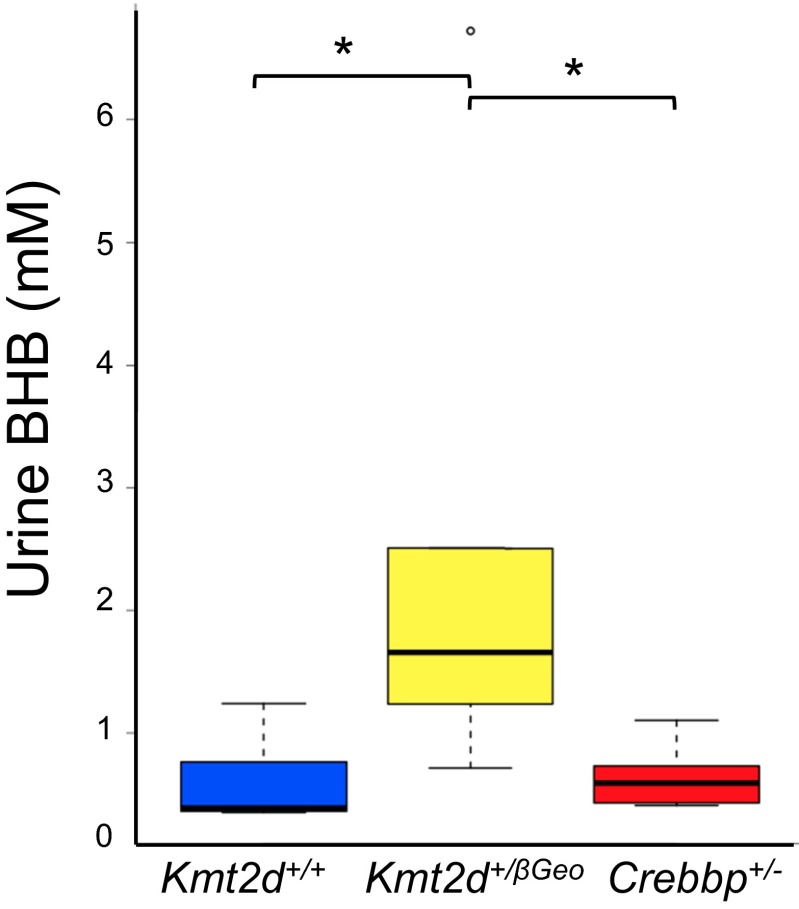
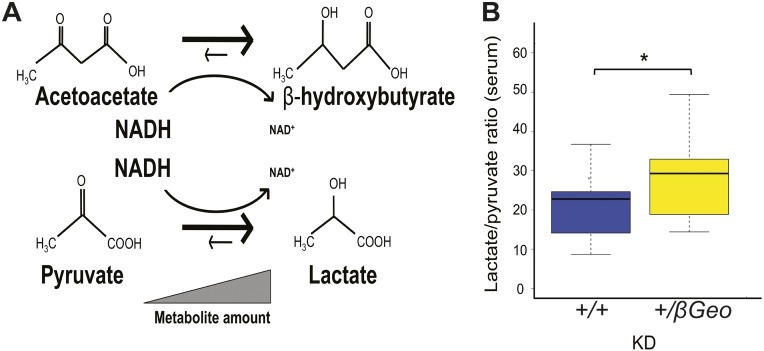
According to the reported histone deacetylase inhibitory activity of BHB (7), we hypothesized that BHB could be used as a therapy for KS (Fig. S4), given the interdependence of histone acetylation and H3K4me3 (10). First, we confirmed that BHB had HDACi activity. Using an in vitro epigenetic reporter allele assay to quantify the activity of the H3K4me3 and H4ac machinery in HEK293 cells (6), we observed a dose-dependent increase of reporter activity with increasing amounts of BHB (Fig. 2A). To increase BHB levels in vivo, we placed Kmt2d+/βGeo and Kmt2d+/+ mice on a KD, using a regimen frequently used in human treatment (4:1 fat to protein ratio) (11). We observed a significant increase in urine BHB from KD-treated mice compared with their regular diet-treated counterparts (Fig. 2B); this effect was greatly accentuated in Kmt2d+/βGeo animals compared to Kmt2d+/+ littermates (Fig. 2C). Elevation of BHB was also observed in serum and brain tissue of Kmt2d+/βGeo mice in response to the KD (Fig. S5). Although structural renal abnormalities are common in patients with KS, renal function is usually normal (12), and Kmt2d+/βGeo mice also have normal renal function (Fig. S6). In contrast, levels of acetoacetate (AcAc) did not show a corresponding elevation, leading to an increased BHB/AcAc ratio in the KD-treated Kmt2d+/βGeo mice, indicating a disproportionate increase in BHB compared with KD-treated Kmt2d+/+ littermates (Fig. 2D). This increase in the BHB/AcAc ratio was not observed in a mouse model of Rubinstein-Taybi syndrome (CREB-binding protein, Crebbp+/−; 13; MIM 180849, 613684; Fig. 2D and Fig. S7), another genetically imposed deficiency of open chromatin marks (14), suggesting that the metabolic alterations in our Kmt2d+/βGeo mice are unlikely to be secondary to a general loss of open chromatin modifications (15, 16). The ratio of BHB to AcAc is governed by the cellular NADH/NAD+ ratio (Fig. 2E). Serum lactate/pyruvate ratio is also sensitive to the NADH/NAD+ ratio (Fig. S8A), and is concordantly skewed in Kmt2d+/βGeo mice on a KD (Fig. 2E and Fig. S8B). Taken together, our data suggest that an underlying alteration in the NADH/NAD+ ratio may potentiate a therapeutic strategy for KS based on enhanced BHB production in response to a KD.
Fig. S4.
The rationale describing how a KD could be used to counter the epigenetic defect in Kmt2d+/βGeo mice. There are multiple ways to increase blood levels of BHB (direct injection, KD, and exercise). Because BHB is an endogenous HDACi, it may rescue the epigenetic abnormality seen in Kmt2d+/βGeo mice, and thereby provide similar therapeutic benefits as AR-42 in Kmt2d+/βGeo mice (Fig. S1).
Fig. 2.
BHB is an endogenous histone deacetylase inhibitor that is elevated in Kmt2d+/βGeo mice on a KD. (A) Stably transfected HEK293 cells with either an H4ac or an H3K4me3 reporter allele both show a dose-dependent increase in fluorescence with increasing amounts of BHB in culture media (n = 5–7 replicates per condition). (B) Mice treated with the KD for 2 wk show a significant (P < 0.001) increase of urine BHB compared with standard diet–treated controls (n = 12–17 per group). (C) When separated by genotype, urine from KD-treated mice revealed significantly increased urine BHB levels (P < 0.05) in Kmt2d+/βGeo mice compared with Kmt2d+/+ controls, suggesting Kmt2d+/βGeo mice are predisposed to preferentially increased BHB levels during ketosis (n = 4–12 per group). (D) GC-MS analysis confirmed this observation and revealed that this increase in BHB is in fact a result of an altered BHB/AcAc ratio, which is significantly elevated in KD-treated Kmt2d+/βGeo mice, but not Crebbp+/− mice, compared with controls (P = 0.38; n = 3 per group). (E) This schematic demonstrates how the BHB/AcAc ratio is controlled by the cellular NADH/NAD+ ratio (47, 48), suggesting that Kmt2d+/βGeo and not Crebbp+/− mice maintain relatively higher NADH levels during ketosis (Figs. S7 and S8). *P < 0.05; **P < 0.01; †P < 0.005; ††P < 0.001.
Fig. S5.
BHB is elevated in the serum and brain of Kmt2d+/βGeo mice on a KD. (A) Serum BHB levels in Kmt2d+/βGeo mice (n > 10) and littermate controls (n > 10) after 2 wk of the KD. (B) Brain BHB levels in Kmt2d+/βGeo mice (n ≥ 5) and littermate controls (n ≥ 5) after 2 wk of the KD. *P < 0.05; ††P < 0.001.
Fig. S6.
Two markers of renal function are normal in Kmt2d+/βGeo mice. (A) Creatinine levels in young mice (6 wk old) do not show a significant difference (Welch’s t test) between Kmt2d+/βGeo mice (n = 11) and littermate Kmt2d+/+ mice (n = 14), and all values are within the range of normal levels for mice of this age (dotted lines). (B) Blood urea nitrogen (BUN) levels show no significant difference (Welch’s t test) between Kmt2d+/βGeo mice (n = 11) and littermate Kmt2d+/+ mice (n = 14), and all values are within the range of normal levels for mice (dotted lines). N.S., not significant, P > 0.05.
Fig. S7.
Crebbp+/− mice do not share metabolic alterations found in Kmt2d+/βGeo mice. Rubinstein-Taybi syndrome is another Mendelian disorder of the epigenetic machinery, caused by deficiency of a histone acetyltransferase (CREBBP), which secondarily leads to a global deficiency of histone acetylation (14). The histone tails have previously been suggested to act as a potential acetyl-CoA sink (15). Furthermore, other studies have linked NAD+ and histone acetylation (16). A global deficiency of histone acetylation could therefore potentially lead to chronic acetyl-CoA elevation, thereby driving beta-oxidation and secondarily increasing NADH/NAD+ ratio in both KS and Rubinstein-Taybi syndrome. BHB levels from urine show a significant (P < 0.05) elevation in Kmt2d+/βGeo mice compared with Kmt2d+/+ and Crebbp+/− mice (13) (n = 6–8 per group). However, no significant differences were seen between Kmt2d+/+ and Crebbp+/− mice (P = 0.36). *P < 0.05.
Fig. S8.
Lactate/pyruvate ratio is abnormal in Kmt2d+/βGeo mice. (A) Both BHB/AcAc and lactate/pyruvate ratios are controlled by the NADH/NAD+ ratio. (B) In addition to the increased BHB/AcAc ratio, serum analysis from KD-treated animals shows Kmt2d+/βGeo mice had a significant increase in the lactate/pyruvate (Lac/Pyr) ratio compared with KD-treated Kmt2d+/+ littermates (n = 12–15 per group). *P < 0.05.
In Vivo Rescue of Global Histone and Gene Expression Abnormalities.
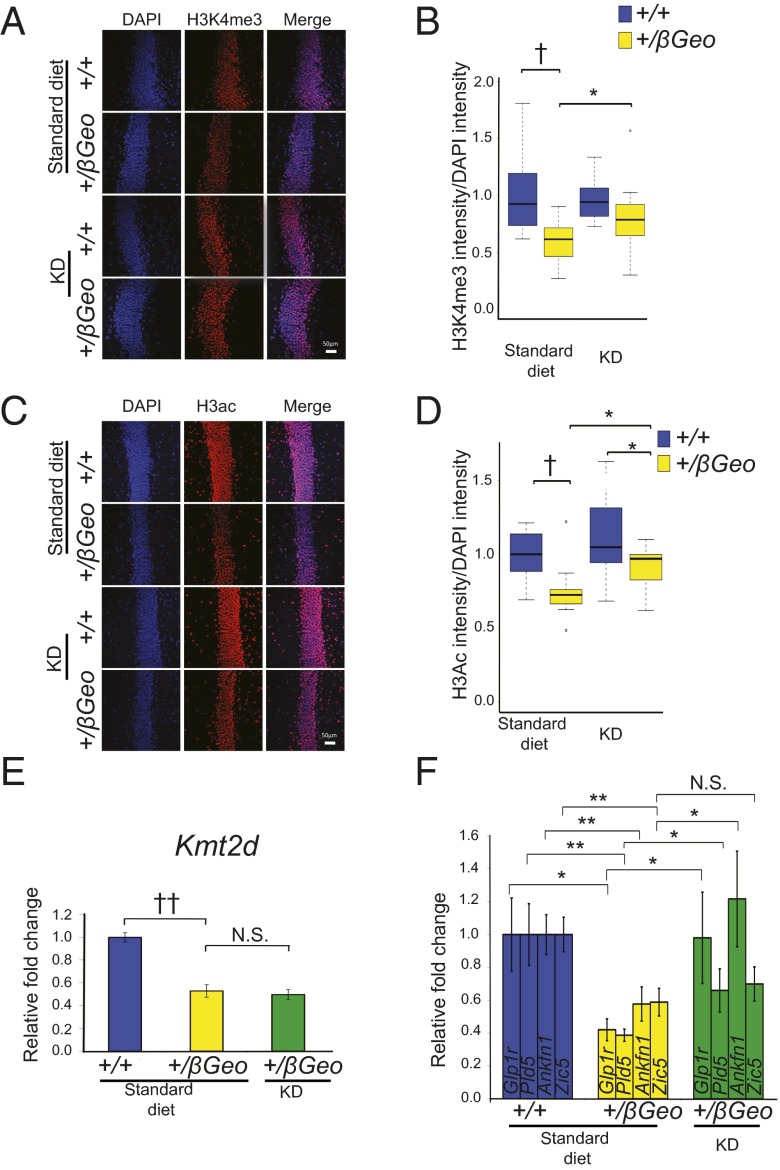
We next explored the effects of in vivo treatment on global chromatin states in the GCL of the DG after 2 wk of a KD. Kmt2d+/βGeo mice on the KD for 2 wk had increased levels of H3K4me3 compared to Kmt2d+/βGeo mice on a standard diet (Fig. 3 A and B). In addition, Kmt2d+/βGeo mice on the KD for 2 wk also showed global normalization of H3ac levels in the GCL of the DG (Fig. 3 C and D). Because of the ability of KD treatment to increase marks of open chromatin in vivo, we next assessed the effects of treatment on the 5 genes that showed the most significant down-regulation in the hippocampus of Kmt2d+/βGeo mice. As expected, the mRNA encoding Kmt2d did not increase in Kmt2d+/βGeo mice on a KD, as the low expression was based on structural allele disruption (Fig. 3E). In contrast, 3 of the 4 other genes we assayed showed a significant increase in transcript expression in response to a KD, with 2 showing full normalization (Fig. 3F). One of these, Glucagon-like peptide-1 receptor (Glp1r), encodes a protein localized to neuronal synapses. As in the Kmt2d+/βGeo mice (6), Glp1r-targeted animals show reversible hippocampal memory defects (17).
Fig. 3.
KD treatment promotes open chromatin in the hippocampus and rescues gene expression abnormalities in Kmt2d+/βGeo mice. (A and B) Kmt2d+/βGeo mice demonstrate a significantly (P < 0.005) decreased H3K4me3/DAPI fluorescence ratio in the GCL of the DG compared with Kmt2d+/+ littermates on a standard diet. Upon 2 wk on the KD, there is a significant (P < 0.05) increase in the H3K4me3/DAPI fluorescence in Kmt2d+/βGeo mice and no significant difference (P = 0.09) between the two genotypes (n = 10–12 per group). (C and D) Kmt2d+/βGeo mice show a significant decrease (P < 0.005) in the H3ac/DAPI fluorescence ratio compared with Kmt2d+/+ littermates; this ratio significantly increased (P < 0.05) in Kmt2d+/βGeo mice after 2 wk on the KD (n = 11–14 per group). (E) Kmt2d expression does not demonstrate any change on a KD treatment (n = 9–11 per group). (F) Validation of candidate genes by RT-qPCR confirming both the down-regulation as well as rescue on KD treatment (n = 9–11 per group). (Scale bar: 50 μm.) N.S., not significant, P > 0.05; *P < 0.05; **P < 0.01; †P < 0.005; ††P < 0.001.
The KD Rescues Neurogenesis Defects in Kmt2d+/βGeo Mice.
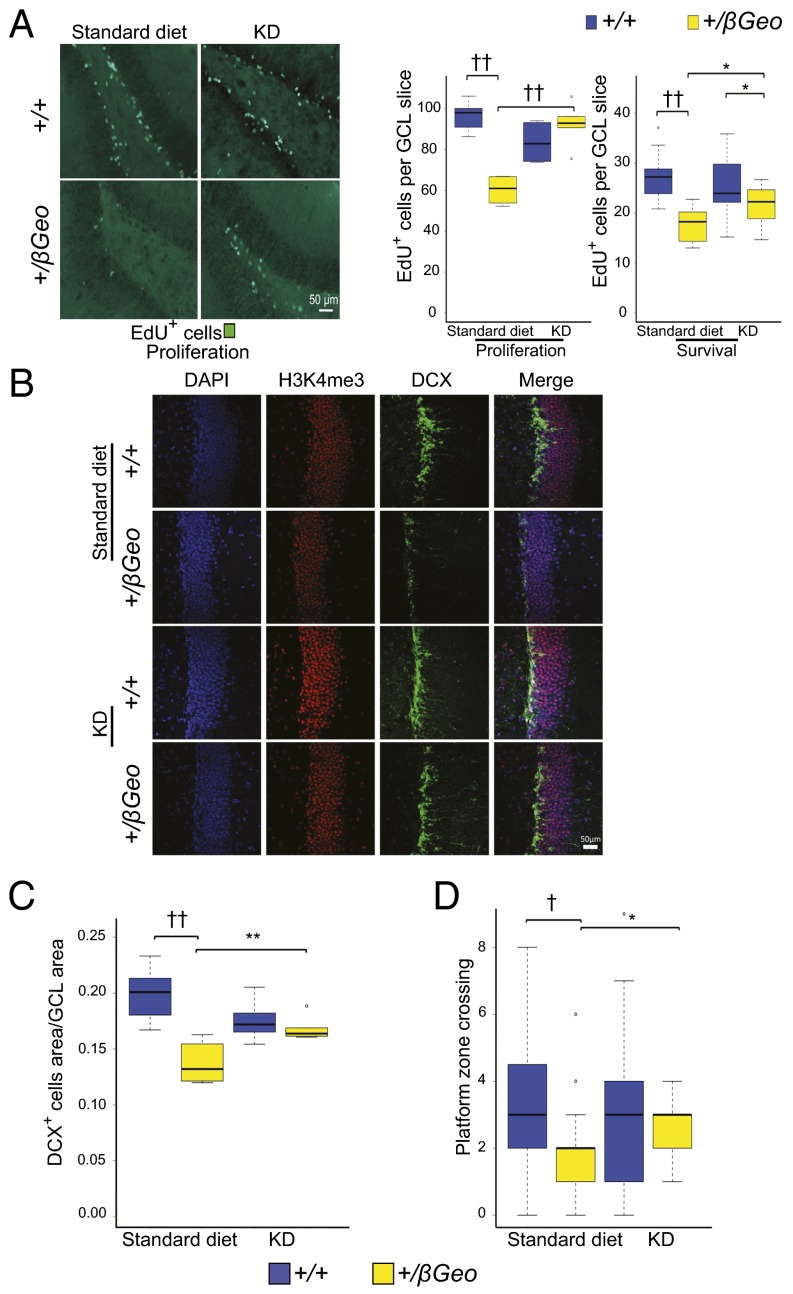
We next assessed the effect of the KD on neurogenesis by two independent markers: quantification of either 5-ethynyl-2′-deoxyuridine–positive (EdU+) or doublecortin-positive (DCX+) cells in the GCL of the DG. Counting EdU+ cells directly after injection is informative regarding any proliferative defects of this cellular niche (18). In contrast, this metric reflects abnormalities in neuronal survival when estimated after a 30-d delay (18). We counted the number of EdU+ cells in the GCL both immediately after a course of EdU injections or 30 d later; both measures showed a significant increase in Kmt2d+/βGeo mice on the KD compared with Kmt2d+/βGeo mice on a regular diet (Fig. 4A). Upon quantification of the DCX+ fraction of the GCL (a marker of adult neurogenesis we had previously shown was decreased in Kmt2d+/βGeo mice) (6), we found a significant increase in Kmt2d+/βGeo mice on the KD compared with mice on a standard diet, with no significant difference compared with KD-treated wild-type (Kmt2d+/+) littermates (Fig. 4 B and C).
Fig. 4.
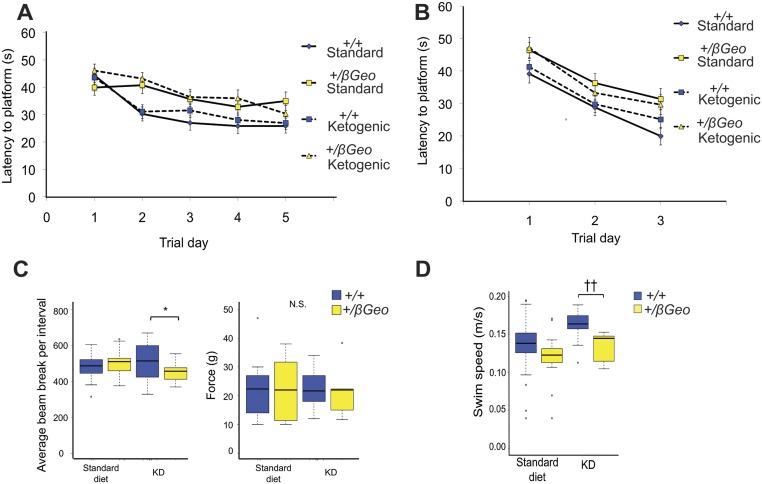
KD treatment rescues the neurogenesis and hippocampal memory defects in Kmt2d+/βGeo mice. (A) Kmt2d+/βGeo mice demonstrate significantly fewer EdU+ cells in the GCL of the DG, both immediately after 7 d of EdU injection (proliferation, P < 0.001) or 30 d after start of EdU injection (survival, P < 0.001). Both measures increase significantly (P < 0.001; P < 0.05) in Kmt2d+/βGeo mice on the KD for 2 wk (n = 5–9, proliferation; n = 8–15, survival). (B and C) Kmt2d+/βGeo mice on a standard diet demonstrate a significantly smaller DCX+ cell population in the GCL of the DG (P < 0.001) compared with Kmt2d+/+ littermates. This ratio significantly increases (P < 0.01) in Kmt2d+/βGeo mice after 2 wk of a KD (n = 7–12 per group). (D) The number of platform crossings during the probe trial portion of the MWM increased significantly (P < 0.05) in Kmt2d+/βGeo mice on the KD compared with a standard diet. Compared with KD-treated Kmt2d+/+ mice, KD-treated Kmt2d+/βGeo mice showed no significant difference in platform crossings (P = 0.239; n = 19–32 per group). Kmt2d+/βGeo mice also took longer to reach the platform during the 5-d hidden platform testing of the MWM compared with Kmt2d+/+ controls (increased escape latency); however, KD treatment did not appear to have a significant effect, as assayed by repeated-measures ANOVA (Fig. S10A). Flag testing showed no significant differences between treatment or genotype for platform latency (Fig. S10B). Further control tests for strength, activity, and anxiety-like behaviors (grip strength and open field testing) were unaffected by the genotype (Fig. S10 C and D). *P < 0.05; **P < 0.01; †P < 0.005; ††P < 0.001. (Scale bar: 50 μm.)
Fig. S10.
Control experiments for behavioral testing. (A) The latencies to find the hidden platform during the 5 d of training showed a significant interaction (P < 0.05) between genotypes, but no significant effect from treatment (P = 0.204), as examined by a repeated-measures ANOVA. (B) The latencies to find the platform during the flag training did not show a significant interaction for either genotype or treatment (P = 0.142), as examined by a repeated-measures ANOVA (n = 19–32 per group). (C) Kmt2d+/βGeo mice did not show a significant difference from Kmt2d+/+ mice on the regular diet, and did not demonstrate decreased activity on the KD in an open-field test, whereas Kmt2d+/+ mice did show an increase (P < 0.05) in activity compared with Kmt2d+/βGeo mice only when both were treated with the KD. There were no differences for grip strength for either genotype or treatment (n = 5–15 per group). (D) Kmt2d+/βGeo mice did not show a significant difference from Kmt2d+/+ mice on the regular diet, and did not have decreased activity on the KD, as measured by an open field test, whereas Kmt2d+/+ mice did show an increase (P < 0.001) in activity compared with Kmt2d+/βGeo mice only when both were treated with the KD (n = 13–26 per group). The increased activity seen in wild-type animals on KD has been previously described (50). *P < 0.05; ††P < 0.001.
Exogenous BHB Rescues the Neurogenesis Defect in Kmt2d+/βGeo Mice.
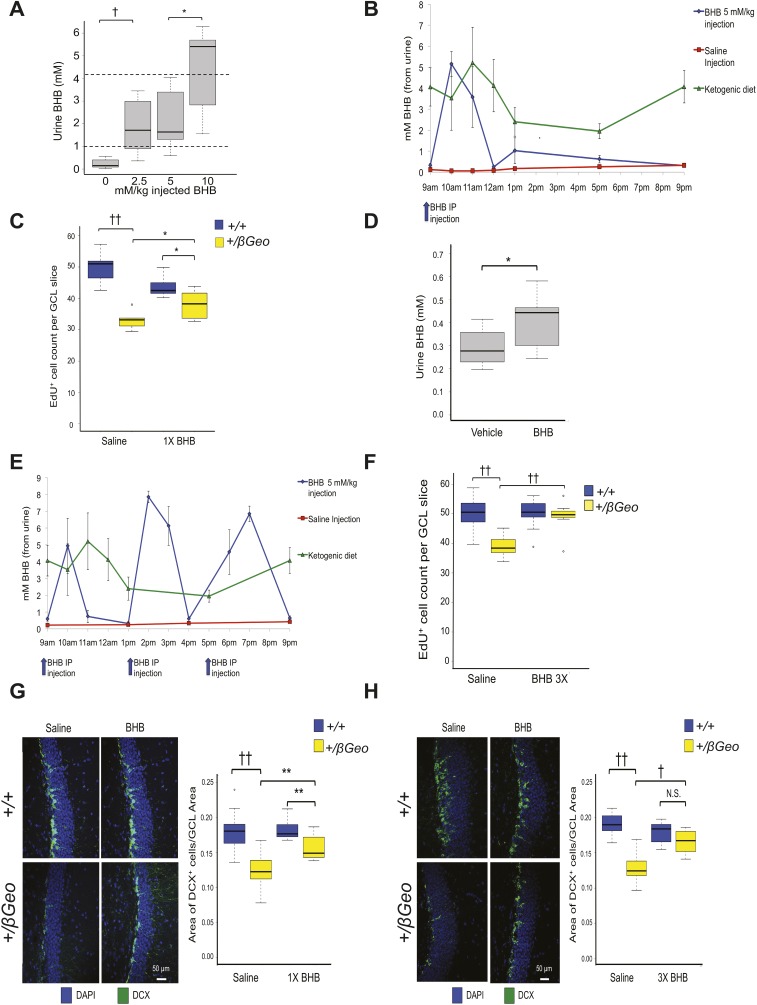
To determine the sufficiency of BHB to rescue the neurogenesis defect in Kmt2d+/βGeo mice, we treated mice with exogenous BHB. A once-daily i.p. injection of 5 mM/kg/d BHB for 2 wk led to peak urine levels of BHB comparable to levels seen in mice on the KD (Fig. S9A); however, given the short half-life of BHB (1–2 h) (19), the overall daily exposure to BHB after a single injection was much less than with the KD (Fig. S9B). Despite this, BHB injections led to a significant increase in EdU+ cells in the GCL of the DG (Fig. S9C), although not to the same magnitude as in the mice on a KD for 2 wk (Fig. 4A). As a consequence, to approximate the BHB exposure during a KD, we used a combination strategy with delivery of BHB by osmotic pump (Fig. S9D) plus three daily IP injections (5 mM/kg BHB) for 2 wk; this strategy achieved daily BHB exposure comparable to KD treatment (Fig. S9E) and resulted in a significant increase in neurogenesis, as measured by the number of EdU+ cells in the GCL of the DG in Kmt2d+/βGeo compared with vehicle-treated Kmt2d+/βGeo mice (Fig. S9F), which closely mirrored the neurogenesis proliferation rescue seen after treatment with the KD (Fig. 4A). Similarly, a quantification of DCX+ cells in the GCL showed a dose-dependent normalization with full recovery at the higher dose level (Fig. S9 G and H).
Fig. S9.
Exogenous BHB treatment rescues the neurogenesis defect in Kmt2d+/βGeo mice. (A) Several distinct doses (0, 2.5, 5, 10 mM/kg) of BHB were injected i.p., followed by urine collection 1.5 h later (approximate time of BHB peak levels) (19). The 5 mM/kg dose shows a BHB level that resembles the urine BHB profile (approximated in this figure with dashed lines) from KD-treated mice (n = 22 total). (B) A single 5 mM/kg BHB injection (9 AM) of BHB per day (for 2 wk) yielded comparable peak levels as mice on a KD but less total daily exposure, as seen from a urine time course (12 h; n = 4–5 per group). Also shown is the saline vehicle group. (C) Kmt2d+/βGeo mice injected with a once-daily dose of 5 mM/kg BHB (for 2 wk) show a significant increase in the EdU+ cell numbers in the GCL of the DG of the mice compared with Kmt2d+/βGeo mice injected with saline vehicle. However, this rescue did not show the same magnitude of rescue compared with the EdU+ cell numbers from KD treatment (n = 5–12). (D) Mice implanted with a 2-wk BHB pump that provided 2.5 mg/mL BHB at a rate of 0.25 µL/h showed a significant (P < 0.05) increase in BHB measured from urine (n = 10–12 per group). However, although the pump provided a constant stream of BHB, the urine BHB did not reach comparable levels to what was seen in mice on a KD (∼1–2 mM BHB). (E) The combination of osmotic pumps and three injections of 5 mM/kg BHB at 9 AM, 1 AM, and 5 AM showed a more similar BHB profile to KD-treated mice when treated for 2 wk (n = 4–5 per group). (F) When treated with this higher daily dose of BHB for 2 wk, we saw a more pronounced rescue of EdU+ cell numbers in the DG GCL in Kmt2d+/βGeo mice, which more closely mirrors the rescue seen after KD treatment. (G and H) We further confirmed the neurogenesis rescue at both low and high doses of BHB (treated for 2 wk) by looking at the fraction of DCX+ cells in the DG GCL, and found that this measure showed similar neurogenesis rescues compared with EdU analysis (n = 7–10 per group). *P < 0.05; **P < 0.01; †P < 0.005. ††P < 0.001. N.S., not significant, P > 0.05.
A KD Rescues Hippocampal Memory Defects in Kmt2d+/βGeo Mice.
Finally we asked whether KD treatment would rescue the hippocampal memory defects seen in Kmt2d+/βGeo mice. The probe trial of a Morris water maze (MWM) assay is a measure previously shown to be particularly sensitive for detecting a disruption of adult neurogenesis (20). We previously demonstrated deficiencies in MWM performance for Kmt2d+/βGeo mice (6) (Fig. 1C). After 2 wk of KD treatment, Kmt2d+/βGeo mice showed a significant increase in the number of platform zone crossings (Fig. 4D) compared with untreated Kmt2d+/βGeo mice.
Discussion
Although BHB has previously been shown to have HDACi activity (7, 21), the potential for therapeutic application remains speculative. Here, we show that therapeutically relevant levels of BHB are achieved with a KD modeled on protocols that are used and sustainable in humans (22, 23). In addition, we demonstrate a therapeutic rescue of disease markers in a genetic disorder by taking advantage of the BHB elevation that accompanies the KD.
Our findings that exogenous BHB treatment lead to similar effects on neurogenesis as the KD support the hypothesis that BHB contributes significantly to the therapeutic effect. In our previous study (6), the HDACi AR-42 led to improved performance in the probe trial of the MWM for both Kmt2d+/βGeo and Kmt2d+/+ mice (genotype-independent improvement). In contrast, KD treatment only led to improvement in Kmt2d+/βGeo mice (genotype-dependent improvement). This discrepancy may relate to the fact that AR-42 acts as an HDACi but also affects the expression of histone demethylases (24), resulting in increased potency but less specificity. Alternatively, because the levels of BHB appear to be higher in Kmt2d+/βGeo mice on the KD, the physiological levels of BHB might be unable to reach levels in Kmt2d+/+ mice high enough to make drastic changes on chromatin.
Although we cannot exclude a contribution from other biochemical actions of BHB such as direct butyrylation of histone tails (25) or the effects of BHB on mitochondrial respiration, synaptic physiology (26), or cellular oxidative stress (7), the concordance of therapeutic effects with those observed on administration of an HDACi (6) provides strong, albeit correlative, evidence that the BHB acts, at least in part, through modulation of histone marks. The global epigenetic abnormalities seen in Kmt2d+/βGeo mice occur in association with altered expression of genes, some of which (such as Glp1r) lead to overlapping neurodevelopmental abnormalities when targeted in mice (17). Interestingly, Glp1r and several of the genes most highly differentially expressed demonstrate normalization on the KD. As with other disorders associated with primary perturbation of epigenetic factors, it is not possible to attribute specific aspects of the disease phenotype to specific genes or pathways; rather, it is likely that phenotypic consequences integrate the combined action of many genes that are dysregulated on attenuation of KMT2D function.
In addition to the effects seen on hippocampal function and morphology, we also uncovered a metabolic phenotype in Kmt2d+/βGeo mice, which leads to both increased BHB/AcAc and lactate/pyruvate ratios during ketosis; an increased NADH/NAD+ ratio could explain both observations. This increased NADH/NAD+ ratio may relate to a previously described propensity of Kmt2d+/βGeo mice toward biochemical processes predicted to produce NADH, including beta-oxidation, and a resistance to high-fat-diet–induced obesity (27). If this exaggerated BHB elevation holds true in patients with KS, the KD may be a particularly effective treatment strategy for this patient population; however, this remains to be demonstrated. Alterations of the NADH/NAD+ ratio could also affect chromatin structure through the action of sirtuins, a class of HDACs that are known to be NAD+ dependent (28). Advocates of individualized medicine have predicted therapeutic benefit of targeted dietary interventions, although currently there are few robust examples (29–31). This work serves as a proof-of-principle that dietary manipulation may be a feasible strategy for KS and suggests a possible mechanism of action of the previously observed therapeutic benefits of the KD for intractable seizure disorder (22, 23).
Materials and Methods
Study Design.
The purpose of this study was to test the hypothesis that the KD could be used as a therapeutic strategy in a mouse model of KS. At least four biological replicates were used for each biochemical analysis. Data collection was performed for a predetermined period, as dictated by literature-based or core facility-based standards, and no exclusion criteria were applied. All analyses were performed by examiners blinded to genotype and/or treatment group. For drug treatments, mice were randomly assigned to treatment groups with approximately equivalent numbers in each group. In box and whisker plots, whiskers extend 1.5 times the interquartile range, as is the default in the R programming language; circles indicate data points outside this range. All data points were used in statistical analysis.
Mice and Dietary Manipulations.
Our mouse model, Kmt2d+/βGeo, also known as Mll2Gt(RRt024)Byg, was generated by BayGenomics through the insertion of a gene trap vector. The KD [4:1 (fat:protein) ratio, F6689 Rodent Diet, Ketogenic, Fat:Paste] paste was acquired from Bio-Serv. Mice were given 2 wk free (ad libitum) access to KD paste as a sole food source. Paste was replaced several times per week. During MWM testing, given the length of testing (more than a week), we treated for 3 wk. Crebbp+/−, also known as Crebbptm1Dli (13), mice were acquired from the Jackson laboratories. All mice used in these studies were between 1 and 2 mo of age unless otherwise noted. All experiments were performed on mice fully backcrossed to C57BL/6J background unless otherwise noted. All mouse experiments were performed in accordance with the NIH Guide for the Care and Use of Laboratory Animals and were approved by the Animal Care and Use Committee of Johns Hopkins University.
Serum and Brain BHB Analysis.
Serum and homogenized brain tissue from Kmt2d+/βGeo and Kmt2d+/+ mice that had been treated with both standard diet and a KD for 2 wk was assayed for BHB levels using a BHB assay kit (MAK041; Sigma).
Serum Creatinine and Blood Urea Nitrogen Analysis.
Serum creatinine and blood urea nitrogen are commonly used markers of kidney function. Both creatinine and blood urea nitrogen levels were measured from serum from Kmt2d+/βGeo and Kmt2d+/+ mice, using standard clinical assays run at the Johns Hopkins comparative medicine analysis core.
BHB Injection and Urine Assay.
Either 5 mM/kg (R)-(−)-3-hydroxybutyric acid sodium salt (32–34) (Santa Cruz Biotechnology) or saline was injected (100 µL) intraperitoneally once or three times a day. (R)-(−)-3-Hydroxybutyric acid sodium salt becomes (R)-(−)-3-hydroxybutyric acid in the blood and can interconvert into BHB, the form measured by ketone assays. Therefore, in text and legends, we used BHB as the label for simplicity. Urine BHB was quantified by the β-hydroxybutyrate (Ketone Body) Colorimetric Assay Kit (Cayman Chemical Company). Urine from injected mice was collected ∼1.5–2 h after injection. Urine from mice on the KD was taken in the early afternoon unless otherwise stated in the text.
Osmotic Pumps.
An Alzet (Durect Co.) microosmotic pump (model 1002) made to allow for 14 d of diffusion was filled (84-µL reservoir) with either 2.5 mg/mL (R)-(−)-3-hydroxybutyric acid sodium salt (Santa Cruz Biotechnology) in saline vehicle or saline vehicle alone. Mice were anesthetized, after which a small incision was made on the skin of the lower back and the pump was placed directly under the skin.
Reporter Alleles.
HEK 293 cells were transfected with lipofectamine LTX (Thermo Fisher) with either our H3K4me3 or H4ac reporter alleles that have been previously described (6). We selected for and maintained stably transfected cells through positive selection with blasticidin at a dose of 10 mg/mL (Life Technologies). Blasticidin selection was stopped 24 h before exposure to BHB. For BHB treatment, (R)-(−)-3-hydroxybutyric acid sodium salt (Santa Cruz Biotechnology) was added to the medium 24 h before FACSVerse flow sorting (BD Sciences). Data were analyzed using FlowJo (Tree Star Inc.).
Serum Lactate and Pyruvate Analysis.
Serum was extracted from whole blood by centrifugation at 3,500 × g for 10 min after 1 h incubation at room temperature. Subsequently, the supernatant was removed and stored at −20 °C. Serum samples were then assayed for levels of lactate and pyruvate with the Lactate Assay Kit (Sigma Aldrich) and Pyruvate Assay Kit (Sigma Aldrich).
Mass Spectrometry for AcAc and BHB.
AcAc and BHB were prepared via acid extraction and BSTFA [N,O-bis(trimethylsilyl)trifluoroacetamide)] derivatization, and detected via gas chromatography–mass spectrometry. The mass spectrometer was set in SCAN mode to detect all mass fragments in a range of m/z 50–600. Compounds were identified on the basis of their characteristic retention time and ion peaks. Results were reported as a ratio of AcAc to BHB.
Microarray Experiment.
Microarray results are based on a joint analysis of two different experiments. Hippocampi were dissected from wild-type and Kmt2d+/βGeo mice on a standard diet. In the first experiment, four wild-type and three Kmt2d+/βGeo mice were profiled, and in the second experiment, three wild-type and three Kmt2d+/βGeo mice were profiled. RNA was extracted from whole hippocampi, using the Qiagen RNeasy kit or TRIzol reagents (Ambion Life Technologies), followed with DNase I treatment (Qiagen). For microarray, cDNA was synthesized by the JHMI High Throughput Biology Center, using the SuperScript II RT assay (Thermo Fisher) following recommended conditions, and hybridized to Affymetrix Mouse Gene 1.0 microarrays.
Analysis of Microarray Data.
The microarray data were preprocessed using the robust multi-array analysis method (35–37), as implemented in the oligo package (38) from Bioconductor (39, 40). Unwanted noise was removed using surrogate variable analysis (41–43) with five surrogate variables. Only probe-sets of the “core” category were analyzed. After surrogate variable analysis, data were analyzed using the limma package (44) with an empirical Bayes variance estimator method (45), and P values were corrected for multiple testing, using the Benjamini-Hochberg procedure (46).
RT-qPCR Validation.
For RT-qPCR validation cDNA was synthesized using the Applied Biosciences High-Capacity cDNA Reverse Transcription Kit. RT-qPCR was done on RNA from the same mice used for microarray (n = 3–4 per group), as well as an additional second cohort treated in an identical fashion with a KD (n = 5–7 per group). The Taqman probes (Life Technologies) used were Pld5, Mm00620912_m1, Fam, S; Glp1r, Mm00445292_m1, Fam, S; Ankfn1: Mm03039417-m1, Fam, S; Kmt2d, Mm01717064-g1, Fam, S, with Pgk1 and Gapdh as controls (Mm99999915_g1, Vic; Mm00435617_m1, Vic, S). For Zic5, the available Taqman probe did not yield any data, so we designed and used a Sybr green assay (Zic5-F: 5′-GAGGCGCTTCCTAGTACTCC-′3; Zic5-R: 5′-GCTGCTATTGGCAAACTTCCTA-′3 with control gene Tfrc (Tfrc-F: 5′-GAGGCGCTTCCTAGTACTCC-′3; Tfrc-R: 5′-CTTGCCGAGCAAGGCTAAAC-′3). The two experimental groups were run and normalized to untreated wild-type and then combined for analysis.
Perfusion, Sectioning, and Staining.
Perfusion, cryosectioning, and immunofluorescence staining were performed as previously described (6). EdU (Life Technologies) in PBS/6% (vol/vol) DMSO (10 mg/mL) injections (50 µg/g/d), were delivered either for 7 consecutive days, followed by immediate perfusion (proliferation), or 7 consecutive days of injection and then perfusion on the 30th day after the first injection (survival). For staining, every sixth brain section was used, and blocking was done with 5% (mass/vol) BSA. EdU was labeled with Click-iT EdU Alexa Fluor 488 Imaging Kit (Thermo Fisher), as well as DAPI mounting with Vectamount (Vector Laboratories). EdU quantification was performed blinded to genotype and treatment. Labeled cells were counted in every sixth slice in the GCL of the DG, and average number per slice was calculated for each brain. Immunofluorescence was performed with the following primary antibodies: DCX (Santa Cruz Biotechnology; 1:200 goat), trimethylated H3K4 (Cell Signaling; 1:500 rabbit), acetylated H3K9, and H3K14 (Cell Signaling; 1:5,000 rabbit). Incubations were performed overnight at 4 °C in blocking buffer. Previous experiments performed on normal serum from which the antibodies were derived showed no nonspecific immunoreactivity (6).
Confocal Microscopy.
Z-stack images were taken at either 10×, using Zeiss Axiovert 200 (Carl Zeiss), or 25×, using Zeiss AxioExaminer multiphoton (Carl Zeiss), with genotypes and treatment blinded to the researcher. Fluorescence intensity of the highlighted GCL layer at the midpoint of the z-stack was measured at 10× magnification, using the Zen software (Carl Zeiss). Fluorescence intensity of either the H3K4me3 or H3ac antibody was divided by the DAPI fluorescence intensity to normalize for cell numbers. For ease of interpretation, values were normalized to Kmt2d+/+ levels. Group comparisons were done using a Student's t test, with significance set at P < 0.05.
DCX Area Measurement.
The DCX positive fraction of the GCL was measured by taking 4× pictures and using the Bezier tool on NS elements 2.0 software (Nikon) to measure the area of DCX+ cells that expressed DCX, as well as the entire area of the GCL. The researcher was blinded to mouse genotype and treatment. The fraction of the GCL that showed DCX+ cells was then calculated, and group differences were analyzed using a Student's t test with significance value set at P < 0.05.
Behavioral Testing.
Behavioral testing was conducted on mice between 1 and 2 mo of age and performed and analyzed blinded to genotype and treatment, with all experiments performed in the late morning or early afternoon. Each particular behavioral test was performed at a consistent time of day. For open-field testing, Kmt2d+/+ and Kmt2d+/βGeo mice were placed individually in an open-field chamber (San Diego Instruments) for ten 180-s intervals. These intervals were combined to give an average activity level, and treatment and genotype groups were compared using a Student's t test with significance value set at P < 0.05. For grip strength, mice were allowed to grab onto the grip strength meter (Columbus Instruments) and were lightly pulled by the tail with increasing force until releasing their grip. This was repeated five times for each mouse, with the highest and lowest value being discarded. The remaining three values were then averaged. Average grip strength for treatment and genotype groups were compared with a Student’s t test with significance value set at P < 0.05. For the MWM, all testing was performed in a standard 1.1-m diameter tank filled with room temperature water stained with white tempera paint (Crayola). The tank had a small platform submerged 2 cm below the water level in the middle of one of the four tank quadrants. For the first 3 d, the platform had a visible flag on top (flag training), and each mouse was placed in the tank for four consecutive 60-s trials in which they were trained to reach the visible platform. During each trial, the platform was moved to a different quadrant, but the mouse was always entered into the tank in the same location. Latency for each trial for each mouse was recorded, and if the mouse could not reach the platform in 60 s, they were placed on the platform. After flag training, the visible flag was removed, and for 5 d, mice were trained to reach the now hidden platform (hidden platform training), with four consecutive trials per mouse per day, with a maximum allotment of 60 s per trial. The platform was never moved, but each trial, the mouse was entered into a different quadrant, with the order of these quadrants randomly assigned for each day. On the final day (probe trial), the platform was removed, the mice were allowed to swim for 90 s, and the number of crossings over the previous location of the platform was measured. For training and probe tests, data were recorded both manually and electronically, with ANY-maze software (San Diego Instruments). The four genotype and treatment groups were analyzed for differences, using a Student's t test during the probe trial and with repeated-measures ANOVA within-subjects test for the latencies.
Acknowledgments
We thank Dr. H. Dietz, Dr. B. Migeon, Dr. A. Chakravarti, Dr. P. Cole, and Dr. D. Valle for their many helpful suggestions. We thank Catherine Kiefe for her assistance with creating and editing Figs. S1 and S4. We also thank H. S. Cho for his work in the early stages of this project and Dr. J. A. Fahrner for her work on the latter stages of this project. Finally, we thank M. F. Kemper, R. J. Pawlosky, and R. L. Veech for advice regarding how to best measure BHB in brain. This work was supported by a National Institute of Health grant (to H.T.B.; Director’s Early Independence Award, DP5OD017877) and a gift from the Benjamin family (no relation to the first author).
Footnotes
Conflict of interest statement: J.S.B. and H.T.B. have a pending patent for the use of a ketogenic diet and injection of BHB for treatment of Mendelian disorders of the epigenetic machinery.
This article is a PNAS Direct Submission.
Data deposition: The hippocampal gene expression datasets have been deposited in the Gene Expression Omnibus (GEO) database, www.ncbi.nlm.nih.gov/geo (accession no. GSE90836).
This article contains supporting information online at www.pnas.org/lookup/suppl/doi:10.1073/pnas.1611431114/-/DCSupplemental.
References
- 1.Ng SB, et al. Exome sequencing identifies MLL2 mutations as a cause of Kabuki syndrome. Nat Genet. 2010;42(9):790–793. doi: 10.1038/ng.646. [DOI] [PMC free article] [PubMed] [Google Scholar]
- 2.Lederer D, et al. Deletion of KDM6A, a histone demethylase interacting with MLL2, in three patients with Kabuki syndrome. Am J Hum Genet. 2012;90(1):119–124. doi: 10.1016/j.ajhg.2011.11.021. [DOI] [PMC free article] [PubMed] [Google Scholar]
- 3.Miyake N, et al. KDM6A point mutations cause Kabuki syndrome. Hum Mutat. 2013;34(1):108–110. doi: 10.1002/humu.22229. [DOI] [PubMed] [Google Scholar]
- 4.Fahrner JA, Bjornsson HT. Mendelian disorders of the epigenetic machinery: tipping the balance of chromatin states. Annu Rev Genomics Hum Genet. 2014;15:269–293. doi: 10.1146/annurev-genom-090613-094245. [DOI] [PMC free article] [PubMed] [Google Scholar]
- 5.Ming GL, Song H. Adult neurogenesis in the mammalian brain: significant answers and significant questions. Neuron. 2011;70(4):687–702. doi: 10.1016/j.neuron.2011.05.001. [DOI] [PMC free article] [PubMed] [Google Scholar]
- 6.Bjornsson HT, et al. Histone deacetylase inhibition rescues structural and functional brain deficits in a mouse model of Kabuki syndrome. Sci Transl Med. 2014;6(256):256ra135. doi: 10.1126/scitranslmed.3009278. [DOI] [PMC free article] [PubMed] [Google Scholar]
- 7.Shimazu T, et al. Suppression of oxidative stress by β-hydroxybutyrate, an endogenous histone deacetylase inhibitor. Science. 2013;339(6116):211–214. doi: 10.1126/science.1227166. [DOI] [PMC free article] [PubMed] [Google Scholar]
- 8.Hasselbalch SG, et al. Blood-brain barrier permeability of glucose and ketone bodies during short-term starvation in humans. Am J Physiol. 1995;268(6 Pt 1):E1161–E1166. doi: 10.1152/ajpendo.1995.268.6.E1161. [DOI] [PubMed] [Google Scholar]
- 9.Sleiman SF, et al. Exercise promotes the expression of brain derived neurotrophic factor (BDNF) through the action of the ketone body beta-hydroxybutyrate. Elife. 2016;16:5e15092. doi: 10.7554/eLife.15092. [DOI] [PMC free article] [PubMed] [Google Scholar]
- 10.Lee MG, et al. Functional interplay between histone demethylase and deacetylase enzymes. Mol Cell Biol. 2006;26(17):6395–6402. doi: 10.1128/MCB.00723-06. [DOI] [PMC free article] [PubMed] [Google Scholar]
- 11.Freeman JM, et al. The efficacy of the ketogenic diet-1998: a prospective evaluation of intervention in 150 children. Pediatrics. 1998;102(6):1358–1363. doi: 10.1542/peds.102.6.1358. [DOI] [PubMed] [Google Scholar]
- 12.Courcet JB, et al. Clinical and molecular spectrum of renal malformations in Kabuki syndrome. J Pediatr. 2013;163(3):742–746. doi: 10.1016/j.jpeds.2013.02.032. [DOI] [PubMed] [Google Scholar]
- 13.Kung AL, et al. Gene dose-dependent control of hematopoiesis and hematologic tumor suppression by CBP. Genes Dev. 2000;14(3):272–277. [PMC free article] [PubMed] [Google Scholar]
- 14.Alarcón JM, et al. Chromatin acetylation, memory, and LTP are impaired in CBP+/- mice: a model for the cognitive deficit in Rubinstein-Taybi syndrome and its amelioration. Neuron. 2004;42(6):947–959. doi: 10.1016/j.neuron.2004.05.021. [DOI] [PubMed] [Google Scholar]
- 15.Kurdistani SK. Chromatin: a capacitor of acetate for integrated regulation of gene expression and cell physiology. Curr Opin Genet Dev. 2014;26:53–58. doi: 10.1016/j.gde.2014.06.002. [DOI] [PMC free article] [PubMed] [Google Scholar]
- 16.Castonguay Z, Auger C, Thomas SC, Chahma M, Appanna VD. Nuclear lactate dehydrogenase modulates histone modification in human hepatocytes. Biochem Biophys Res Commun. 2014;454(1):172–177. doi: 10.1016/j.bbrc.2014.10.071. [DOI] [PubMed] [Google Scholar]
- 17.During MJ, et al. Glucagon-like peptide-1 receptor is involved in learning and neuroprotection. Nat Med. 2003;9(9):1173–1179. doi: 10.1038/nm919. [DOI] [PubMed] [Google Scholar]
- 18.Chehrehasa F, Meedeniya AC, Dwyer P, Abrahamsen G, Mackay-Sim A. EdU, a new thymidine analogue for labelling proliferating cells in the nervous system. J Neurosci Methods. 2009;177(1):122–130. doi: 10.1016/j.jneumeth.2008.10.006. [DOI] [PubMed] [Google Scholar]
- 19.Clarke K, et al. Kinetics, safety and tolerability of (R)-3-hydroxybutyl (R)-3-hydroxybutyrate in healthy adult subjects. Regul Toxicol Pharmacol. 2012;63(3):401–408. doi: 10.1016/j.yrtph.2012.04.008. [DOI] [PMC free article] [PubMed] [Google Scholar]
- 20.Garthe A, Kempermann G. An old test for new neurons: refining the Morris water maze to study the functional relevance of adult hippocampal neurogenesis. Front Neurosci. 2013;7:63. doi: 10.3389/fnins.2013.00063. [DOI] [PMC free article] [PubMed] [Google Scholar]
- 21.Lim S, et al. D-β-hydroxybutyrate is protective in mouse models of Huntington’s disease. PLoS One. 2011;6(9):e24620. doi: 10.1371/journal.pone.0024620. [DOI] [PMC free article] [PubMed] [Google Scholar]
- 22.Wheless JW. History of the ketogenic diet. Epilepsia. 2008;49(Suppl 8):3–5. doi: 10.1111/j.1528-1167.2008.01821.x. [DOI] [PubMed] [Google Scholar]
- 23.Gasior M, Rogawski MA, Hartman AL. Neuroprotective and disease-modifying effects of the ketogenic diet. Behav Pharmacol. 2006;17(5-6):431–439. doi: 10.1097/00008877-200609000-00009. [DOI] [PMC free article] [PubMed] [Google Scholar]
- 24.Huang PH, Plass C, Chen CS. Effects of histone deacetylase inhibitors on modulating H3K4 methylation marks - a novel cross-talk mechanism between histone-modifying enzymes. Mol Cell Pharmacol. 2011;3(2):39–43. [PMC free article] [PubMed] [Google Scholar]
- 25.Chen Y, et al. Lysine propionylation and butyrylation are novel post-translational modifications in histones. Mol Cell Proteomics. 2007;6(5):812–819. doi: 10.1074/mcp.M700021-MCP200. [DOI] [PMC free article] [PubMed] [Google Scholar]
- 26.Kim DY, Vallejo J, Rho JM. Ketones prevent synaptic dysfunction induced by mitochondrial respiratory complex inhibitors. J Neurochem. 2010;114(1):130–141. doi: 10.1111/j.1471-4159.2010.06728.x. [DOI] [PMC free article] [PubMed] [Google Scholar]
- 27.Kim DH, et al. Crucial roles of mixed-lineage leukemia 3 and 4 as epigenetic switches of the hepatic circadian clock controlling bile acid homeostasis in mice. Hepatology. 2015;61(3):1012–1023. doi: 10.1002/hep.27578. [DOI] [PMC free article] [PubMed] [Google Scholar]
- 28.Cohen HY, et al. Calorie restriction promotes mammalian cell survival by inducing the SIRT1 deacetylase. Science. 2004;305(5682):390–392. doi: 10.1126/science.1099196. [DOI] [PubMed] [Google Scholar]
- 29.Elliott R, Ong TJ. Nutritional genomics. BMJ. 2002;324(7351):1438–1442. doi: 10.1136/bmj.324.7351.1438. [DOI] [PMC free article] [PubMed] [Google Scholar]
- 30.Ordovas JM, Corella D. Nutritional genomics. Annu Rev Genomics Hum Genet. 2004;5:71–118. doi: 10.1146/annurev.genom.5.061903.180008. [DOI] [PubMed] [Google Scholar]
- 31.García-Cañas V, Simó C, León C, Cifuentes A. Advances in Nutrigenomics research: novel and future analytical approaches to investigate the biological activity of natural compounds and food functions. J Pharm Biomed Anal. 2010;51(2):290–304. doi: 10.1016/j.jpba.2009.04.019. [DOI] [PubMed] [Google Scholar]
- 32.Yum MS, Ko TS, Kim DW. β-Hydroxybutyrate increases the pilocarpine-induced seizure threshold in young mice. Brain Dev. 2012;34(3):181–184. doi: 10.1016/j.braindev.2011.05.012. [DOI] [PubMed] [Google Scholar]
- 33.Yum MS, Ko TS, Kim DW. Anticonvulsant effects of β-hydroxybutyrate in mice. J Epilepsy Res. 2012;2(2):29–32. doi: 10.14581/jer.12008. [DOI] [PMC free article] [PubMed] [Google Scholar]
- 34.Yum MS, et al. β-Hydroxybutyrate attenuates NMDA-induced spasms in rats with evidence of neuronal stabilization on MR spectroscopy. Epilepsy Res. 2015;117:125–132. doi: 10.1016/j.eplepsyres.2015.08.005. [DOI] [PubMed] [Google Scholar]
- 35.Carvalho B, Bengtsson H, Speed TP, Irizarry RA. Exploration, normalization, and genotype calls of high-density oligonucleotide SNP array data. Biostatistics. 2007;8(2):485–499. doi: 10.1093/biostatistics/kxl042. [DOI] [PubMed] [Google Scholar]
- 36.Irizarry RA, et al. Summaries of Affymetrix GeneChip probe level data. Nucleic Acids Res. 2003;31(4):e15. doi: 10.1093/nar/gng015. [DOI] [PMC free article] [PubMed] [Google Scholar]
- 37.Irizarry RA, et al. Exploration, normalization, and summaries of high density oligonucleotide array probe level data. Biostatistics. 2003;4(2):249–264. doi: 10.1093/biostatistics/4.2.249. [DOI] [PubMed] [Google Scholar]
- 38.Carvalho BS, Irizarry RA. A framework for oligonucleotide microarray preprocessing. Bioinformatics. 2010;26(19):2363–2367. doi: 10.1093/bioinformatics/btq431. [DOI] [PMC free article] [PubMed] [Google Scholar]
- 39.Gentleman RC, et al. Bioconductor: open software development for computational biology and bioinformatics. Genome Biol. 2004;5(10):R80. doi: 10.1186/gb-2004-5-10-r80. [DOI] [PMC free article] [PubMed] [Google Scholar]
- 40.Huber W, et al. Orchestrating high-throughput genomic analysis with Bioconductor. Nat Methods. 2015;12(2):115–121. doi: 10.1038/nmeth.3252. [DOI] [PMC free article] [PubMed] [Google Scholar]
- 41.Leek JT, Johnson WE, Parker HS, Jaffe AE, Storey JD. The sva package for removing batch effects and other unwanted variation in high-throughput experiments. Bioinformatics. 2012;28(6):882–883. doi: 10.1093/bioinformatics/bts034. [DOI] [PMC free article] [PubMed] [Google Scholar]
- 42.Leek JT, Storey JD. A general framework for multiple testing dependence. Proc Natl Acad Sci USA. 2008;105(48):18718–18723. doi: 10.1073/pnas.0808709105. [DOI] [PMC free article] [PubMed] [Google Scholar]
- 43.Leek JT, Storey JD. Capturing heterogeneity in gene expression studies by surrogate variable analysis. PLoS Genet. 2007;3(9):1724–1735. doi: 10.1371/journal.pgen.0030161. [DOI] [PMC free article] [PubMed] [Google Scholar]
- 44.Ritchie ME, et al. limma powers differential expression analyses for RNA-sequencing and microarray studies. Nucleic Acids Res. 2015;43(7):e47. doi: 10.1093/nar/gkv007. [DOI] [PMC free article] [PubMed] [Google Scholar]
- 45.Smyth GK. Linear models and empirical bayes methods for assessing differential expression in microarray experiments. Stat Appl Genet Mol Biol. 2004;3(1):1–25. doi: 10.2202/1544-6115.1027. [DOI] [PubMed] [Google Scholar]
- 46.Benjamini Y, Hochberg Y. Controlling the false discovery rate: a practical and powerful approach to multiple testing. J R Stat Soc Series B Stat Methodol. 1995;57(1):289–300. [Google Scholar]
- 47.Feron O. Pyruvate into lactate and back: from the Warburg effect to symbiotic energy fuel exchange in cancer cells. Radiother Oncol. 2009;92(3):329–333. doi: 10.1016/j.radonc.2009.06.025. [DOI] [PubMed] [Google Scholar]
- 48.White H, Venkatesh B. Clinical review: ketones and brain injury. Crit Care. 2011;15(2):219. doi: 10.1186/cc10020. [DOI] [PMC free article] [PubMed] [Google Scholar]
- 49.Zhang M, et al. AR-42 induces apoptosis in human hepatocellular carcinoma cells via HDAC5 inhibition. Oncotarget. 2016;7(16):22285–22294. doi: 10.18632/oncotarget.8077. [DOI] [PMC free article] [PubMed] [Google Scholar]
- 50.Zhao Q, Stafstrom CE, Fu DD, Hu Y, Holmes GL. Detrimental effects of the ketogenic diet on cognitive function in rats. Pediatr Res. 2004;55(3):498–506. doi: 10.1203/01.PDR.0000112032.47575.D1. [DOI] [PubMed] [Google Scholar]


