

ABSTRACT
The heterogeneous responses of clonal cancer cells to treatment is understood to be caused by several factors, including stochasticity, cell-cycle dynamics, and different micro-environments. In a tumor, cancer cells may encounter fluctuating conditions and transit from a stationary culture to a proliferating state, for example this may occur following treatment. Here, we undertake a quantitative evaluation of the response of single cancerous lymphoblasts (L1210 cells) to various treatments administered during this transition. Additionally, we developed an experimental system, a “Mammalian Mother Machine,” that tracks the fate of thousands of mammalian cells over several generations under transient exposure to chemotherapeutic drugs. Using our developed system, we were able to follow the same cell under repeated treatments and continuously track many generations. We found that the dynamics of the transition between stationary and proliferative states are highly variable and affect the response to drug treatment. Using cell-cycle markers, we were able to isolate a subpopulation of persister cells with distinctly higher than average survival probability. The higher survival rate encountered with cell-cycle phase specific drugs was associated with a significantly longer time-till-division, and was reduced by a non cell-cycle specific drug. Our results suggest that the variability of transition times from the stationary to the proliferating state may be an obstacle hampering the effectiveness of drugs and should be taken into account when designing treatment regimens.
KEYWORDS: cell-cycle, chemotherapy, microfluidics, persistence, proliferating, quiescence, stationary
Introduction
For a long time, cancer cell populations have been known to show variability in their response to drugs.32 For many years the main paradigm behind tumor progression, in general, and drug insensitivity, in particular, held that these phenomena are fuelled by somatic mutations. However, the “re-treatment response,” in which patients who relapsed after attaining remission are retreated with the same type of chemotherapy successfully, cannot be explained by genetic resistance mutations.15 Studies on non-genetic heterogeneity in clonal populations and its relevance for drug response in many biological systems, from bacteria4 to human cells,14 Spencer 2009), have suggested that non-genetic mechanisms may underlie treatment failure. In particular, the existence of genetically identical subpopulations with increased survival to drugs, termed “persisters,” was observed.5,62
One of the oldest models describing tumor progression suggested that cancer cell variability in response to drugs depends on the cell-cycle phase at the time of drug administration. The relation between cell-cycle dynamics and the effect of many chemotherapy agents is well established.61 Comparison of exponential and stationary cell populations following treatment has shown a large difference in their response to most drugs, with a stationary population being often less susceptible,7 depending on the drug type. Chemotherapeutic drugs have been broadly classified as: (i) ‘cell-cycle-phase specific’, namely, drugs with maximal efficacy at a certain phase of the cell cycle, (ii) ‘cell-cycle-non-phase specific’, namely, drugs that target proliferating cells in all cell-cycle phases, and (iii) ‘non cell-cycle specific’ for drugs that target both proliferating and non-proliferating cells.34 Most in vitro studies have measured the drug response of continuously exponentially growing cultures, which are typically extremely sensitive to drug treatment despite the cell-cycle variability inherent to exponentially growing cells.60 However, cancer cells are rarely in the condition of continuous exponential growth, as exponential growth quickly results in crowding, nutrient depletion and stationary conditions.42
Many analyses of the cell-cycle states of cancerous populations show that in various cancers a substantial fraction of the cells are dormant.1 These dormant cells are less susceptible to drugs and might be the source of relapse.1 Furthermore, recent studies of the response of single cells to several drugs detected a variability that could not be explained solely by the cell-cycle phase.18,25 Another reason for the variable response seen in cancerous populations is suggested by the cancer stem cell (CSC) hypothesis.56 CSCs are thought to be quiescent most of the time;30,36 thus many anti-cancer drugs, targeting highly proliferative cells, may not target these cells.12,37,55,56 Although CSCs are an important target in the way to eradicate cancer, as long as they are quiescent, they pose little threat, until they start proliferating or acquire mutations, making their progeny resistant to treatment.10 Recently, CSCs were shown to re-enter the cell-cycle following chemotherapy.41 Therefore, studying the transition from stationary to proliferative conditions is key to understanding the role of transient dormancy in the response to drug treatments.
The dynamics of the release from the stationary state, triggered by exposure to fresh medium that supports exponential growth, has hardly been studied in the context of survival under chemotherapy treatments. In this work, we developed several techniques to study the transition from the stationary state to exponential growth, termed here Stationary to Proliferative transition (STP), at the single cell level. By monitoring the response of single cells before, during and after treatment in microfluidic devices, we were able to quantify the impact of this transition on the response to chemotherapy. Finally, we identified a subpopulation that is less susceptible from phase-specific chemotherapy agents during STP. The higher survival of the persister subpopulation during this “grace period” may have an impact on treatment efficacy.
Results
Cells released from stationary conditions display tolerance to anti-cancer drugs
AraC (also known as cytarabine) is a chemotherapy agent that interferes with DNA synthesis. It is classified as a phase-specific drug, and shown to exert maximal toxicity at the S phase.6,29 Moreover, AraC's toxicity was shown to be much higher in exponentially growing, rather than in stationary, L1210 lymphoblasts.7 Vincristine, an antimitotic drug from the Vinca alkaloid family, is another potent drug that is also classified as phase-specific. Cells have been found to undergo mitotic arrest under Vincristine treatment,33 with a higher toxicity when the drug is introduced during the S-phase.47 We studied cell survival under the influence of these drugs in both exponential and STP conditions.
To measure culture survivability directly, we used time-lapse microscopy of L1210 lymphoblast cell line, stably transfected with the Fucci markers58,60 (see Materials and Methods). This method is faster and provides more information than the popular clonogenic test.35 Unlike survival assays that are based solely on end-point measurements, we track the cells for several days and death is detected by phase-contrast microscopy.39,60 This method can differentiate between cells that survive the drug and subsequently divide, cells that die and cells that are non-dividing. The use of the Fucci markers also enables tracking the progression through the cell-cycle. In this work, we define a cell as a survivor only if it has divided at least twice (i.e. produced at least one granddaughter). Although this classification requires a very long time-lapse in order to follow several post-treatment division events, it is required in the context of cancer relapse, where only cells that are able to proliferate after treatment are relevant. Hence, the survival assessment is limited to the time frame of the experiment (typically several days).
We compared survival rate of STP versus exponential cells exposed to AraC and Vincristine (Fig. 1). After exposure, the cells were washed and monitored under the microscope to quantify survival rates. We found that STP cells are significantly less susceptible than exponential cells to both drugs (Fig. 1B–C).
Figure 1.
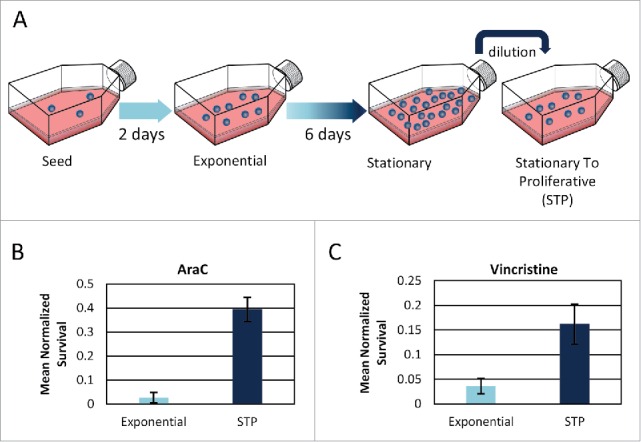
STP cells survive drug treatment better than exponential cells. (A) Schematic definition of the STP (Stationary To Proliferative) state: Cells are grown from a concentration of ∼2*1e4 cells/ml for a week, without dilution. Then, the cells are diluted to fresh medium and are referred to as STP. (B+C) Survival rates of exponential and STP cells following (B) 18h of AraC, normalized to untreated cells. Mean of 3 replicates presented. Error bars represent SE. One-tail Wilcoxon rank sum test p ≤ 0.05. (C) 24h of Vincristine. Mean of 6 and 2 replicates for exponential and STP cultures, respectively, is presented. Error bars represent SE. One-tail Wilcoxon rank sum test p < 0.05.
Tolerance to drug treatment is not inherited
A common cause of drug failure is the emergence of resistance by genetic mutations.27 Since the stationary state might impose a selective stress or increased mutation rates, we wanted to evaluate whether or not the higher rate of survival in STP cells following chemotherapy treatment is due to resistance. A simple way to investigate this possibility is by exposing the surviving cells to another round of treatment. If the cells that survived the initial treatment had acquired a resistance mutation, their descendants should possess the same trait and, thus, a second treatment of the surviving cells' descendants should result in a higher survival rate. However, if the cause of the high survival rate stems from different cell-cycle dynamics following stationary dilution, the progeny should be killed as efficiently as those in the exponential culture, once it resumes growth.
In order to monitor survival directly under 2 rounds of treatment, we designed and fabricated a special microfluidics device based on the so-called “Mother-Machine” developed for bacteria,67 but here adapted to follow mammalian cells and their descendants under controlled conditions (see Materials and Methods) (Figs. 2A S1 and S2). STP cells are exposed to fresh medium with drug. After 18 hours, the medium is changed to flush the drug and to enable exponential growth of the surviving cells for several days. Then, their descendants are exposed again to the same chemotherapeutic treatment and the survival to this second treatment is monitored. Most of the surviving cell descendants perished following the second treatment (Fig. 2, Fig. S2 and supplementary video), supporting the notion that the persistence to the anti-cancer drugs is not due to a genetic mutation that confers resistance.
Figure 2.
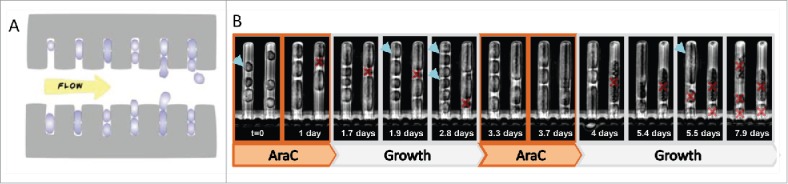
STP survival to AraC treatment is not due to resistance. (A) Scheme of the “Mother Machine” microfluidic device. The device consists of a series of channels into which cells are loaded, perpendicular to a main channel in which medium flows. This flow results in diffusion of fresh medium into the adjacent channels as well as removal of cells into the main channel as they emerge from the perpendicular channels. (B) Fucci-red stationary cells were placed in a Mother Machine microfluidic device with growth medium and exposed to 2 rounds of AraC. While ∼42% of the cells survived the first round of treatment, none of them survived the second round, indicating that these cells are not genetically resistant. Two channels of the Mother Machine, in which one cell divides twice following the first round of AraC treatment, divides once following the second round and all its descendants die. Blue arrows mark the surviving cell (first round of treatment) and its progeny. Red crosses mark dead cells.
Cells released from stationary conditions have an extended STP duration
The two drugs used here are cell-cycle phase specific. Therefore, we monitored the cell-cycle dynamics of STP cells in the absence of treatment (Fig. 1A) in order to understand whether the increased survival stems from distinct cell-cycle dynamics. We observed that the STP duration (23.9 ± 2.3 hr), namely the time span from dilution to fresh medium till the first division, is very different from the typical cell cycle of exponentially growing cells (14.3 ± 1 hr) (Fig. 3A, B, C, E).
Figure 3.
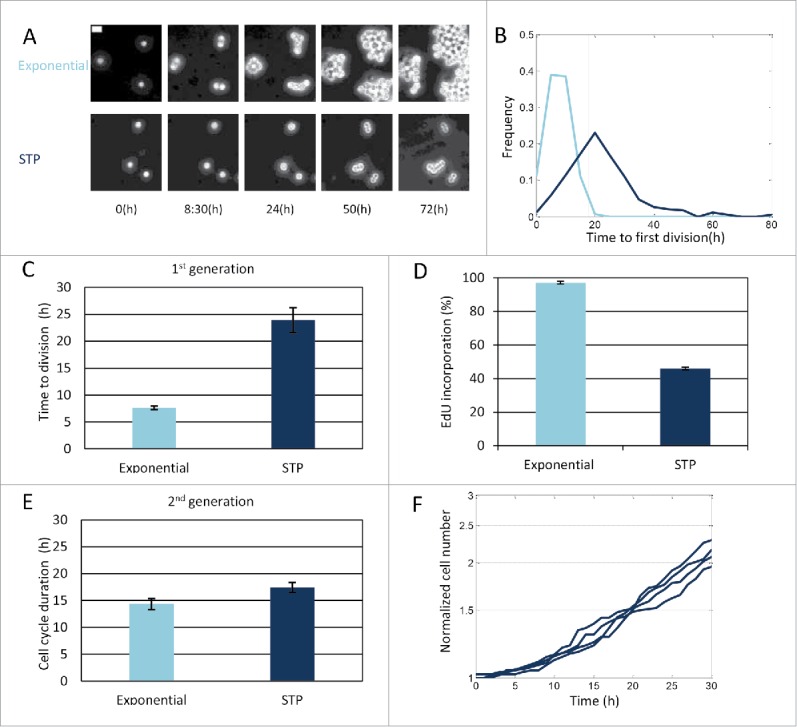
Characterization of cell-cycle dynamics of cells undergoing STP. (A) Time–lapse phase-contrast images of exponential and STP L1210 Fucci cells. Bar: 20 µm. (B) Cells were monitored under the microscope and the time to the first division was recorded. Time to first division of exponential and STP cells is displayed. The Kolmogorov-Smirnov test indicates significant difference in the STP distributions (p = 2.1e-086). (C) Average time to first division of the first generation of exponential or STP cells. Mean of 4 replicates presented (Wilcoxon rank sum test p < 0.05). (D) Percent of viable EdU incorporating cells for exponential and STP populations. Mean of 2 replicates presented (Wilcoxon rank sum test on the label intensity of original distributions p < 0.1). (E) Average cell cycle duration of the second generation of exponential and STP cells. Mean of at least 4 replicates presented (Wilcoxon rank sum test p > 0.1). (C–E) Error bars: SE. (F) Proliferation dynamics of STP cells from 4 independent experiments.
Since AraC's maximal toxicity is achieved during DNA synthesis, namely in the S phase, we hypothesized that the surviving cells may be those arrested in the G0/G1 phase. In order to estimate the percentage of cells synthesising DNA during the STP duration, we used the Click-iT EdU dye,59 which is efficiently incorporated into newly synthesized DNA (see Materials and Methods). We found that less than half of the population progressed through the S phase in the 18 hours following dilution, as assayed by EdU incorporation (Fig. 3D). This is significantly less than the percentage of exponential cells incorporating EdU at the same time (>95%). In order to understand whether the slow dynamics of STP transition are inherited after one division, we monitored the duration of the next cell cycle. We observed that, after one division the memory of the stationary conditions is lost and STP cells have similar cell cycle duration as exponential cells (Fig. 3E).
These observations suggested that STP cells are protected from cell-cycle specific drugs because of their delayed cell-cycle dynamics, but that this protective effect is lost after one division (Fig. 3E–F). Accordingly, waiting 1 day following dilution, to allow most cells to divide before drug exposure, resulted in a much higher killing fraction: cells exposed to drug immediately following dilution had a survival rate about 6 times higher than cells exposed to drug 1 day later. This confirmed the transient protective effect of the STP duration and further ruled out the possibility that a resistant mutation is responsible for the high rate of survival that we observed.
L1210 stationary cells are distributed throughout the cell cycle phases
The increased survival of the STP cells suggested that they were arrested in the G1 state. The prevalent view is that stationary state cells arrest at G1.50 In order to understand the cell-cycle state of STP cells, we carried out DNA content analysis (using Hoechst) on both stationary and exponential cells (Fig. 4). The distribution of the DNA content was quite similar in these 2 conditions. Specifically, many stationary cells seem to have a DNA content that is higher than expected for G1 arrested cells.
Figure 4.
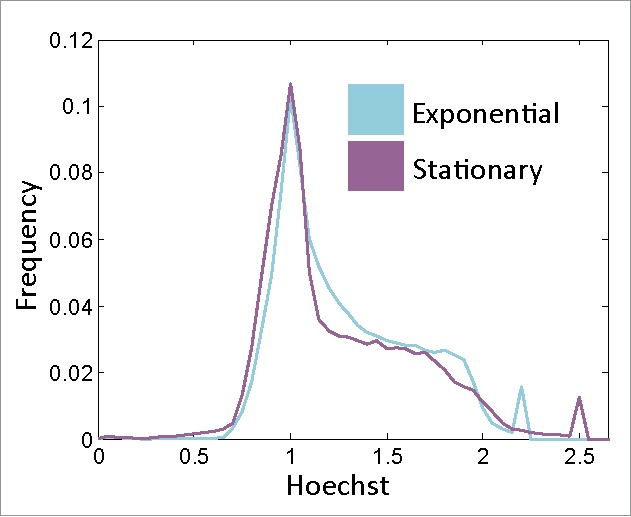
Stationary cells are not arrested at G1. DNA content histograms of viable exponential and stationary cells. Hoechst axis is normalized to the main peak of each population (Fig. S3).
To further study the cell cycle distribution, we used the Fucci markers57 to separate G1 (Fucci-red) and S/G2/M (Fucci-green) cells. The Fucci system, namely the Fluorescence Ubiquitin Cell Cycle Indicator, is a genetically encoded, 2-color (red and green), indicator that enables monitoring of cell-cycle phases at the single cell level (Fig. 5A). We formulated a simplistic model, describing the Fucci markers underlying network, that mimics the behavior of the typical Fucci dynamics in exponential cells and enables defining the G1 and S/G2/M durations (Fig. 5B, C and Materials and Methods). Since the Fucci markers have mainly been studied in exponential cells, we wanted to ensure that these markers also faithfully represent the different cell-cycle stages in stationary state cells (Fig. 5D–F). Indeed, comparing the Hoechst and Fucci markers states in stationary cells showed that Fucci markers reliably indicate cell-cycle progression in the stationary state. The Fucci-red subpopulation mainly rests in the 2N fraction, while the Fucci-green subpopulation shows a higher Hoechst signal, indicative of cells in later phases of the cell cycle. Note that part of the population does not give a signal above background in either the green or red channel and, therefore, is not taken into account in further analyses. We conclude that Hoechst and Fucci marker analyses concur in showing that stationary L1210 cells are distributed throughout the cell-cycle phases.
Figure 5.

Fucci markers also indicate the cell-cycle phases in stationary and STP cells. (A) Schematic description of the Fucci markers used for visualizing the cell-cycle progression. (B) Fucci markers levels of an exponential representative cell measured by time-lapse fluorescent microscopy. (C) Fucci marker levels according to the simple model (see Materials and Methods) (D–F) DNA content histograms of the Fucci-red and Fucci-green subpopulations of (D) Exponential (E) STP (18h after stationary release) and (F) Stationary cells. Hoechst axis is normalized to the main peak of the populations.
Survival is mainly due to a subpopulation of G0/G1 cells
The observation that stationary phase cells are not uniformly arrested at G1 prompted us to compare the survival of STP cells taken from either G1 or S/G2/M populations, using the Fucci markers. Stationary cells were sorted to Fucci-red (G1) or Fucci-green (S/G2/M) subpopulations, diluted into fresh media with AraC for 18 hours, and then washed and monitored using time-lapse microscopy to measure their survival rates (Fig. 6A, B). STP Fucci-red cells showed significantly higher survival rates than STP Fucci-green cells. Similar results were obtained following treatment with Vincristine (Fig. S4), though the difference between the subpopulations was less pronounced. In contrast, treatment with BCNU, a non cell-cycle specific drug, did not result in a marked difference between the 2 Fucci subpopulations (Fig. 6C). It is important to note that the dynamics of this STP Fucci-red subpopulation are different from that of exponential Fucci-red cells (Fig. S5). According to our model (Materials and Methods), the observation of both red and green markers levels rising together - a phenotype seen in many STP cells (Fig. S5), could result from reduced degradation at the initial hours following dilution. It is reasonable to conclude that at the initial stages of release from long stationary state, the Ubiquitin-dependent protein degradation system is not fully operational.21
Figure 6.
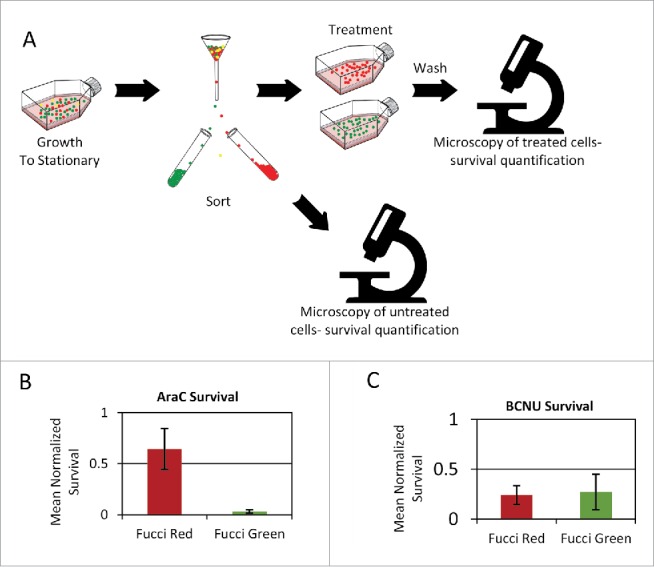
Persistence to phase-specific drugs is due to a Fucci-red subpopulation. Stationary cells are sorted by FACS according to the Fucci markers and viability marker. After exposure to chemotherapy agents, cells are washed and monitored by time-lapse microscopy to detect cell fate. (A) Scheme of the experimental layout. (B) Increased survival of the STP Fucci-red subpopulation compared to the Fucci-green subpopulation under the phase-specific drug AraC (one-tail Wilcoxon rank sum test p ≤ 0.05) (C) For the non-specific drug BCNU, no significant difference is observed (one-tail Wilcoxon rank sum test p > 0.4.) (B–C) Mean of 3 replicates presented. Error bars: SE.
Accordingly, the survival of the Fucci-red exponential population to drugs is significantly lower than for the STP Fucci-red population (less than 1% survival of exponential Fucci-red, compared to ∼65% of STP Fucci-red). Thus, the STP G1 subpopulation is more protected than the typical G1 subpopulation of exponential cells.
Within the STP population, the higher survivability of the Fucci-red subpopulation compared to the Fucci-green subpopulation suggests different cell-cycle dynamics on exiting from stationary conditions. Indeed, the measured STP duration of this Fucci-red subpopulation is significantly longer than that measured for the Fucci-green subpopulation (Fig. 7A). Thus, STP duration following the stationary state seems to protect a subpopulation of cells from the action of cell-phase specific drugs. In order to test whether the STP Fucci-red cells are arrested before the S-phase in the initial hours of STP and, therefore, do not synthesize DNA, we assessed S-phase dynamics in both subpopulations following dilution. We sorted stationary Fucci-red and Fucci-green subpopulations, diluted and incubated them in fresh medium containing EdU. We took samples of these cultures 2 and 8 hours following dilution (Fig. 7B). As expected from the high survival rate under AraC treatment, the Fucci-red subpopulation was hardly labeled after 8hr, while the Fucci-green subpopulation had ∼18% of the population labeled within 2 hours after dilution, with the fraction of incorporating cells increasing after 8 hours to ∼27%. We conclude that an extensive arrest at G1 protects the STP Fucci-red cells from the phase-specific effect of AraC. Note that the delay in the incorporation of DNA for more than 8 hours is significantly longer than the typical G1 phase of exponential L1210 cells (∼3.5 hours in our cell line,60 similarly to that measured in ref. 63).
Figure 7.
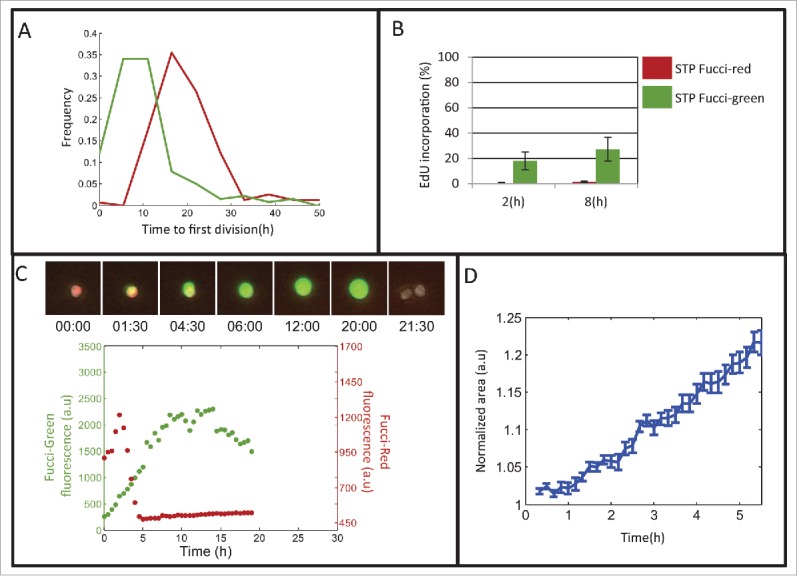
Characterization of the persistent subpopulation reveals a non-quiescent state. (A) Distribution of the time to first division of Fucci-red and Fucci-green subpopulations. The Kolmogorov-Smirnov test shows significant difference between the STP duration distributions (time till first division), p < 9e-028. (B) EdU incorporation of the Fucci subpopulations is measured over time. Mean of 2 replicates presented. Error bars: SE. (C) Representative Fucci traces of a STP Fucci-red cell in time-lapse microscopy. (D) Mean of the normalized area increase of STP Fucci-red cells (N = 112). Error bars represent SE.
Characterization of the persistent subpopulation reveals a non-quiescent state
Our results suggest that STP Fucci-red cells are protected from the lethal effect of cell-phase specific drugs as long as they do not progress to the S phase. One may conclude that these persistent cells are in a quiescent state. However, direct observation of the Fucci markers of STP cells reveals a dynamic state in terms of protein production and/or degradation already 2 hours after dilution (Fig. 7C and Fig. S6), unlike quiescent Fucci cells, which have high red fluorescence and show no green signal.66 Moreover, monitoring the size of the cells for the first few hours after exiting from the stationary phase shows that the cells increase in size (Fig. 7D). Thus, STP Fucci-red cells linger in a protective non-quiescent G1-phase that delays DNA synthesis by many hours, but does not delay cellular growth.
Surprisingly, this STP-duration cannot fully explain the much higher survival rate of the Fucci-red subpopulation, since 18 hours following stationary-release the Fucci-red and green subpopulations seem to have similar percentages of cells progressing through S. This was evident from an 18 hour long EdU exposure upon release from the stationary state, which revealed very similar incorporation rates for STP Fucci-red and green subpopulations (Fig. S7a). This result is puzzling and suggests that many of the STP Fucci-red cells exit G1 before the drug is washed away, unless the drug itself modifies the cell-cycle dynamics. In order to detect the effect of AraC on the progression of the cell-cycle in STP cells, we measured EdU incorporation in the presence of AraC. We detect no EdU incorporation, even after 18 hours of incubation (Fig. 8A). It should be mentioned that the EdU incorporation was similarly low for the STP Fucci-green subpopulation (Fig. S7b), suggesting that DNA synthesis inhibition by AraC occurs in both subpopulations, but only the Fucci-red subpopulation is protected. In agreement with the drug-induced delay in DNA synthesis, we also noticed that the total STP duration of treated cells is lengthened by about 20 hours compared to untreated controls (Fig. 8B), as confirmed by direct observations in microfluidic devices. STP elongation due to drug treatment was observed for the STP population exposed to AraC or Vincristine. This general effect of drugs on the cell-cycle dynamics may impact subsequent drug treatments.
Figure 8.
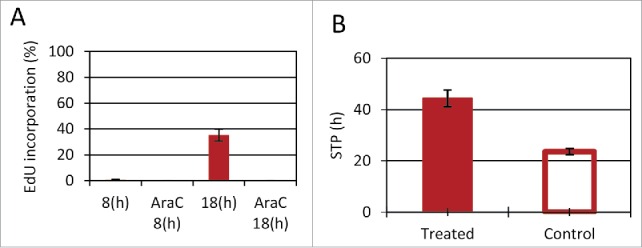
Cell cycle elongation following treatment. (A) Stationary Fucci-red cells were suspended in fresh media with EdU, with and without AraC (1 µg/ml). Samples were collected 8 and 18 hours after resuspension. (B) STP duration was determined for cells in microfluidic devices, either exposed to drugs (AraC or Vincristine) or untreated. STP duration was determined by time to first division. (one-tail Wilcoxon rank sum test p < 0.05). (A–B) Mean of 2 and 6 replicates, respectively presented. Error bars: SE.
Discussion
Our work focused on the effect of chemotherapy on cells during the transition from stationary conditions to the proliferative state. We found that this special transition state, called STP, has a protective effect that diminishes drug efficacy. Similarly to the CSC hypothesis, which poses a challenging new appraisal of cell behavior that necessitates radical rethinking of treatment protocols, the possibility that STP cells are present in tumors may also need to be addressed when designing treatment regimens.
The re-entrance of resting cells into the cell-cycle has been studied in the context of G0 characterization, using non-dividing cultures (by contact inhibition, serum starvation etc.) released from cell cycle arrest by exposure to a new environment that supports exponential growth.50,68 The term “restriction-point” was coined for the point in the cell-cycle in which cells commit to complete replication. The classical view holds that cells prior to the restriction point can exit the cell cycle into G0 and, renter the cell cycle again from G0 into G1 when conditions favor replication.68 This view has been challenged. Copper suggested a model stating that there is no specific “checkpoint” for cell-cycle arrest;19 rather, he claims that cells are arrested somewhere in G1 and, following exposure to growth conditions, resume the cell cycle from the point in G1 at which they were arrested.19 Furthermore, recent experimental results from S.cerevisiae showed that cells entered quiescence from all phases of the cell cycle in a reversible manner.43
In this work, we characterized the cell-cycle distribution of stationary cells. Though some G1-enrichement was evident, this distribution was found to be surprisingly similar to the cell-cycle distribution of exponential cells (Fig. 4). The high abundance of stationary cells in non-G1 phases could be linked to their cancerous nature. Indeed, stationary cancerous cells have been shown to lie in different cell-cycle phases.22,51,54
Solid tumors have long been viewed as heterogeneous tissues containing a variety of niches, some presenting hypoxic and nutrient shortage conditions. Lately, it has also been suggested that hypoxic conditions occur within the bone-marrow,17 with further reduction of oxygenation in leukemia (Jensen et al., 2000; Thing Mortensen et al., 1998). Such stressful environments increase the variability of cell response to drugs. For example, it was suggested that hypoxic conditions not only sustain haematopoietic stem cells, but also preserve leukemia stem cells, resistant to Imatinib,28 emphasizing the variability of differentiation states. Moreover, the bone marrow was suggested to act as a sanctuary for leukemic cell, promoting drug resistance.3
Models of cyclotherapy and repopulation of cancer cells during therapy are especially relevant to our work. Cyclotherapy strives to minimize cytotoxicity of normal cells to treatment by selectively inducing cell cycle arrest using cytostatic drugs. Thus cancer cells that do not respond to such cytostatic drugs will be targeted, while the blocked normal cells are shielded (reviewed in refs. 11, 44). Thus, pharmacological manipulations controlling the transition between cycling and non-cycling subpopulations in combination with classic phase/cell-cycle specific chemotherapy is already explored as a treatment strategy.9,45
Repopulation is the process in which cells continue proliferation following treatment. The intervals between treatments, which are scheduled to allow recovery of the normal tissue, also allow the repopulation of surviving cancer cells (reviewed in ref. 40). This phenomenon was studied mainly in the context of radiotherapy, but has also been examined for chemotherapy. In both cases, the paradigm states that cells lying proximal to blood vessels die following treatment and are removed. Consequently, cells which were located far from blood vessels are better supplied with oxygen and nutrients, such that spontaneous cell death occurs less, while proliferation is enhanced (reviewed in ref. 40). Thus, cells in the cancerous environment may encounter conditions in which they transit from the stationary state to proliferation, i.e., reside in STP. We showed in vitro that STP cells require many hours to re-enter the cell-cycle and to divide. Furthermore, we showed that exposure to drugs during this period may extend the STP duration even more. The sensitivity to phase-specific drugs in the STP duration was shown here to be significantly diminished. Thus, during STP, a subpopulation of cells may not be susceptible to many of the drugs used and this may undermine treatment. It seems that some protocols have been tuned empirically to help targeting STP cells. One way is to block their exit from the stationary state by the addition of molecular-targeted cytostatic agents between courses of chemotherapy cytotoxic treatments.40 Other studies focus on activating dormant cells to enter the cell cycle, thus making them more susceptible to treatment (reviewed in ref. 24). The suggested strategy used a 2-step protocol involving priming of the dormant cells (using G-CSF, arsenic or INFα) to enter the active cell cycle, followed by chemotherapy. Other possible directions to eliminate the STP population could use different schedules, such as targeting these cells after they completed the STP duration, or exposure to ‘non cell-cycle specific’ drugs, which we demonstrated here to be as potent against the persistent subpopulation.
Using the Fucci cell-cycle markers to follow the fates of single STP cell following treatment, as has been done previously with exponential cells,48,49 we characterized 2 subpopulations showing different survival rates following treatment. The findings resemble the phenomena of bacterial Type-I persistence (or persistence by lag),5,13 where a subpopulation exits the stationary state on a much longer time scale than is found with the majority of the population. These persister bacteria were shown to survive many different stresses, such as antibiotics,5,8 and prophage induction.52 Strikingly, the existence of bacterial persisters is believed to cause re-infection, especially when the immune-system cannot target them, for example, in immune-compromised patients and in specific niches such as biofilms etc.46 These studies have shed a new light on the way bacteria respond to antibiotics and have already triggered the search for drugs specifically designed to fight these quiescent bacteria.2 Similarly, drugs that target quiescent cells (such as cancer stem cells20) should be considered when targeting the STP population. Similarly to bacteria, cancerous mammalian cell lines have been followed during and after long-term exposure to drugs and were shown to harbor “drug tolerant persisters” which survive the long exposures and divide following drug removal.62 Such transient subpopulations, which show different cell-cycle dynamics and survive better under drugs, have been found in melanoma,57 in a model of glioblastoma16 and in leukemia, where a small subpopulation was found to highly express MDR, thus being less susceptible to Vincristine.53 However, both high and low expressing MDR subpopulations could reestablish the MDR expression of the initial population, suggesting that tolerance is due to epigenetic factors.53 Moreover, the appearance and loss of a drug-resistant cancer stem–like subpopulation was shown to be highly dynamic, and it was implied that the stem-like cells might originate from the bulk population even without treatment.31 Similarly, our work has shown that survival under chemotherapy is due to a subpopulation of cells which are not genetically different from the killed fraction. We have further characterized this subpopulation and found it to be protected by a transient STP duration acquired from the previous starvation conditions. Interestingly, we found that a non phase-specific drug can abolish the survival advantage of the STP. However, this STP duration was not associated with general quiescence in our cells, as expected from the CSC hypothesis, suggesting that other pathways may be targeted in these cells. Further work is necessary in order to better characterize the physiological state of this surviving subpopulation.
Materials and methods
Cell line, mediaand growth conditions
L1210 Fucci cell line was constructed as described in.60
Liebovitz's L-15 medium (Biological Industries) was supplemented with 0.2% dextrose, 100 U/ml penicillin, 100 μg/ml streptomycin, 100 μM sodium pyruvate, 300 μg/ml L-glutamine and 20% Fetal Calf Serum (FCS). The buffering in L-15 medium allows cell growth and pH maintenance without a CO2 atmosphere.
The growth of each culture began by seeding cells at a concentration of 2 * 104 cells/ml. Typically, exponentially growing cells were taken for experiments after 2 d of growth at a density of ∼3–6 * 105 cells/ml. Stationary cells were taken 1 week after seeding. The culture typically reached a count of 1–5 * 106 cells/ml and stayed at this concentration for ∼2–3 d. For STP cells, a stationary culture was diluted into fresh medium.
Time-lapse microscopy
A polydimethylsiloxane (PDMS) (Sylgard 184, Dow Corning) square frame mold was placed on a microscope slide. The cells (either exponentially growing or stationary) were diluted into fresh (or conditioned) medium to a concentration of (104–105 cells/ml). The diluted cells were placed in the PDMS square and sealed with a coverslip. Alternatively, cells were introduced in microfluidic devices and placed under a constant flow of pre-conditioned medium. Cells were monitored using an automated microscope system comprising of a Leica DMIRBE inverted microscope system with incubator box (LIS), automated stage, and shutters. Images were acquired using a 10× or 20× long-range air objective and a cooled charge-coupled device (CCD) camera (Orca; Hamamatsu). Hardware was controlled by the Micro-Manager platform.23 Fluorescence images were acquired with minimal excitation to minimize bleaching and photodamage. Cells exposed to 1/10 of the integrated illumination did not show measurable growth difference. The Fucci reporters were monitored by microscopy using HQ480/20ex & HQ510/20em, and HQ456/11ex & HQ585/40em (Chroma, USA) for the mAG (green) and mKO2 (red), respectively. Excitation was performed with stabilized LEDs system (Coolled, UK).
The movies were tracked semi-automatically for supervised analysis using a plug-in that we developed for ImageJ (http://rsbweb.nih.gov/ij/).
Measuring STP duration and survival rate in microfluidic devices under changing environments
We designed and fabricated microfluidic devices which allow us to follow the lag phase duration and survival of stationary cells following transition to fresh media with transient exposure to drugs. Based on our previous devices,26 which consist of several layers clamped together. Briefly,
Thin patterned PDMS layer with microwells: a mold was done using photolithography on silicon wafers as previously described26 resulting in a pattern of microwells (100 µm depth and 450 µm diameter).
The cured PDMS layer was separated from the wafer and exposed for 20s to air plasma (Harrick plasma oven).
A PET transparent membrane (6 well millicell 1 µm PET. Millipore CAT #PIR30R48) was separated from the plastic hang and cut to the device dimensions.
Flow channel: A thick PDMS was patterned with a single “Snake like” channel pattern (100 µm depth 400 µm wide).
Both patterns were created using a mold made of SU-8 photoresist (MicroChemCorp., MA) on silicon wafers. Photomasks were designed on Gimp and printed on transparencies at 5080 dpi (Pageworks). The patterned wafers were treated with HMDS. The PDMS (Sylgard 184, Dow Corning) was mixed in a ratio of 10:1 part A to part B. The mixture was poured on the wafer and cured overnight at 80°C.
The cells to be observed were trapped in the microwells of the lower patterned PDMS layer. The supernatant of exponentially growing cells, supplemented with 10% FCS, was constantly flown in the upper PDMS layer of single channel, such that nutrients can diffuse through the membrane to the trapped cells, without disturbing their position. This device was placed under the microscope, and single cells were tracked while being constantly exposed to the flown medium. Typically, the initial flown medium was supplemented with drug for 18/24 hours, and then it was replaced with fresh medium without drug to allow the growth of surviving cells.
The “Mammalian Mother Machine” microfluidic device
We designed and fabricated another type of microfluidics device, based on the design of the bacterial “mother machine”.67 We used a SU-8 photoresist (MicroChem Corp.) on silicon wafers to make the master mold in 2 steps (the first layer for the growth channels and the second layer for the main channel), and PDMS (Sylgard 184, Dow Corning), to make the devices. The dimensions of the growth channels are 20–100 µm (L) × 10–12 µm (W) × 10–12 µm (D), which are connected to a main channel of varying length and width.
Photomasks were printed on low reflective chrome coated soda lime glass (JD Photo-Tools). Patterning on Si wafers was done according to the standard SU-8 protocol. The patterned wafers were treated with HMDS. The PDMS was mixed according 10:1 part A to B. The mixture was poured onto the wafer and cured for several hours at 80°C.
The cells to be observed were concentrated (∼5*1e7 cells/ml), and ∼20 µl were injected to the main channel. Some cells entered the growth channels and the rest were washed out of the device. The medium in the flow channels was the supernatant of exponentially growing cells, supplemented with 10% fetal calf serum and Gentamycin (25 µg/ml). Medium was constantly flowing in the main channel using a syringe pump at a flow rate of 0.004 ml/min resulting in continuous washing of the device about once per second. The device was placed under the microscope (see Time-lapse microcopy) and single cells were tracked while being constantly exposed to the flowing medium. Medium could be switched from drug-containing to drug free in order to follow the response during and after treatment very rapidly. This device allowed us to track the same cells for up to 20 divisions (see supplementary video and Fig. S1)
Killing assays
Cells taken from different conditions (stationary, exponential, sorted etc- as indicated in the main text), were exposed to drugs (AraC at 1 μg/ml, Vincristine at 10 ng/ml, BCNU at 2.5 ug/ml) for the indicated times (typically, 18/24 hr), and kept at 37°C. The cells were then washed twice with PBS. Then, cells were resuspended in fresh media to ∼5–20*1e4 cells/ml and monitored by time-lapse microscopy for several days. Cells identified as survivors are those which were exposed to the drug and produced at least one granddaughter (i.e divided twice after drug wash).
Flow cytometry associated cell sorting
Cells were centrifuged (8 min, 340rcf, 11°C) supernatant was discarded and cells were resuspended in medium with 2% FCS at ∼5*106 cells/ml. For cell cycle analysis cells were incubated with Hoechst 33342 (Sigma B2261) at 5 ug/ml in the dark for 60 min at 37°C. To sort out dead cells, cells were stained with 7aad (eBioscience cat# 00–6993, 5 µl/ml). Cells were sorted/analyzed using a FACS Aria III (Becton-Dickinson) equipped with 405, 488, 561 and 633 nM lasers. Sorting was carried with a 70 um nozzle, cells were gated to 7aad low, FSC and SSC to eliminate dead cells. Subpopulation were collected according to mKO2 (Fucci red)/mAG (Fucci green)-high. Data were acquired using DiVa software and analyzed with MATLAB.
DNA incorporation assay
We have used EdU click-iT Flow Cytometry assay to label cells which synthesize DNA.59 Cells were sorted according to the viability marker 7aad, and to Fucci-red and Fucci-green subpopulation as indicated, pelleted, resuspended in fresh media containing EdU, and incubated for various time periods. Samples were permeabilized and fixed according to the assay protocol (Click-iT® EdU Alexa Fluor® 647 Flow Cytometry Assay Kit cat # C10424), then resuspended in PBS at 4C until all samples were ready to continue labeling and detection using FACS.
Measuring the STP duration of cells exposed to drugs
Measuring STP duration of cells, exposed to drug and washes is feasible using microfluidics devices (see above). The STP duration was defined as the time till first division.
FUCCI markers phenomenological model
We formulated a phenomenological model that, despite several over simplifications, captures the main features of the cells fluorescence dynamics (Fig. 5B, C).
When R is the Red protein (mKO2-hCdt1) level, G the green protein (mAG-hGem) levels, S the SCFskp2 levels and APC is APCcdh1 levels. The α1-3 represent protein production rates, δ0 is the background degradation rate, while δ1-3 denote active degradation rates. The Fucci proteins oscillate reciprocally during the cell cycle since the SCFSkp2 and APCCdh1 complexes are inhibiting each other. For simplicity we model APCCdh1 activity as a step function, rising sharply to a fixed value at the end of mitosis and falling quickly to a background level at the G1/S transition (Eq. 4). Active APCCdh1 degrades both SCFSkp2 and green fluorescent protein (Eqs. 2 and 3), while the SCFSkp2 complex degrades the red protein (Eq. 1).58 According to these assumptions, the peak of the red fluorescence occurs at the time APCCdh1 drops to the background level. At the same time, green fluorescence should begin to rise. We refer to this point as the end of G1. Representative cell showing both fluorescence levels is displayed in Figure 5B.
When degradation is inhibited, both markers levels rise together—a phenotype seen in many STP cells, at the initial hours following dilution (Fig. S5). It is reasonable to conclude that at initial stages of release from long stationary state the Ubiquitin-dependent protein degradation system is not fully operational.21
Supplementary Material
Abbreviations
- AraC
arabinofuranosyl cytidine (cytarabine)
- BCNU
bis-chloroethylnitrosourea (Carmustine)
- CSC
cancer stem cells
- Fucci
Fluorescence Ubiquitin Cell Cycle Indicator
- STP
stationary to proliferative
Disclosure of potential conflicts of interest
No potential conflicts of interest were disclosed.
Acknowledgments
We thank Oded Sandler for the L1210 Fucci cell line, Bill Breuer for flow cytometry support, Michael Brandeis, Noam Shoresh, Eli Pikarsky, Neta Goldschmit, Abraham Hochberg and Irine Ronin for illuminating discussions.
Funding
We acknowledge support from the ERC (#681819) and ISF (#492/15).
References
- [1].Aguirre-Ghiso JA. Models, mechanisms and clinical evidence for cancer dormancy. Nat Rev Cancer 2007; 7:834-46; PMID:17957189 [DOI] [PMC free article] [PubMed] [Google Scholar]
- [2].Allison KR, Brynildsen MP, Collins JJ. Metabolite-enabled eradication of bacterial persisters by aminoglycosides. Nature 2011; 473:216-20; PMID:21562562; http://dx.doi.org/ 10.1038/nature10069 [DOI] [PMC free article] [PubMed] [Google Scholar]
- [3].Ayala F, Dewar R, Kieran M, Kalluri R. Contribution of bone microenvironment to leukemogenesis and leukemia progression. Leukemia 2009; 23:2233-41; PMID:19727127; http://dx.doi.org/ 10.1038/leu.2009.175 [DOI] [PMC free article] [PubMed] [Google Scholar]
- [4].Balaban N. Persistence: mechanisms for triggering and enhancing phenotypic variability. Curr Opin Genet Dev 2011; 21:768-75; PMID:22051606; http://dx.doi.org/ 10.1016/j.gde.2011.10.001 [DOI] [PubMed] [Google Scholar]
- [5].Balaban NQ, Merrin J, Chait R, Kowalik L, Leibler S. Bacterial Persistence as a Phenotypic Switch. Science 2004; 305:1622-5; PMID:15308767; http://dx.doi.org/ 10.1126/science.1099390 [DOI] [PubMed] [Google Scholar]
- [6].Bhuyan BK, Scheidt LG, Fraser TJ. Cell cycle phase specificity of antitumor agents. Cancer Res 1972; 32:398-407; PMID:4258018 [PubMed] [Google Scholar]
- [7].Bhuyan BK, Fraser TJ, Day KJ. Cell proliferation kinetics and drug sensitivity of exponential and stationary populations of cultured L1210 cells. Cancer Res 1977; 37:1057-63; PMID:139202 [PubMed] [Google Scholar]
- [8].Bigger J. Treatment of staphylococcal infections with penicillin by intermittent sterilisation. The Lancet 1944; 244:497-500; http://dx.doi.org/ 10.1016/S0140-6736(00)74210-3 [DOI] [Google Scholar]
- [9].Blagosklonny MV. Sequential activation and inactivation of G2 checkpoints for selective killing of p53-deficient cells by microtubule-active drugs. Oncogene 2002; 21:6249-54; PMID:12214265; http://dx.doi.org/ 10.1038/sj.onc.1205793 [DOI] [PubMed] [Google Scholar]
- [10].Blagosklonny MV. Target for cancer therapy: proliferating cells or stem cells. Leukemia 2006; 20:385-91; PMID:16357832; http://dx.doi.org/ 10.1038/sj.leu.2404075 [DOI] [PubMed] [Google Scholar]
- [11].Blagosklonny MV, Pardee AB. Exploiting cancer cell cycling for selective protection of normal cells. Cancer Res 2001; 61:4301-5; PMID:11389048 [PubMed] [Google Scholar]
- [12].Bonnet D. Normal and leukaemic stem cells. Br J Haematol 2005; 130:469-79; PMID:16098060; http://dx.doi.org/ 10.1111/j.1365-2141.2005.05596.x [DOI] [PubMed] [Google Scholar]
- [13].Brauner A, Fridman O, Gefen O, Balaban NQ. Distinguishing between resistance, tolerance and persistence to antibiotic treatment. Nat Rev Microbiol 2016; 14:320-30; PMID:27080241; http://dx.doi.org/ 10.1038/nrmicro.2016.34 [DOI] [PubMed] [Google Scholar]
- [14].Brock A, Chang H, Huang S. Non-genetic heterogeneity — a mutation-independent driving force for the somatic evolution of tumours. Nat Rev Genet 2009; 10:336-42; PMID:19337290; http://dx.doi.org/ 10.1038/nrg2556 [DOI] [PubMed] [Google Scholar]
- [15].Cara S, Tannock IF. Retreatment of patients with the same chemotherapy: implications for clinical mechanisms of drug resistance. Ann Oncol 2001; 12:23-7; PMID:11249045; http://dx.doi.org/ 10.1023/A:1008389706725 [DOI] [PubMed] [Google Scholar]
- [16].Chen J, Li Y, Yu T-S, McKay RM, Burns DK, Kernie SG, Parada LF. A restricted cell population propagates glioblastoma growth after chemotherapy. Nature 2012; 488:522-6; PMID:22854781; http://dx.doi.org/ 10.1038/nature11287 [DOI] [PMC free article] [PubMed] [Google Scholar]
- [17].Cipolleschi MG, Sbarba PD, Olivotto M. The role of hypoxia in the maintenance of hematopoietic stem cells. Blood 1993; 82:2031-7; PMID:8104535 [PubMed] [Google Scholar]
- [18].Cohen AA, Geva-Zatorsky N, Eden E, Frenkel-Morgenstern M, Issaeva I, Sigal A, Milo R, Cohen-Saidon C, Liron Y, Kam Z, et al.. Dynamic proteomics of individual cancer cells in response to a drug. Science 2008; 322:1511-6; PMID:19023046; http://dx.doi.org/ 10.1126/science.1160165 [DOI] [PubMed] [Google Scholar]
- [19].Cooper S. Rethinking synchronization of mammalian cells for cell cycle analysis. Cell Mol Life Sci CMLS 2003; 60:1099-106. [DOI] [PMC free article] [PubMed] [Google Scholar]
- [20].Dalerba P, Cho RW, Clarke MF. Cancer stem cells: models and concepts. Annu Rev Med 2007; 58:267-84; PMID:17002552; http://dx.doi.org/ 10.1146/annurev.med.58.062105.204854 [DOI] [PubMed] [Google Scholar]
- [21].De Virgilio C. The essence of yeast quiescence. Fems Microbiol Rev 2012; 36:306-39; PMID:21658086; http://dx.doi.org/ 10.1111/j.1574-6976.2011.00287.x [DOI] [PubMed] [Google Scholar]
- [22].Drewinko B, Yang LY, Barlogie B, Trujillo JM. Cultured human tumour cells may be arrested in all stages of the cycle during stationary phase: demonstration of quiescent cells in G1, S and G2 phase. Cell Prolif 1984; 17:453-63; PMID:6467330; http://dx.doi.org/ 10.1111/j.1365-2184.1984.tb00604.x [DOI] [PubMed] [Google Scholar]
- [23].Edelstein AD, Tsuchida MA, Amodaj N, Pinkard H, Vale RD, Stuurman N. Advanced methods of microscope control using μManager software. J Biol Methods 2014; 1:e10; PMID:25606571; http://dx.doi.org/ 10.14440/jbm.2014.36 [DOI] [PMC free article] [PubMed] [Google Scholar]
- [24].Essers MAG, Trumpp A. Targeting leukemic stem cells by breaking their dormancy. Mol Oncol 2010; 4:443-50; PMID:20599449; http://dx.doi.org/ 10.1016/j.molonc.2010.06.001 [DOI] [PMC free article] [PubMed] [Google Scholar]
- [25].Gascoigne KE, Taylor SS. Cancer cells display profound intra- and interline variation following prolonged exposure to antimitotic drugs. Cancer Cell 2008; 14:111-22; PMID:18656424; http://dx.doi.org/ 10.1016/j.ccr.2008.07.002 [DOI] [PubMed] [Google Scholar]
- [26].Gefen O, Gabay C, Mumcuoglu M, Engel G, Balaban NQ. Single-cell protein induction dynamics reveals a period of vulnerability to antibiotics in persister bacteria. Proc Natl Acad Sci 2008; 105:6145-9; PMID:18427112; http://dx.doi.org/ 10.1073/pnas.0711712105 [DOI] [PMC free article] [PubMed] [Google Scholar]
- [27].Gerlinger M, Swanton C. How Darwinian models inform therapeutic failure initiated by clonal heterogeneity in cancer medicine. Br J Cancer 2010; 103:1139-43; PMID:20877357; http://dx.doi.org/ 10.1038/sj.bjc.6605912 [DOI] [PMC free article] [PubMed] [Google Scholar]
- [28].Giuntoli S, Rovida E, Barbetti V, Cipolleschi MG, Olivotto M, Sbarba PD. Hypoxia suppresses BCR/Abl and selects imatinib-insensitive progenitors within clonal CML populations. Leukemia 2006; 20:1291-3; PMID:16710305; http://dx.doi.org/ 10.1038/sj.leu.2404224 [DOI] [PubMed] [Google Scholar]
- [29].Graham FL, Whitmore GF. The effect of 1-β-d-arabinofuranosylcytosine on growth, viability, and DNA synthesis of mouse L-cells. Cancer Res 1970; 30:2627-35; PMID:5530557 [PubMed] [Google Scholar]
- [30].Guan Y, Gerhard B, Hogge DE. Detection, isolation, and stimulation of quiescent primitive leukemic progenitor cells from patients with acute myeloid leukemia (AML). Blood 2003; 101:3142-9; PMID:12468427; http://dx.doi.org/ 10.1182/blood-2002-10-3062 [DOI] [PubMed] [Google Scholar]
- [31].He K, Xu T, Goldkorn A. Cancer cells cyclically lose and regain drug-resistant highly tumorigenic features characteristic of a cancer stem-like phenotype. Mol Cancer Ther 2011; 10:938-48; PMID:21518726; http://dx.doi.org/ 10.1158/1535-7163.MCT-10-1120 [DOI] [PMC free article] [PubMed] [Google Scholar]
- [32].Heppner GH. Tumor heterogeneity. Cancer Res 1984; 44:2259-65; PMID:6372991 [PubMed] [Google Scholar]
- [33].Hill BT, Baserga R. The cell cycle and its significance for cancer treatment. Cancer Treat Rev 1975; 2:159-75; PMID:1104161; http://dx.doi.org/ 10.1016/S0305-7372(75)80001-6 [DOI] [PubMed] [Google Scholar]
- [34].Hill BT, Price LA. Letter: kinetic classifications of antitumour drugs. Br Med J 1975; 3:367-7; PMID:1156762; http://dx.doi.org/ 10.1136/bmj.3.5979.367 [DOI] [PMC free article] [PubMed] [Google Scholar]
- [35].Hoffman RM. In vitro sensitivity assays in cancer: A review, analysis, and prognosis. J Clin Lab Anal 1991; 5:133-43; PMID:2023059; http://dx.doi.org/ 10.1002/jcla.1860050211 [DOI] [PubMed] [Google Scholar]
- [36].Holyoake T, Jiang X, Eaves C, Eaves A. Isolation of a highly quiescent subpopulation of primitive leukemic cells in chronic myeloid leukemia. Blood 1999; 94:2056-64; PMID:10477735 [PubMed] [Google Scholar]
- [37].Jordan CT, Guzman ML, Noble M. Cancer stem cells. N Engl J Med 2006; 355:1253-61; PMID:16990388; http://dx.doi.org/ 10.1056/NEJMra061808 [DOI] [PubMed] [Google Scholar]
- [38].Jensen P, Mortensen BT, Hodgkiss RJ, Iversen PO, Christensen IJ, Helledie N, and Larsen JK. Increased cellular hypoxia and reduced proliferation of both normal and leukaemic cells during progression of acute myeloid leukaemia in rats. Cell Prolif 2000; 33:381–395. [DOI] [PMC free article] [PubMed] [Google Scholar]
- [39].Kepp O, Galluzzi L, Lipinski M, Yuan J, Kroemer G. Cell death assays for drug discovery. Nat Rev Drug Discov 2011; 10:221-37; PMID:21358741; http://dx.doi.org/ 10.1038/nrd3373 [DOI] [PubMed] [Google Scholar]
- [40].Kim JJ, Tannock IF. Repopulation of cancer cells during therapy: an important cause of treatment failure. Nat Rev Cancer 2005; 5:516-25; PMID:15965493; http://dx.doi.org/ 10.1038/nrc1650 [DOI] [PubMed] [Google Scholar]
- [41].Kurtova AV, Xiao J, Mo Q, Pazhanisamy S, Krasnow R, Lerner SP, Chen F, Roh TT, Lay E, Ho PL, et al.. Blocking PGE2-induced tumour repopulation abrogates bladder cancer chemoresistance. Nature 2015; 517:209-13; PMID:25470039; http://dx.doi.org/ 10.1038/nature14034 [DOI] [PMC free article] [PubMed] [Google Scholar]
- [42].Laconi E. The evolving concept of tumor microenvironments. BioEssays 2007; 29:738-44; PMID:17621638; http://dx.doi.org/ 10.1002/bies.20606 [DOI] [PubMed] [Google Scholar]
- [43].Laporte D, Lebaudy A, Sahin A, Pinson B, Ceschin J, Daignan-Fornier B, Sagot I. Metabolic status rather than cell cycle signals control quiescence entry and exit. J Cell Biol 2011; 192:949-57; PMID:21402786; http://dx.doi.org/ 10.1083/jcb.201009028 [DOI] [PMC free article] [PubMed] [Google Scholar]
- [44].van Leeuwen IMM. Cyclotherapy: opening a therapeutic window in cancer treatment. Oncotarget 2012; 3:596-600; PMID:22711025; http://dx.doi.org/ 10.18632/oncotarget.524 [DOI] [PMC free article] [PubMed] [Google Scholar]
- [45].van Leeuwen IMM, Rao B, Sachweh MCC, Laín S. An evaluation of small-molecule p53 activators as chemoprotectants ameliorating adverse effects of anticancer drugs in normal cells. Cell Cycle Georget Tex 2012; 11:1851-61. [DOI] [PMC free article] [PubMed] [Google Scholar]
- [46].Lewis K. Persister cells. Annu Rev Microbiol 2010; 64:357-72; PMID:20528688; http://dx.doi.org/ 10.1146/annurev.micro.112408.134306 [DOI] [PubMed] [Google Scholar]
- [47].Madoc-Jones H, Mauro F. Interphase action of vinblastine and vincristine: differences in their lethal action through the mitotic cycle of cultured mammalian cells. J Cell Physiol 1968; 72:185-95; PMID:5724569; http://dx.doi.org/ 10.1002/jcp.1040720306 [DOI] [PubMed] [Google Scholar]
- [48].Miwa S, Yano S, Kimura H, Yamamoto M, Toneri M, Matsumoto Y, Uehara F, Hiroshima Y, Murakami T, Hayashi K, et al.. Cell-cycle fate-monitoring distinguishes individual chemosensitive and chemoresistant cancer cells in drug-treated heterogeneous populations demonstrated by real-time FUCCI imaging. Cell Cycle 2014; 14:621-9; http://dx.doi.org/ 10.4161/15384101.2014.991604 [DOI] [PMC free article] [PubMed] [Google Scholar]
- [49].Miwa S, Yano S, Kimura H, Yamamoto M, Toneri M, Murakami T, Hayashi K, Yamamoto N, Fujiwara T, Tsuchiya H, et al.. Heterogeneous cell-cycle behavior in response to UVB irradiation by a population of single cancer cells visualized by time-lapse FUCCI imaging. Cell Cycle Georget Tex 2015; 14:1932-7; http://dx.doi.org/ 10.1080/15384101.2015.1033598 [DOI] [PMC free article] [PubMed] [Google Scholar]
- [50].Pardee AB. A restriction point for control of normal animal cell proliferation. Proc Natl Acad Sci U S A 1974; 71:1286-90; PMID:4524638; http://dx.doi.org/ 10.1073/pnas.71.4.1286 [DOI] [PMC free article] [PubMed] [Google Scholar]
- [51].Pardee AB, James LJ. Selective killing of transformed baby hamster kidney (BHK) cells. Proc Natl Acad Sci U S A 1975; 72:4994-8; PMID:174089; http://dx.doi.org/ 10.1073/pnas.72.12.4994 [DOI] [PMC free article] [PubMed] [Google Scholar]
- [52].Pearl S, Gabay C, Kishony R, Oppenheim A, Balaban NQ. Nongenetic Individuality in the Host–Phage Interaction. PLoS Biol 2008; 6:e120; PMID:18494559; http://dx.doi.org/ 10.1371/journal.pbio.0060120 [DOI] [PMC free article] [PubMed] [Google Scholar]
- [53].Pisco AO, Brock A, Zhou J, Moor A, Mojtahedi M, Jackson D, Huang S. Non-Darwinian dynamics in therapy-induced cancer drug resistance. Nat Commun 2013; 4:2467. [DOI] [PMC free article] [PubMed] [Google Scholar]
- [54].Pollack R, Vogel A. Isolation and characterization of revertant cell lines. J Cell Physiol 1973; 82:93-100; PMID:4354072; http://dx.doi.org/ 10.1002/jcp.1040820111 [DOI] [PubMed] [Google Scholar]
- [55].Ravandi F, Estrov Z. Eradication of leukemia stem cells as a new goal of therapy in leukemia. Clin Cancer Res 2006; 12:340-4; PMID:16428470; http://dx.doi.org/ 10.1158/1078-0432.CCR-05-1879 [DOI] [PubMed] [Google Scholar]
- [56].Reya T, Morrison SJ, Clarke MF, Weissman IL. Stem cells, cancer, and cancer stem cells. Nature 2001; 414:105-11; PMID:11689955; http://dx.doi.org/ 10.1038/35102167 [DOI] [PubMed] [Google Scholar]
- [57].Roesch A, Fukunaga-Kalabis M, Schmidt EC, Zabierowski SE, Brafford PA, Vultur A, Basu D, Gimotty P, Vogt T, Herlyn M. A Temporarily distinct subpopulation of slow-cycling melanoma cells is required for continuous tumor growth. Cell 2010; 141:583-94; PMID:20478252; http://dx.doi.org/ 10.1016/j.cell.2010.04.020 [DOI] [PMC free article] [PubMed] [Google Scholar]
- [58].Sakaue-Sawano A, Kurokawa H, Morimura T, Hanyu A, Hama H, Osawa H, Kashiwagi S, Fukami K, Miyata T, Miyoshi H, et al.. Visualizing spatiotemporal dynamics of multicellular cell-cycle progression. Cell 2008; 132:487-98; PMID:18267078; http://dx.doi.org/ 10.1016/j.cell.2007.12.033 [DOI] [PubMed] [Google Scholar]
- [59].Salic A, Mitchison TJ. A chemical method for fast and sensitive detection of DNA synthesis in vivo. Proc Natl Acad Sci U S A 2008; 105:2415-20; PMID:18272492; http://dx.doi.org/ 10.1073/pnas.0712168105 [DOI] [PMC free article] [PubMed] [Google Scholar]
- [60].Sandler O, Mizrahi SP, Weiss N, Agam O, Simon I, Balaban NQ. Lineage correlations of single cell division time as a probe of cell-cycle dynamics. Nature 2015; 519:468-71; PMID:25762143; http://dx.doi.org/ 10.1038/nature14318 [DOI] [PubMed] [Google Scholar]
- [61].Shapiro GI, Harper JW. Anticancer drug targets: cell cycle and checkpoint control. J Clin Invest 1999; 104:1645-3; PMID:10606615; http://dx.doi.org/ 10.1172/JCI9054 [DOI] [PMC free article] [PubMed] [Google Scholar]
- [62].Sharma SV, Lee DY, Li B, Quinlan MP, Takahashi F, Maheswaran S, McDermott U, Azizian N, Zou L, Fischbach MA, et al.. A chromatin-mediated reversible drug-tolerant state in cancer cell subpopulations. Cell 2010; 141:69-80; PMID:20371346; http://dx.doi.org/ 10.1016/j.cell.2010.02.027 [DOI] [PMC free article] [PubMed] [Google Scholar]
- [63].Son S, Tzur A, Weng Y, Jorgensen P, Kim J, Kirschner MW, Manalis SR. Direct observation of mammalian cell growth and size regulation. Nat. Methods 2012; 9:910-2; PMID:22863882; http://dx.doi.org/ 10.1038/nmeth.2133 [DOI] [PMC free article] [PubMed] [Google Scholar]
- [64].Spencer SL, Gaudet S, Albeck JG, Burke JM, Sorger PK. Non-genetic origins of cell-to-cell variability in TRAIL-induced apoptosis. Nature 2009; 459:428–432. [DOI] [PMC free article] [PubMed] [Google Scholar]
- [65].Thing Mortensen Bø, Østrup Jensen P, Helledie N, Ole Iversen P, RalfkiÆR E, Knud Larsen Jø, Thorup Madsen M. Changing bone marrow micro-environment during development of acute myeloid leukaemia in rats. Br J Haematol 1998. 102:458–464. [DOI] [PubMed] [Google Scholar]
- [66].Tomura M, Sakaue-Sawano A, Mori Y, Takase-Utsugi M, Hata A, Ohtawa K, Kanagawa O, Miyawaki A. Contrasting quiescent G0 phase with mitotic cell cycling in the Mouse immune system. PLoS One 2013; 8:e73801; PMID:24066072; http://dx.doi.org/ 10.1371/journal.pone.0073801 [DOI] [PMC free article] [PubMed] [Google Scholar]
- [67].Wang P, Robert L, Pelletier J, Dang WL, Taddei F, Wright A, Jun S. Robust growth of Escherichia coli. Curr Biol CB 2010; 20:1099-103; http://dx.doi.org/ 10.1016/j.cub.2010.04.045 [DOI] [PMC free article] [PubMed] [Google Scholar]
- [68].Zetterberg A, Larsson O. Kinetic analysis of regulatory events in G1 leading to proliferation or quiescence of Swiss 3T3 cells. Proc Natl Acad Sci U S A 1985; 82:5365-9; PMID:3860868; http://dx.doi.org/ 10.1073/pnas.82.16.5365 [DOI] [PMC free article] [PubMed] [Google Scholar]
Associated Data
This section collects any data citations, data availability statements, or supplementary materials included in this article.