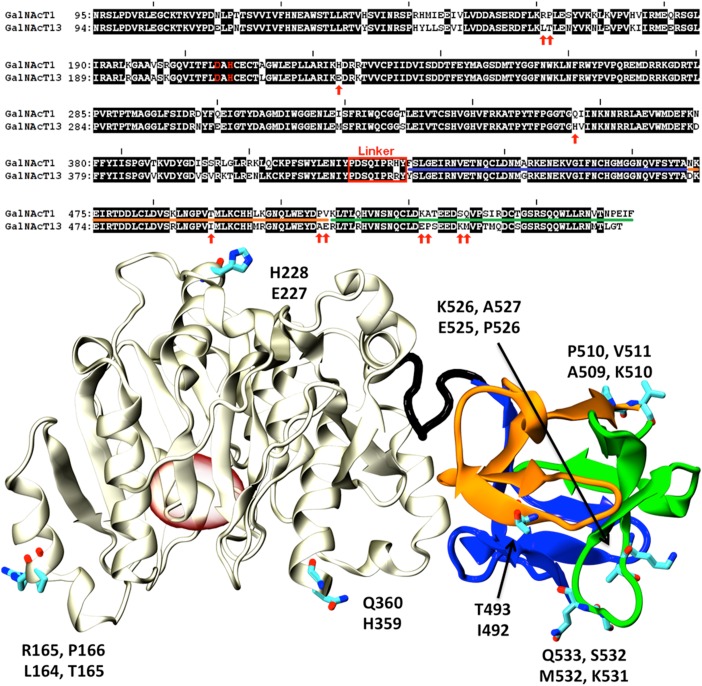
Fig. 5.
Comparison of GalNAc-T1 and T13. Top: Sequence alignment of GalNAc-T1 and T13. Non-identical residues are presented as black letters on a white background. Non-conservative substitutions are indicated with red arrows. The linker region connecting the catalytic and lectin domains is indicated with a red rectangle. The catalytic dyad is displayed in red letters. Underlined amino acids (AAs) indicate the α, β and γ subdomains (colors according to Figure 3). Bottom: Cartoon representation of the X-ray structure of GalNAcT-1 (PDB id:1XHB (Fritz et al. 2004)). The catalytic domain is shown in gray, while the α, β and γ lectin subdomains are colored as in Figure 3. AAs indicated with red arrows in the alignment are displayed as sticks and labeled (top and bottom residues correspond to T1 and T13, respectively). The position of the active site is indicated with a red oval for reference. This figure is available in black and white in print and in color at Glycobiology online.

