Abstract
Background
Obliterative bronchiolitis (OB) is a major obstacle to the success of lung transplantation and is also a serious complication of hematopopietic stem cell transplant. It has few therapeutic options and respiratory delivery of potential therapeutic drugs is hindered by the narrowed and occluded airways.
Methods
OB was induced in mice using an established protocol and lung function was assessed by plethysmograph. Mice were exposed to four different aerosols of aluminum phthalocyanine tetrasulfonic acid (AlPCS) that ranged in concentration and median particle size distribution (0.2–4.0 µm). The fluorescent intensity and number of pixels were measured for the trachea and lobes at two different compressional thicknesses. With analysis of the fluorescent intensity, the concentration and attenuation coefficient were estimated for each lobe and the trachea as well as individual pixels. The latter allowed generation of images reflective of the concentration.
Results
Lungs/trachea from OB mice had lower deposition, which correlated with lung function measurements, and apparent greater variability in the intensity compared to controls. The estimated lung volumes measured by plethysmograph were not different between the OB group and controls; however, total inflational lung capacity was reduced in OB mice.
Conclusions
Despite the variability in disease induction, there is a clear link between aerosol deposition and lung function, which was revealed by fluorescent imaging. The modulation of aerosol deposition in lungs with restrictive airway disease underscores the importance of tailoring aerosolization to optimize drug delivery.
Keywords: aerosol, aluminum phthalocyanine tetrasulfonic acid, bronchiolitis obliterans syndrome, fluorescent imaging, lungs
INTRODUCTION
Respiratory delivery is an effective means to achieve a high concentration of drug in the lungs. In asthma, this principle is applied to deliver bronchodilators and steroids to the airways to minimize systemic side effects. However, as the understanding of disease processes grows, there is a desire to have a better understanding of how airway disease affects the deposition of drugs within the lungs [1, 2].
In this work, we have examined a mouse model of bronchiolitis obliterans syndrome (BOS) for which the main histological finding is obliteration of the airways through scarring, also known as obliterative bronchiolitis (OB). OB is a fibrotic lung disease that occurs in humans after lung transplant as well as after hematopoietic stem cell transplant (HSCT) as a consequence of tissue injury and chronic allograft rejection [3–5]. HSCT is routinely given to approximately 15,000 patients per year in the United States, including those with hematological malignancies, immune deficiencies, and inborn errors of metabolism. BOS occurs in 5% to 25% of long-term allo-HSCT survivors [6–8] with only 15% survival of those BOS patients at 5 years [9, 10]. Lung transplantation is usually the only curative therapy for those patients with irreversible structural lung disease such as chronic obstructive pulmonary disease (COPD)/emphysema, idiopathic pulmonary fibrosis, primary pulmonary hypertension, α1-antitrypsin deficiency, and cystic fibrosis, but survival is only 50% at 5 years, mostly due to BOS [11, 12]. Prevention of BOS would be a significant step toward ameliorating morbidity and mortality in these patient populations.
In our recently developed mouse model, OB develops due to the combined effects of pretransplant conditioning and transplantation with allogeneic bone marrow with effector T cells [13]. In an effort to determine the effect of OB on respiratory delivery of potentially therapeutic drugs, the extent of deposition was determined with aerosols of varying particle size distributions. The distribution of a fluorescent probe, aluminum phthalocyanine tetrasulfonic acid (AlPCS), was determined among the mouse lobes of normal and diseased mice. Using an analytical approach to correct the fluorescent intensity for tissue attenuation [14, 15], the concentration of the fluorophore in each lobe was estimated from which it was established that diseased mice had lower deposition fractions, which correlated with lung function measurements. Extending the work, we examined the heterogeneity of the deposition by statistically analyzing the intensity within the left lobe. Consistent with the disease, a greater variability in the intensity was found in the diseased mice relative to the controls.
MATERIALS AND METHODS
Materials
Aluminum (III) phthalocyanine chloride tetrasulfonic acid was purchased from Frontier Scientific, Inc., Woburn, MA, USA. Cyclophosphamide (Cytoxan) was obtained from Bristol Myers Squibb, Seattle, WA, USA. Complement was purchased from Nieffenegger Co., Woodland, CA, USA. Water used in these experiments was deionized, distilled, and deoxygenated.
OB Induction
C57BL/6 (H2b) and BALB/c (H2d) mice were purchased from Jackson Laboratories (Bar Harbor, ME, USA).Mice were housed in microisolator cages in the specific pathogen-free (SPF) facility of the University of Minnesota and cared for according to the Research Animal Resources guidelines of our institution. Experiments were approved by the Institutional Animal Care and Use Committee of the University of Minnesota. For bone marrow transplant (BMT), BALB/c donors were 2–3 months of age and C57BL/6 recipients were 5 months of age.
The BMT protocol has been described previously [13]. Donor BALB/c BM was T-cell depleted with anti-Thy 1.2 monoclonal antibody (mAb) (clone 30-H-12, rat IgG2b; kindly provided by Dr. David Sachs, Charlestown, MA) plus complement. Recipient C57BL/6 mice received cyclophosphamide, 120 mg/kg per day intraperitoneally, as a conditioning regimen pre-BMT on Days −3 and −2. Allmice were lethally irradiated on the day before BMT (7.5 Gy total body irradiation) by X-ray (XRAD, PXI, North Branford, CT) at a dose rate of 1 Gy/minute. Recipient mice were transplanted via caudal vein with 15 × 106 T-cell–depleted allogeneic marrow with 2 × 10⁶ spleen cells as a source of allogeneic T cells (BMS group that develops OB).
Pulmonary Function Tests
Lung function was assessed by whole body plethysmography using the Flexivent system (Scireq, Montreal, QC, Canada) and Flexivent software version 5.1 was used. The Flexivent is calibrated for open-and closed-tube systems for each pulmonary test performed. Each mouse was anesthetized and allowed a brief period to acclimate to the ventilator. The maximum pressure was set at 30 cm H2O for pressure/volume (PV) analysis and determination of total lung capacity (TLC). The positive end-expiratory pressure remained constant at approximately 2.5 cm H2O.
Aerosol Generation
Deposition experiments were carried out by exposing control and treated mice to four aerosols that had different particle size distributions. To generate the aerosols, two different devices were used: a modified Medi-Nuclear (M-N) jet nebulizer (Powerscope, Minneapolis, MN, USA) and an Aeroneb nebulizer (Aerogen, Galway, Ireland and supplied for nonhuman use by Scireq, Montreal, QC, Canada) operating with and without a drying column [14, 15]. The aerosol was generated with an M-N jet nebulizer containing either a 10 mg/mL solution AlPCS or 10 mg/mL AlPCS and 100 mg/mL CsCl and was operated at 30 psi with a compressor. The mass output rate was determined by the filter capture method in which the aerosol concentration of AlPCS was determined by imaging the extracted solutions and interpolating the intensity from standard curves prepared from the intensity of extracted solutions obtained from spiked filters of a known mass of AlPCS [15]. The particle size distribution was measured with a scanning mobility particle sizer (SMPS) (TSI, Shoreview, MN, USA). The resulting number distribution was converted to a mass distribution assuming a density of 1 for the AlPCS solution and 4 g/mL for the solution containing CsCl [15].
To generate aerosols with a larger particle size distribution, an Aeroneb nebulizer (AN) was used. For one aerosol, the concentration of AlPCS solution was 2 mg/mL and the aerosol consisting of droplets was directed to the exposure area. For the second, a solution containing 2 mg/mL ALPCS and 18 mg/mL CsCl was used, and the aerosol was then passed through a silica drying column. The outputs were also determined by the filter capture method as mentioned earlier, but the size distribution was determined with an Intox low flow rate impactor operating at 0.5 LPM. The particle size distribution was determined by imaging the solution obtained from extracting the impactor plates.
For exposures, conscious mice were introduced into cylinders with a tapered end that opened into the aerosol stream. The other end was open, and the mouse was prevented from backing out by hand for the nose-only exposure of 1 minute. Short exposure times were used so that the distribution of the dye into the blood stream could be neglected. Mice were sacrificed by cervical dislocation immediately after aerosol exposure. The lung was severed at the carina, and the trachea and lung were removed and divided into lobes. The lobes were compressed between microscope slides and imaged as described previously [14] with a CRi Maestro system (CRi, Woburn, MA, USA). Briefly, images were obtained at two compression thicknesses using spacers, 0.1 or 0.09 and 0.072 cm, from the upright and inverted perspectives. A 649 nm excitation filter and 700 nm long-pass emission filter were used in the multispectral acquisition analysis of the images obtained at 730 nm.
Image Processing
Image-Pro Plus Version 6.3 was used to process the images, and a Gaussian filter was applied of strength 6 over an area of 9 by 9 pixels as previously described [15]. The total number of pixels and optical density (OD) in the area of interest (AOI) were measured and exported to Excel for further processing. Pixel dimensions were calibrated as described previously. The concentration of AlPCS in each lobe was estimated using the following function [14]:
where Te is the exposure time, A is the area in pixels, z is the compression thickness, K is the instrument/compound constant, C is the concentration, and μt is the attenuation coefficient (units of per cm). Images of standard solutions were taken each day to relate intensity to concentration of AlPCS, that is, measure the value of K. In this approach, the fundamental assumptions are that the fluorescent compound is uniformly distributed as a function of depth and the attenuation by the tissue is a linear function of depth.
Microscopy
In separate mice exposed to aerosols of AlPCS, lungs were embedded in OCT compound, frozen in liquid nitrogen, and stored at −80°C. Cryosections (6 µm) were acetone-fixed (5 min at room temperature) and stained by immunofluorescence with chicken antilaminin (Abcam, Cambridge MA, USA) with alexafluor 488-labeled anti-chicken secondary (Jackson Immunoresearch, West Grove, PA, USA) to visualize tissuematrix. Sections were analyzed without mounting medium by confocal microscopy using an Olympus BX51 FluoView 500 confocal microscope and FluoView software.
Statistical Analysis
Measurements were performed in triplicate and the values are reported as the mean ± standard deviation. In analyzing the relative deposition as a function of lung parameters, the deposition fraction observed for a given mouse was divided by the average deposition of the controls and then plotted as a function of lung volume and also as a function of lung compliance. This allowed assessment of the deposition for the extent of disease, but as such, there were no replicates and each data point represented a single mouse.
RESULTS AND DISCUSSION
BOS is believed to involve airflow obstruction with air trapping but it is a heterogeneous disease that can be associated with either obstructive or restrictive physiology [16]. In this murine BMT model of OB, the physiology is mostly restrictive (increased resistance, decreased compliance) and the histologic lesion is bronchiolar with some alveolar involvement. The increase in lung wet/dry ratios [13] may also contribute to the restrictive physiology. In our BMT protocol, all mice are fully engrafted at 2 months post-transplant. With induction of OB, the lungs typically have extensive perivascular and peribronchiolar inflammation consisting of T cells (CD4+ & CD8+), macrophages, neutrophils, and B cells [13, 17]. In addition, the lungs have elevated levels of hydroxy-proline (OH-proline), a measure of collagen accumulation and fibrosis. The results from the pulmonary function tests (PFTs) (whole body plethysmograph-–Flexivent system) are given in Table 1. The resistance to inflation was significantly increased by 23% from just under 0.6 to over 0.7 cm H2O sec/mL. The compliance was reduced (increased elasticity) by about 30%. The total lung capacity, that is total volume for inflation, was also reduced by almost 26% as well, which is consistent with the trend found in previous work [13].
TABLE 1.
Physical Lung Properties, Lung Function Tests of Resistance, Compliance, and Total Lung Capacity, and Image Volume Estimated from Image Analysis
| Group | Resistance (cm of H2O sec/mL) | Compliance (mL/cm of H2O) | Total lung capacity (mL) | Image volume (mL) |
|---|---|---|---|---|
| Control | 0.585±0.021 | 0.0451±0.0022 | 1.11±0.056 | 0.287±0.023 |
| OB | 0.72±0.13* | 0.0316±0.0065* | 0.823±0.110* | 0.253±0.017 |
Note. Results are reported as mean ± standard deviation; n = 5 Control and n = 12 OB.
p < 0.05 versus Control.
Four different aerosols were generated to examine the effect of OB on the deposition and distribution of particles in mice. The aerosol concentration in terms of mass of AlPCS per volume of air (µg/L) is given in Table 2. Because of the variation in the output of the different nebulizers and lung deposition, the concentration of AlPCS in the solution from which the aerosols were generated was adjusted to allow images to be obtained that had comparable fluorescent intensity. The Medi-Nuclear nebulizer generates droplets with a particle size near 1 µm, which are carried from the device at a flow rate of 2 LPM [14]. The droplets evaporate to leave dry particles composed of the nonvolatile components, AlPCS or AlPCS with CsCl. The aerosol concentration in terms of AlPCS for both these systems was about 0.14 mg/L [14, 15]. This does not include the presence of cesium chloride, since this is not visible in the imaging process.
TABLE 2.
Aerosol Characterization
| Device | Solution | Air flow rate (LPM) |
Aerosol conc. of AlPCS (mg/L) |
MMAD(µm) | GSD |
|---|---|---|---|---|---|
| Medi-nuclear | 10 mg/mL AlPSC | 2 | 0.14a | 0.2a | 1.84a |
| Medi-nuclear | 10 mg/mL AlPSC + 100 mg/mL CsCl | 2 | 0.14b | 0.4b | 1.8b |
| Aeroneb | 2 mg/mL AlPSC + 6 mg/mL CsCl +Column | 0.4 | 1.48 | 1.6 | 1.82 |
| Aeroneb | 10 mg/mL AlPSC | 0.4 | 7.98 | 4.0 | 1.84 |
Note. Compiled data providing the type of device and solution used to generate the aerosol with the given air flow rate, aerosol concentration in terms of the concentration of ALPCS per volume of air, and particle size distribution (mass median aerodynamic diameter, MMAD, and geometric standard deviation, GSD). The particle size distribution obtained with the Medi-nuclear was derived from the results of the SMPS and aerosol concentrations were calculated from filter capture measurements.
Data taken from [18].
Data taken from [20].
In contrast, the Aeroneb device generates droplets with a size near 4 µm. At an air flow rate of 0.4 LPM, the extent of evaporation is negligible and thus the particle size does not appreciably change from that at the point of production. With the larger initial droplets, the aerosol cloud will carry a much higher mass compared with the Medi-Nuclear device despite using a lower concentration of solution for generation. The same system was also used along with a drying column to evaporate the water and thereby reduced the size of the aerosol particles to near 1.6 µm with the presence of cesium chloride.
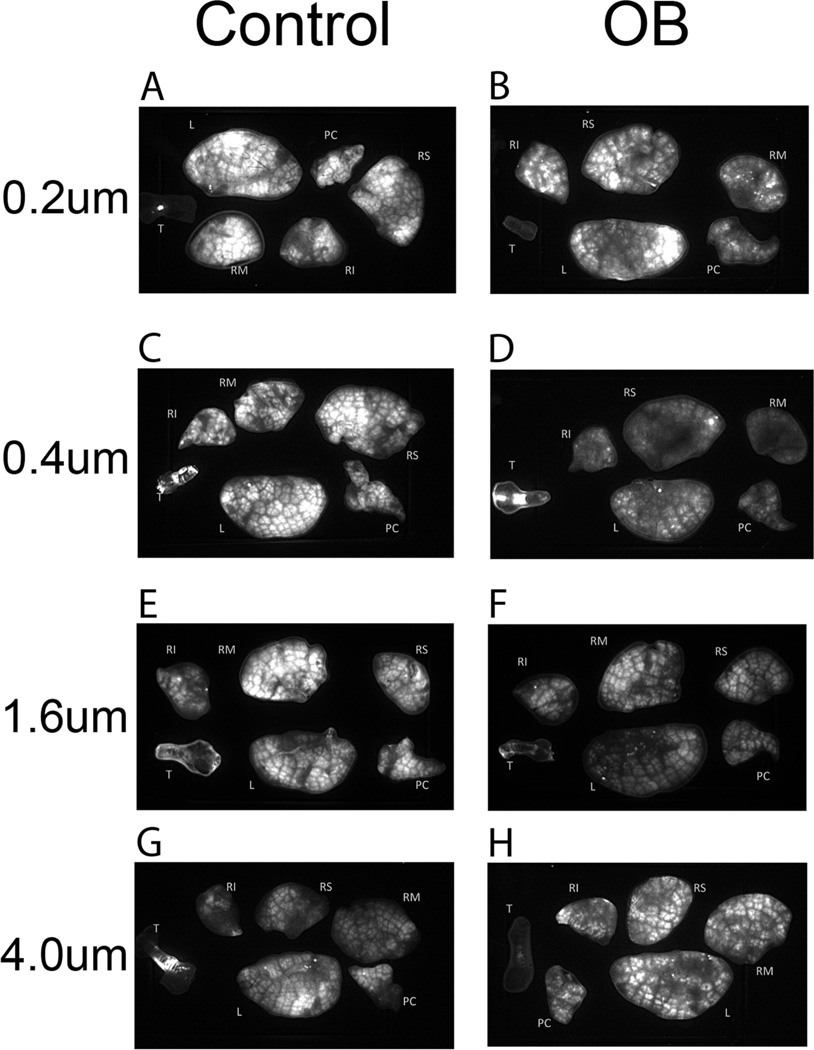
Figures 1A–H contains the fluorescent images of the control and treated lungs and trachea obtained at each particle or droplet size. The images were processed with a Gaussian filter to increase the sharpness of the image without causing appreciable distortion in the image intensity [15]. It is also important to note that different light exposure times were used in acquiring the images, since this causes a direct proportional increase in the intensity or brightness of the image. When the differences in exposure time are allowed for, it can be seen that the treated lungs/trachea gave rise to images with less overall intensity. Also evident, but less apparent, is the greater heterogeneity of intensity in the OB group. Control lungs have a relatively uniform intensity with the large dark lines corresponding to the main airways as well as blood vessels and connective tissue. This does not appear to greatly vary with a change in the aerosol particle size distribution. In OB lungs, there appear to be more regions that are distinctly dark that do not correspond to large airways or tissue/blood. In addition, a number of very bright, small-area regions indicate high localized deposition. These were not removed with rinsing of the external lung surface.
FIGURE 1.
(A) Control mouse lobes and trachea following exposure to the 0.2 µm aerosol, exposure time 200 ms. (B) OB mouse lobes and trachea following exposure to the 0.2 µm aerosol, exposure time 800 ms. (C) Control mouse lobes and trachea following exposure to the 0.4 µm aerosol, exposure time 200 ms. (D) OB mouse lobes and trachea following exposure to the 0.4 µm aerosol, exposure time 800 ms. (E) Control mouse lobes and trachea following exposure to the 1.0 µm aerosol, exposure time 100 ms. (F) OB mouse lobes and trachea following exposure to the 1.0 µm aerosol, exposure time 100 ms. (G) Control mouse lobes and trachea following exposure to the 4.0 µm aerosol, exposure time 200 ms. (H) OB mouse lobes and trachea following exposure to the 4.0 µm aerosol, exposure time 800 ms. Nomenclature for lobes is T: trachea, PC: postclaval, RM: right medial, RS: right superior, RI: right inferior, and L: left.
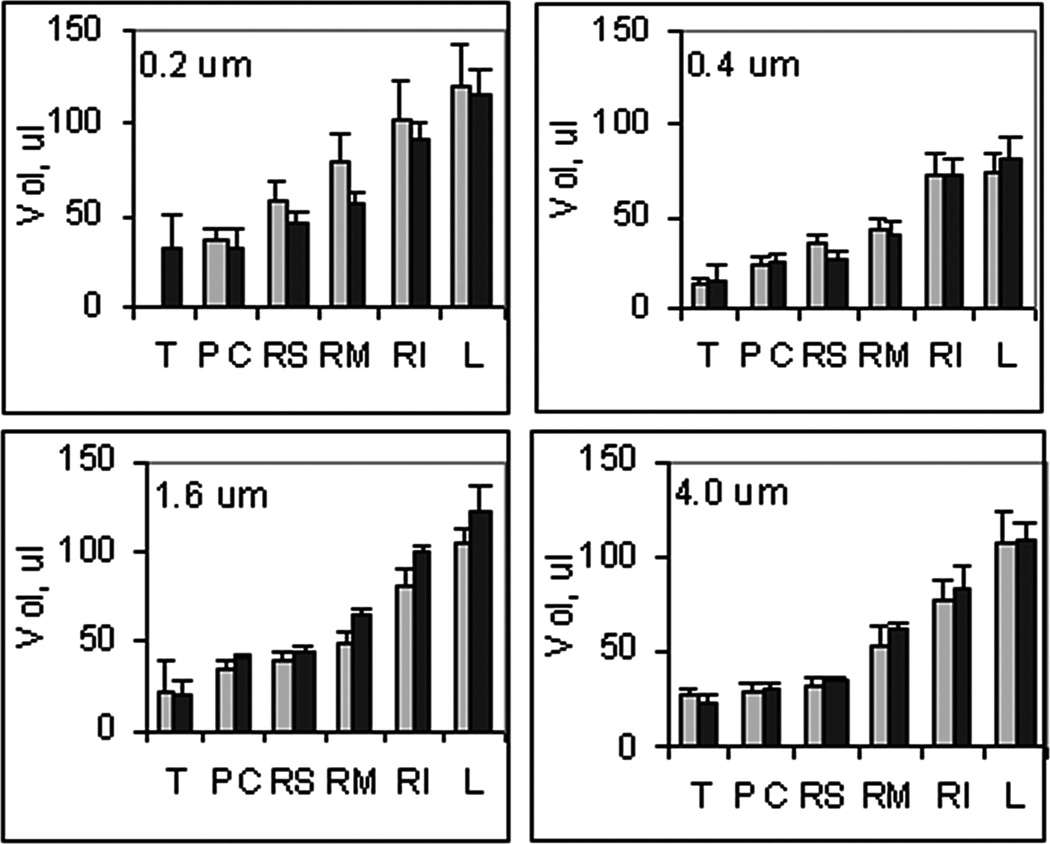
From the imaged area, in terms of calibrated pixels, and the known compression thickness, the volume of each lobe was estimated; the sum provides a measure of the lung volume. In Figure 2, the measured volume of the mouse lobes, T:trachea, PC:post claval, RM:right medial, RS:right superior, RI:right inferior, and L:left for the different aerosols are given. This imaged volume is expected to be intermediary between a fully expanded and completely collapsed lung. There is no evident difference among the lungs when comparing different aerosol exposures or between the lungs when comparing OB and control groups. The imaged volume of the lung, which was calculated as the sum of the individual lobes, is given in Table 1. This volume was not significantly different between the OB group and controls; however, it was significantly smaller than the total lung capacity measured by plethysmography as part of the lung function measurements. The latter reflects the maximum volume of air required for inflating the lung whereas the former reflects the volume of the lung with compression to a thickness of 0.1 cm. Thus, consistent with the disease model, the visual size of the lung remains unchanged with treatment, but the presence of fibrosis caused a reduction in the compliance and extent of expansion and thereby accounts for the OB-induced reduction in total lung capacity.
FIGURE 2.
Lung lobe volumes (mean ± SD, n = 3) for ( ) Control and (■) OB mice exposed to aerosols at the indicated median particle size of aerosol, T: trachea, PC: postclaval, RM: right medial, RS: right superior, RI: right inferior, and L: left.
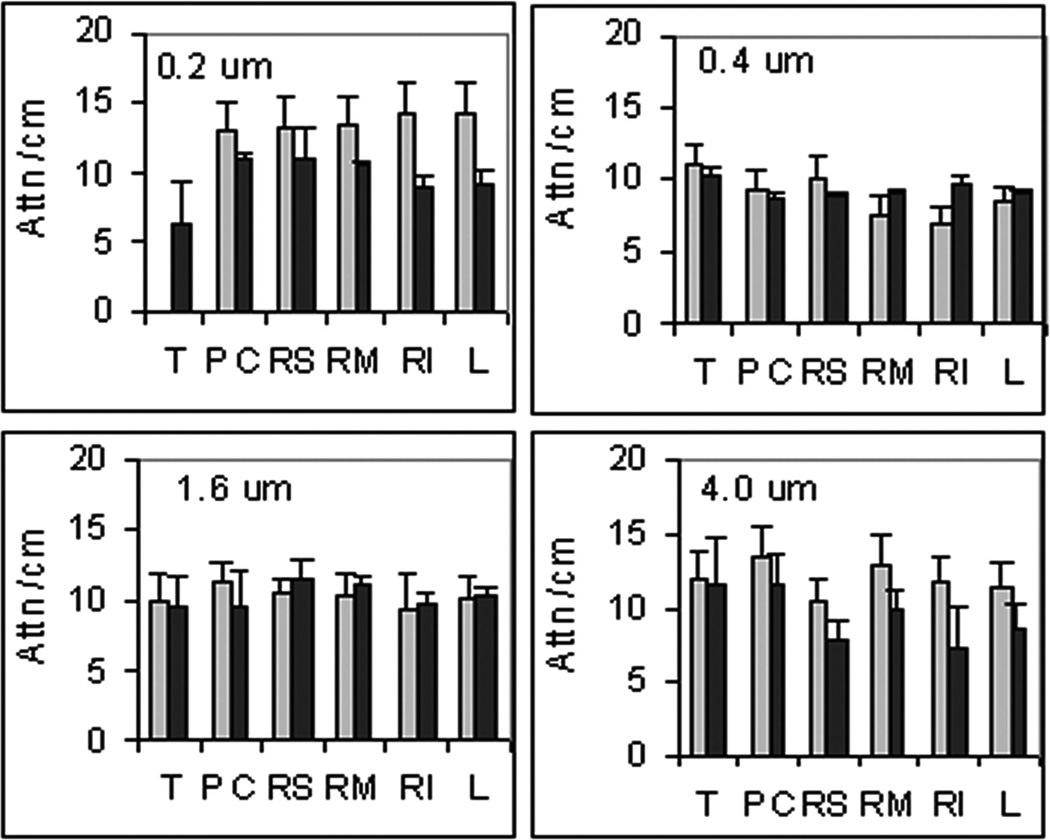
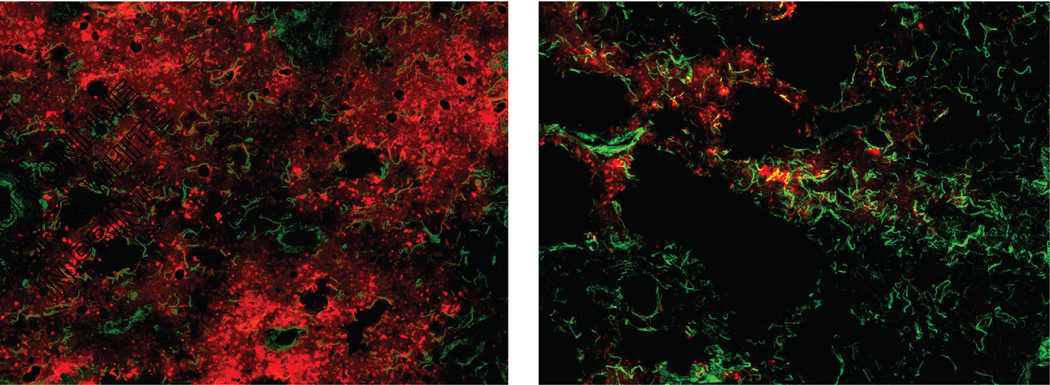
The images obtained at different degrees of compression were analyzed to estimate the tissue attenuation of the fluorescent signal as well as the concentration of AlPCS. The results for the tissue attenuation are given in Figure 3, where the values range from just over 6 to nearly 15 cm−1. Given the magnitude of the error bars, which represent standard deviations with n = 3, these values do not appear to depend on the particle size of the aerosol. In the treated mice, there appears to be a larger variation in the attenuation for the 0.2 and 4 µm aerosols, particularly for the larger left and right medial lobes. This likely reflects heterogeneity within the lobe since OB exhibits a patchy pattern of pathology. While it may be expected that regions with more and larger blood vessels and airways have higher light attenuation, this may not be the case. A greater loss of fluorescent light can occur when passing through the periphery of the lung, where the curved surfaces of alveoli cause reflection. In addition, the small alveoli will require the light to pass through multiple layers of tissue and air that give rise to refraction and scattering. This is also supported by the microscopic image provided in Figure 4. Relatively uniform deposition of AlPCS is evident by the red hue distributed on the characteristic pattern of airways and alveoli indicated by the laminin stain shown in green. In contrast, the OB tissue has little AlPCS intensity with evident disrupted tissue morphology.
FIGURE 3.
Tissue attenuation coefficients (mean ± SD, n = 3) for ( ) Control and (■) OB mice exposed to aerosols at the indicated median particle size of aerosol, T: trachea, PC: postclaval, RM: right medial, RS: right superior, RI: right inferior, and L: left.
FIGURE 4.
Fluorescent micrographs of (left) Control and (right) OB lung tissue where images obtained at 500 nm and 750 nm were superimposed to depict the colocalization of tissue (green) and AlPCS (red).
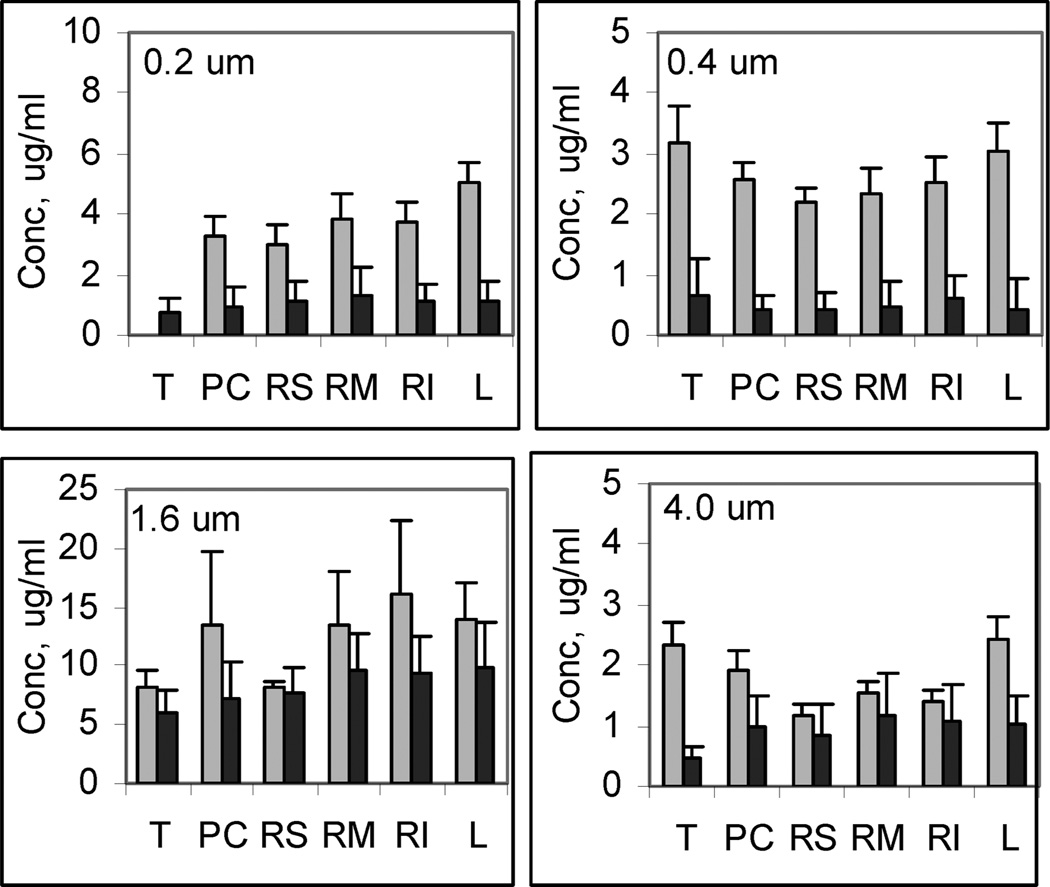
In Figure 5, the concentration estimated for each lobe is given for the four different exposures in the control and treated animals. The ordinate of each figure has been adjusted to facilitate comparison of the treated and control groups. As found previously, the concentration among the lobes is relatively uniform and indicates that the mass deposited scales with the volume of the lobe [14]. The most striking feature of these graphs is the distinctly lower concentration observed in the OB animals when compared to the controls. The difference in concentration appears to be larger in the 0.2 and 0.4 µm aerosol exposure than that seen with the 1.6 and 4 µm aerosol exposures. Thus, the alteration in lung structure evident in Figure 4 and lower total lung capacity are coincident with a lower relative deposition particularly with the small particle sizes. It may be that the proximal airway occlusion resulted in lower deposition in the damaged alveolar areas. Furthermore, the fibrosis in areas of diffuse alveolar damage create a distension and enlargement of alveoli in the intervening areas and this would require a greater displacement for diffusional impaction on the lung surface. This would also be consistent with the absence of any difference with the larger aerosols, since most of the mass may deposit by inertial impaction and sedimentation, which was less sensitive to changes in airway geometry.
FIGURE 5.
AlPCS concentration (mean ± SD, n = 3) for ( ) Control and (■) OB mice exposed to aerosols at the indicated median particle size of aerosol, T: trachea, PC: postclaval, RM: right medial, RS: right superior, RI: right inferior, and L: left. Note different scales for the figures.
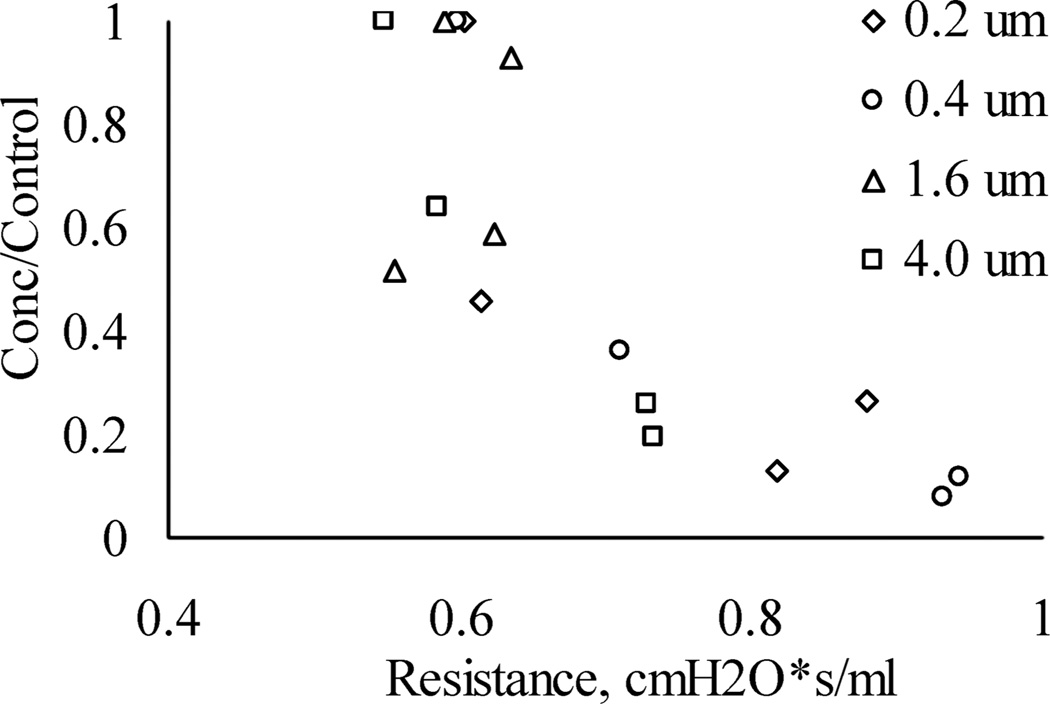
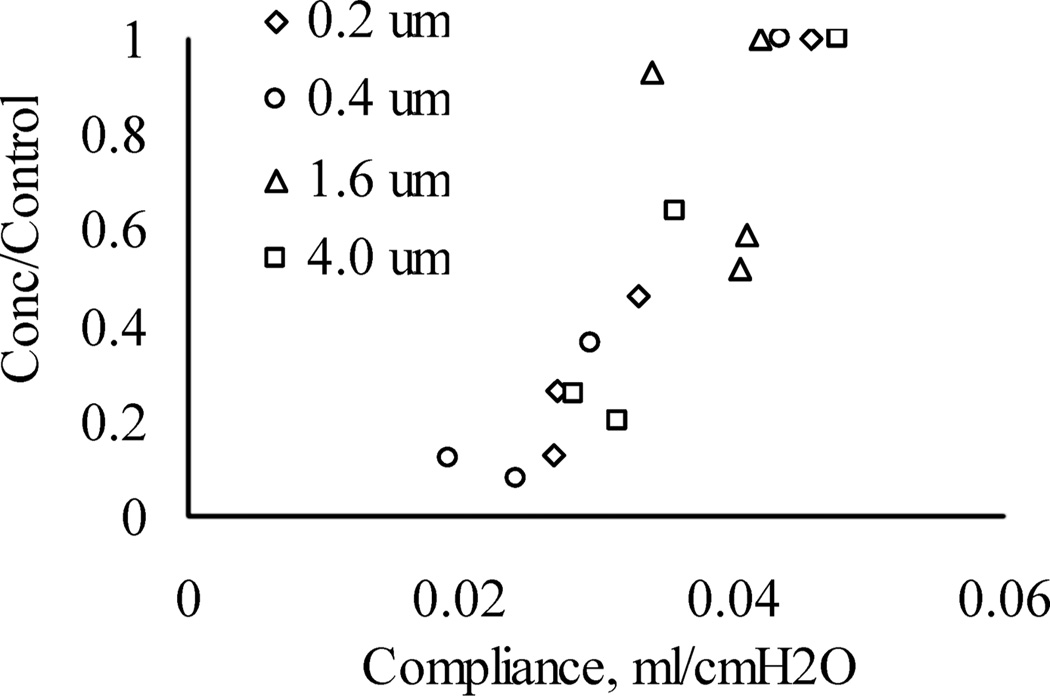
There is also a possible secondary factor that is operative, which can be better appreciated by an examination of the relationship between relative concentration and lung function as shown in Figure 6. Here, the concentration observed in the OB lungs normalized to the concentration observed in the controls is plotted as a function of lung resistance. The different symbols correspond to the different aerosol particle size distributions. It can be seen that as the airway resistance increases, there was a reduction in the relative lung concentration. This indicates that the mass deposited is inversely related to lung resistance. Furthermore, Figure 7 shows the relationship between relative concentration and lung compliance. In this case, as the lung becomes more compliant, there was an increase in the relative concentration reflecting a higher deposition. Although not shown, there was no evident relationship of the relative concentration with total lung volume or image volume.
FIGURE 6.
Relative concentration (OB/control) given as a function of airway resistance for the exposures with particles sizes of (◊) 0.2, (o) 0.4, (Δ) 1.6, and (□) 4.0 µm.
FIGURE 7.
Relative concentration (OB/control) given as a function of lung compliance for the exposures with particles sizes of (◊) 0.2, (o) 0.4, (Δ) 1.6, and (□) 4.0 µm.
Thus, mice with high resistance and low compliance have respiratory parameters that adversely affect deposition during the exposure to the aerosol. Specifically, more rapid, smaller tidal volumes associated with treatment may have led to the smaller deposition. The lack of effect of particle size may be explained by a closer examination of the data. It appears that mice exposed to the 1.6 and 4 µm aerosols generally had better lung function and thus the effect on deposition was statistically more difficult to determine. If true, then the changes in ventilatory parameters are of greater importance than the secondary measures of compliance/resistance. As such, there may not be a direct causal relationship between deposition and lung compliance/resistance. Despite the variability in disease induction, there is a clear link between aerosol deposition and lung function, which was revealed by fluorescent imaging.
While the lower deposition observed in mice with OB relative to the controls has not been unequivocally demonstrated to be a consequence of the expanded alveoli, it is possible to speculate upon the implications of aerosol delivery in humans suffering from OB. The disease primarily affects the bronchioles and alveolar region of the lower respiratory tract, and as such, no direct change in deposition of aerosols would be expected in the oral/pharyngeal or tracheobronchial regions beyond that induced by changes in ventilation of the patient. If the alveolar sacs are expanded due to distension caused by contractile fibrotic tissue in adjacent areas, then there would be a corresponding decrease in the deposition, since a greater length of time would be needed for sedimentation and diffusional impaction to occur [18–20]. Even with additional information as to the precise geometric changes, the change in the deposition fraction would be at best be an estimate. Nevertheless, if the extent of disease observed in mice is representative of that in humans, a discernable lower deposition fraction of aerosols in the alveolar region would be observed in OB patients.
In conclusion, our data provide insight into the deposition of drugs in lungs with restrictive airway disease and underscore the importance of tailoring aerosolization parameters to accommodate lung ventilation mechanics in order to optimize drug delivery.
Acknowledgments
The authors would like to thank Andrew Clarke, Logan Brentley, and Na Young Kim for help with analyzing images. The work was supported in part by NIH grants R01HL055209 and R44HL081789.
Footnotes
Declaration of interest: DY, TSW, APP, and AP-M have no conflicts of interest. AN is president of Powerscope, Inc.
REFERENCES
- 1.Rostami AA. Computational modeling of aerosol deposition in respiratory tract: a review. Inhal Toxicol. 2009 Feb;21(4):262–290. doi: 10.1080/08958370802448987. [DOI] [PubMed] [Google Scholar]
- 2.Jaafar-Maalej C, Andrieu V, Elaissari A, Fessi H. Assessment methods of inhaled aerosols: technical aspects and applications. Expert Opin Drug Deliv. 2009 Sep;6(9):941–959. doi: 10.1517/17425240903117244. [DOI] [PubMed] [Google Scholar]
- 3.Afessa B, Peters SG. Noninfectious pneumonitis after blood and marrow transplant. Curr Opin Oncol. 2008 Mar;20(2):227–233. doi: 10.1097/CCO.0b013e3282f50ff5. [DOI] [PubMed] [Google Scholar]
- 4.Arcasoy SM, Kotloff RM. Lung transplantation. N Engl J Med. 1999 Apr 8;340(14):1081–1091. doi: 10.1056/NEJM199904083401406. [DOI] [PubMed] [Google Scholar]
- 5.Trulock EP. Lung transplantation. Am J Respir Crit Care Med. 1997 Mar;155(3):789–818. doi: 10.1164/ajrccm.155.3.9117010. [DOI] [PubMed] [Google Scholar]
- 6.Dudek AZ, Mahaseth H, DeFor TE, Weisdorf DJ. Bronchiolitis obliterans in chronic graft-versus-host disease: analysis of risk factors and treatment outcomes. Biol Blood Marrow Transplant. 2003 Oct;9(10):657–666. doi: 10.1016/s1083-8791(03)00242-8. [DOI] [PubMed] [Google Scholar]
- 7.Pandya CM, Soubani AO. Bronchiolitis obliterans following hematopoietic stem cell transplantation: a clinical update. Clin Transplant. 2010 May;24(3):291–306. doi: 10.1111/j.1399-0012.2009.01122.x. [DOI] [PubMed] [Google Scholar]
- 8.Panoskaltsis-Mortari A, Griese M, Madtes DK, Belperio JA, Haddad IY, Folz RJ, Cooke KR. An official American Thoracic Society research statement: noninfectious lung injury after hematopoietic stem cell transplantation: idiopathic pneumonia syndrome. Am J Respir Crit Care Med. 2011 May 1;183(9):1262–1279. doi: 10.1164/rccm.2007-413ST. [DOI] [PMC free article] [PubMed] [Google Scholar]
- 9.Williams KM, Chien JW, Gladwin MT, Pavletic SZ. Bronchiolitis obliterans after allogeneic hematopoietic stem cell transplantation. JAMA. 2009 Jul 15;302(3):306–314. doi: 10.1001/jama.2009.1018. [DOI] [PMC free article] [PubMed] [Google Scholar]
- 10.Chien JW, Duncan S, Williams KM, Pavletic SZ. Bronchiolitis obliterans syndrome after allogeneic hematopoietic stem cell transplantation—an increasingly recognized manifestation of chronic graft-versus-host disease. Biol Blood Marrow Transplant. 2010 Jan;16(1 Suppl):S106–S114. doi: 10.1016/j.bbmt.2009.11.002. [DOI] [PMC free article] [PubMed] [Google Scholar]
- 11.Estenne M, Hertz MI. Bronchiolitis obliterans after human lung transplantation. Am J Respir Crit Care Med. 2002 Aug 15;166(4):440–444. doi: 10.1164/rccm.200201-003pp. [DOI] [PubMed] [Google Scholar]
- 12.Trulock EP, Edwards LB, Taylor DO, Boucek MM, Keck BM, Hertz MI. The Registry of the International Society for Heart and Lung Transplantation: twenty-first official adult lung and heart-lung transplant report—2004. J Heart Lung Transplant. 2004 Jul;23(7):804–815. doi: 10.1016/j.healun.2004.05.013. [DOI] [PubMed] [Google Scholar]
- 13.Panoskaltsis-Mortari A, Tram KV, Price AP, Wendt CH, Blazar BR. A new murine model for bronchiolitis obliterans post-bone marrow transplant. Am J Respir Crit Care Med. 2007 Oct 1;176(7):713–723. doi: 10.1164/rccm.200702-335OC. [DOI] [PMC free article] [PubMed] [Google Scholar]
- 14.Yi D, Price A, Panoskaltsis-Mortari A, Naqwi A, Wiedmann TS. Measurement of the distribution of aerosols among mouse lobes by fluorescent imaging. Anal Biochem. 2010 Aug;403(1–2):88–93. doi: 10.1016/j.ab.2010.04.005. [DOI] [PMC free article] [PubMed] [Google Scholar]
- 15.Yi D, Naqwi A, Panoskaltsis-Mortari A, Wiedmann TS. Distribution of aerosols in mouse lobes by fluorescent imaging. Int Pharm. 2012 Apr 15;426(1–2):108–115. doi: 10.1016/j.ijpharm.2012.01.037. [DOI] [PMC free article] [PubMed] [Google Scholar]
- 16.Markopoulo KD, Cool CD, Elliot TL, Lync DA, Newell JD, Jr, Hale VA, Brown KK, Schwarz MI, Tuder RM. Obliterative bronchiolitis: varying presentations and clinicopathological correlation. Eur Respir J. 2002 Jan;19(1):20–30. doi: 10.1183/09031936.02.00282001. [DOI] [PubMed] [Google Scholar]
- 17.Srinivasan M, Flynn R, Price A, Ranger A, Browning JL, Taylor PA, Ritz J, Antin JH, Murphy WJ, Luznik L, Shlom-chik MJ, Panoskaltsis-Mortari A, Blazar BR. Donor B-cell alloantibody deposition and germinal center formation are required for the development of murine chronic GVHD and bronchiolitis obliterans. Blood. 2012 Feb 9;119(6):1570–1580. doi: 10.1182/blood-2011-07-364414. [DOI] [PMC free article] [PubMed] [Google Scholar]
- 18.Garrard CS, Gerrity TR, Schreiner JF, Yeates DB. Analysis aerosol deposition in the healthy human lung. Arch Environ Health. 1981 Jul-Aug;36(4):184–193. doi: 10.1080/00039896.1981.10667624. [DOI] [PubMed] [Google Scholar]
- 19.Schiller CH, Gebhart J, Heyder J, Rudolf G, Stahlhofen W. Factors influencing total deposition of ultrafine aerosol particles in the human respiratory tract. J Aerosol Sci. 1986;17:328–332. [Google Scholar]
- 20.Usmani OS, Biddiscombe MF, Barnes PJ. Regional lung deposition and bronchodilator response as a function of beta2-agonist particle size. Am J Respir Crit Care Med. 2005 Dec 15;172(12):1497–1504. doi: 10.1164/rccm.200410-1414OC. [DOI] [PubMed] [Google Scholar]


