

Abstract
In a multimodal PET imaging approach, we determined the differential contribution of neurofibrillary tangles (measured with [18F]AV‐1451) and beta‐amyloid burden (measured with [11C]PiB) on degree of neurodegeneration (i.e., glucose metabolism measured with [18F]FDG‐PET) in patients with Alzheimer's disease. Across brain regions, we observed an interactive effect of beta‐amyloid burden and tau deposition on glucose metabolism which was most pronounced in the parietal lobe. Elevated beta‐amyloid burden was associated with a stronger influence of tau accumulation on glucose metabolism. Our data provide the first in vivo insights into the differential contribution of Aβ and tau to neurodegeneration in Alzheimer's disease.
Introduction
Extracellular beta‐amyloid plaques (Aβ) and intracellular neurofibrillary tangles (tau) are the primary pathological hallmarks of Alzheimer's disease (AD). Postmortem studies have suggested that Aβ deposition is abundantly distributed in the cortex already early in the course of the disease, whereas tau formation, synaptic loss, and gliosis progress to advanced stages of AD.1 The temporal dynamics of these neuropathologic processes may be one explanation for the close correlation between tau pathology and dementia severity, whereas Aβ shows no additive predictive value.2 Interestingly, animal studies – more appropriate to investigate the temporal relationship of protein accumulation than postmortem studies – recently suggested a synergistic effect of Aβ‐mediated tau propagation and neuronal loss.3 However, the relative contributions of Aβ and tau pathology to AD‐related neurodegeneration in humans remain elusive.
PET imaging studies have not observed a distinct regional relationship between Aβ‐deposition and neurodegeneration.4 With the advent of a novel PET tracer ([18F]AV‐1451 aka T807) that shows high affinity to intracellular tau tangle pathology,5 it has now become possible to examine the potential interactive relationship between protein aggregation and neurodegeneration in vivo. Understanding the contribution of tau and Aβ pathology to neurodegeneration in AD will greatly advance our knowledge of disease mechanisms and could become paramount in identifying or evaluating therapeutic approaches.
To this end, we assessed the relationship of tau and Aβ pathology to global and regional patterns of hypometabolism in AD patients using trimodal PET (i.e., [11C]PiB PET, [18F]AV‐1451, [18F]FDG‐PET) and tested the degree to which Aβ and tau deposition contribute to neurodegeneration on AD.
Methods
Participants
Participants (N = 10; MeanAge = 67.2 years, SDAge = 7.3; MeanMMSE = 22 SDMMSE = 4) were clinically diagnosed with typical AD in the interdisciplinary center for memory disorders of the University Hospital Cologne and the Department of Psychiatry, University Hospital Bonn using the recommended diagnostic guidelines,6 and supported by the diagnostic PET imaging results evaluated by the experts from the Department of Nuclear Medicine (J. H., T. v. E., A. D.). All participants underwent a trimodal PET imaging protocol at the University Hospital Cologne, including [11C]PiB PET, [18F]AV‐1451, [18F]FDG‐PET in the course of their clinical work‐up for dementia. Patients signed an informed consent regarding the scientific evaluation and possible publication of their data. The study was performed with approval of the Ethics Committee of the Faculty of Medicine of the University of Cologne.
PET imaging protocol and analysis
All PET scans were performed at the Department of Nuclear Medicine, University Hospital Cologne, Germany, with a Siemens Biograph mCT Flow 128 Edge scanner (Siemens, Knoxville, TN).
PET imaging protocol
All PET scans were iteratively reconstructed using a 3‐D OSEM algorithm (four iterations, 12 subsets, Gaussian filter: 5 mm Full width at half maximum (FWHM), 128 × 128 matrix, slice thickness of 3 mm). PiB PET data were acquired for 30 min, 41 ± 15 min after injection of 305 ± 107 MBq of [11C]For FDG PET, a ten minute acquisition scan was performed 39 (+−) 18 min after injection of 217, 5 (+−) 16 [18F]FDG‐PET. Tau PET was acquired for 15 min, 94 ± 15 min after injection of 248 ± 58 MBq of [18F]AV‐1451.
Image analysis
All image analyses were conducted using SPM8 (Wellcome Trust Centre for Neuroimaging). First, PiB and AV‐1451 scans were coregistered to the FDG image of each patient. Second, we spatially normalized coregistered PET scans to an aging and dementia‐specific [18F]FDG PET template.7 Standardized uptake values ratio (SUVR) images were created by dividing each image by the nonspecific binding of an automated anatomical labeling (AAL)‐modified cerebellar region, excluding the peduncles.
Creation of z‐transformed deviation images (z‐maps)
To assess AD‐related differences in tau deposition and glucose hypometabolism, we computed voxel‐wise mean (μ) and standard deviation (σ) of SUVR values for healthy controls. The healthy control groups were provided by AVID Radiopharmaceuticals ([18F]AV‐1451; N = 15, AgeMean = 64.4, MMSE=29.5), from the Alzheimer's Disease Imaging database (http://adni.loni.usc.edu; [18F]FDG PET N = 18, AgeMean = 65.8, MMSE = 29.1*; *MMSE scores for three healthy controls were not available from the ADNI database), and 15 healthy controls (AgeMean = 64.0, MMSE = 29.2) who underwent a [11C]PiB PET imaging protocol.8 We then computed z‐score deviations for every voxel (x) using the formula . The deviation images were overlaid on the lateral surface of the left and the right hemisphere using to Freesurfer 5.3 (http://surfer.nmr.mgh.harvard.edu).
ROI analysis
A structure‐based parcellation of cortical and hippocampal areas (AAL) was used and z‐scores were extracted. For a region‐specific analysis, we selected the region of interests (ROIs) that fall into six cortical structures (i.e., frontal, temporal, parietal, occipital lobe, insular cortex/cingulum, and hippocampus). Z‐scores were averaged on the group level for each ROI to assess the regional pattern of FDG hypometabolism and its correspondence with regional tau and Aβ pathology.
Statistical analysis
We performed uni‐ and multivariate analyses to assess the relationship of tau and Aβ burden to measure hypometabolism. Additionally, we examined the reliability of the individual correlation of FDG hypometabolism with tau and Aβ deviation across patients using the Wilcoxon signed rank test. We performed all analyses in R and Systat 13 (Systat Software, Inc., Chicago, IL) and multivariate analyses were corrected for multiple comparisons.
Results
We observed a close spatial correspondence of the pattern of mean FDG deviation and mean tau deviation, whereas a widespread and diffuse pattern of amyloid was seen in the amyloid deviation map (see Fig. 1).
Figure 1.
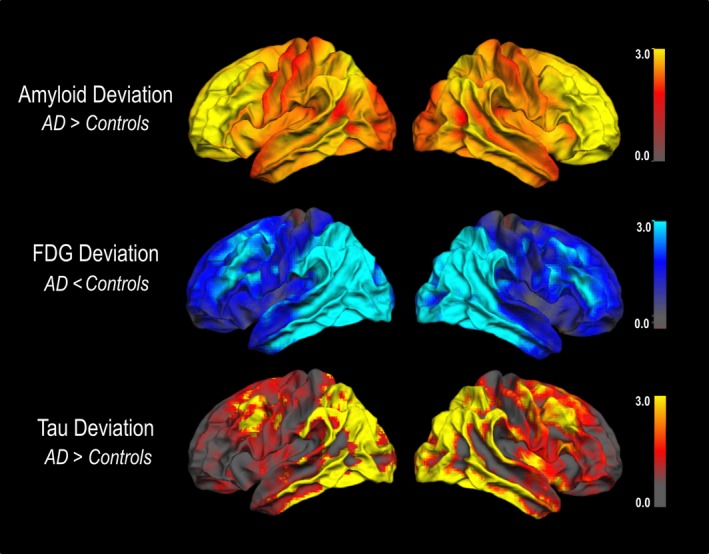
Spatial correspondence of mean Fluordexoglucose (FDG) deviation and mean tau deviation but not amyloid deviation in AD patients. AD, Alzheimer's disease patients. Deviation images were projected on the lateral surface of the left and the right hemisphere using FreeSurfer.
Across brain regions, we observed a strong positive relationship of mean tau deposition and hypometabolism (r = 0.71, P < 0.001; see Fig. 2A), whereas the pattern of Aβ burden and hypometabolism was negatively related (r = −0.41, P < 0.001; see Fig. 2B).
Figure 2.
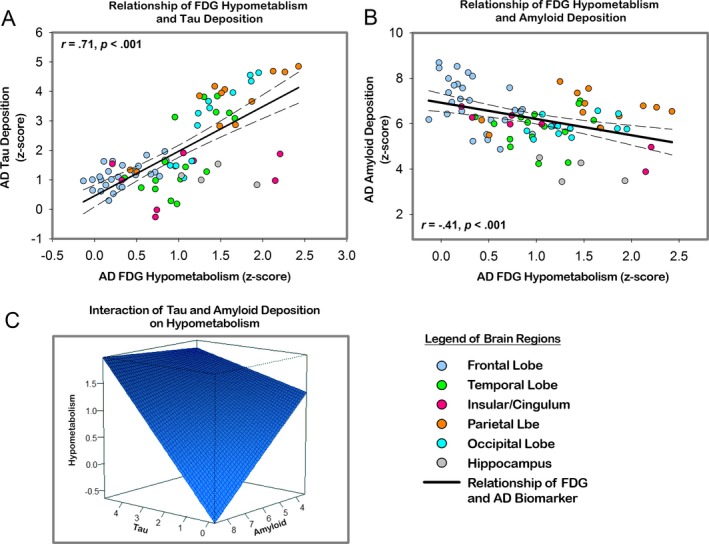
(A) Significant relationship of the pattern of FDG hypometabolism and the pattern of tau deposition across brain regions in cortical and subcortical AAL regions. (B) A positive relationship of the pattern of FDG hypometabolism and the pattern of Aβ burden in cortical and subcortical AAL regions. (C) Regression plane of the interaction of tau (y‐axis) and Aβ (x‐axis) deposition on hypometabolism (z‐axis). AAL, automated anatomical labeling.
The multivariate analysis yielded an interactive effect of tau deposition and Aβ burden predicting measures of AD‐related hypometabolism, such that regions with higher PiB uptake showed a stronger relationship of tau and hypometabolism, compared to regions with lower Aβ burden (Tau × Aβ t = 2.003, P = 0.04; see Table 1C, Fig. 2C).
Table 1.
Result of univariate (A and B) and multivariate analysis (C) on the relationship among tau and amyloid burden and hypometabolism
| A) Tau and FDG hypometabolism | B) Amyloid and FDG hypometabolism | |||
|---|---|---|---|---|
| r | P | r | P | |
| Hippocampus | −0.34 | 0.60 | −0.58 | 0.42 |
| Temporal lobe | 0.71 | 0.00 | 0.12 | 0.65 |
| Frontal lobe | 0.59 | 0.00 | −0.49 | 0.00 |
| Parietal lobe | 0.88 | 0.00 | 0.24 | 0.44 |
| Occipital lobe | 0.92 | 0.00 | 0.34 | 0.27 |
| Insular cortex/cingulum | 0.30 | 0.46 | −0.91 | 0.00 |
| (C) Multivariate analysis | ||||
|---|---|---|---|---|
| b | SE b | β | P‐value | |
| Global hypometabolism | ||||
| Tau deposition | −0.15 | 0.25 | −0.33 | 0.53 |
| Amyloid deposition | −0.34 | 0.06 | −0.60 | 0.00 |
| Tau × amyloid | 0.07 | 0.03 | 1.0 | 0.04 |
| Temporal hypometabolism | ||||
| Tau deposition | 0.21 | 0.05 | 0.75 | 0.00 |
| Amyloid SUVR | −0.05 | 0.09 | −0.11 | 0.56 |
| Frontal hypometabolism | ||||
| Tau deposition | 0.34 | 0.14 | 0.45 | 0.02 |
| Amyloid deposition | −0.06 | 0.05 | −0.23 | 0.23 |
| Parietal hypometabolism | ||||
| Tau deposition | 0.19 | 0.53 | 3.7 | 0.00 |
| Amyloid deposition | 0.28 | 0.31 | 0.32 | 0.39 |
| Tau × amyloid | −0.21 | 0.08 | −3.1 | 0.04 |
| Occipital hypometabolism | ||||
| Tau deposition | 0.24 | 0.03 | −0.89 | 0.00 |
| Amyloid deposition | 0.18 | 0.09 | 0.21 | 0.08 |
SUVR, standardized uptake values ratio.
In the region‐specific analyses, we found significant associations of hypometabolism and tau deposition for all regions except insular cortex/cingulum and hippocampus (for details, see Table 1A). Interestingly, regional Aβ burden was only negatively related to hypometabolism in frontal and insular/cingulate areas (see Table 1B). The multivariate analysis approach detected a significant main effect of tau deposition on regional hypometabolism in all regions. Importantly, Aβ burden, when considered in the presence of tau, did not exert an effect on regional hypometabolism, except for the parietal lobe, where an interactive effect was observed (see Table 1C). Finally, the correlation indices of tau and FDG (r mean = 0.46) across participants significantly differed from the correlation of amyloid and FDG (r mean = −0.28) (Z WicolxonSignedRankTest = −2.80, P =0.005). Furthermore, the probability for a positive correlation between tau and FDG was significant (P signTest = 0.002).
Discussion
Here, we report the first evidence for an in vivo marker of tau pathology as measured with [18F]AV‐1451 that relates to the pattern of neurodegeneration as measured with [18F]FDG in a sample of clinically diagnosed cases of AD. While the pattern of hypometabolism across brain regions was predicted by the interactive effect of Aβ and tau, regional hypometabolism was consistently associated with the presence of tau but not Aβ, except for the parietal region were an interaction was observed.
Our results are in support of accumulating evidence derived from in vivo animal models and in vitro studies, that neurodegenerative processes are related to an interactive effect of soluble forms of Aβ and hyperphosphorylated tau.9, 10, 11 Although current PET tracers are insensitive to soluble oligomeric forms of Aβ, studies have shown that an increasing pathological burden of fibrillar monomeric Aβ is associated with a higher prevalence of oligomeric forms.12 Therefore, it is conceivable that Aβ burden in AD, measured with in vivo PET tracers, may indirectly relate to the toxic oligomeric forms of Aβ and in concert with tau deposition, contribute to patterns of neurodegeneration in AD.
The observed regional dissociation favoring the role of regional tau pathology on patterns of regional hypometabolism may be indicative of tau‐mediated neurodegeneration that occurs independent of the presence of Aβ. Although it is still under debate if neurodegeneration underlies tau‐dependent Aβ toxicity or Aβ‐dependent tau toxicity,13 there is convincing evidence that the amount and distribution of tau correlates with the severity and the duration of dementia,14 underscoring the independent contribution of tau pathology.
Our results offer insights into the dynamic interaction of tau pathology and amyloid burden with hypometabolism in typical AD. Most regions showed a direct relationship of tau pathology and hypometabolism, irrespective of Aβ. However, in the parietal region, an early site of amyloid deposition and decreased hypometabolism in AD, an interactive effect of Aβ and tau was observed. This result may be indicative of the joint downstream effect of both protein pathologies in regions affected early in the course of the disease. To further evaluate the contribution of both molecular hallmarks to neurodegeneration, atypical AD representations may be an optimal population to examine the distinct spatial overlap of pathology and hypometabolism.
The lack of a significant relationship between the pattern of tau pathology and hypometabolism in the hippocampus, an early site of tangles deposition in AD15 is – at least at first sight – somewhat surprising. Consistent with the literature,16, 17 we found moderate levels of hypometabolism in the hippocampus of AD patients, while hippocampal tau deposition did not differ from normal age‐matched controls. Therefore, hippocampal tau deposition may not be sensitive enough to distinguish normal‐aged individuals from AD patients, as tau is present in medial temporal lobe regions in almost all individuals over the age of 6518 and maybe representative of primary or additive age‐related tauopathy.19
Our results offer new avenues for future research: From a spreading perspective,20 it could be argued, that temporal tau burden spreads to adjacent parietal regions, where elevated levels of Aβ accelerate the independent propagation of tau to other regions. Future approaches including longitudinal studies may test this hypothesis.
Taken together, our data provide the first evidence of the differential contribution of Aβ and tau to patterns of neurodegeneration in AD measured in vivo, which may prove to be critical in the design of disease modifying interventions.
Author Contributions
G. N. B., F. J., A. D., T. v. E. were responsible for conception and design of the study. G. N. B., K. F., J. D., O. O., J. K., B. N., assisted in recruitment and data collection. G. N. B., J. H., B. N., A. D., T. v. E., analyzed the data. All authors wrote and edited the manuscript.
Conflict of Interest
A. D. reports grants from Brandau‐Laibach Foundation, grants from German Center for Neurodegenerative Disease, personal fees from Piramal, personal fees from Lilly/AVID, personal fees from GE Healthcare, personal fees from Siemens Healthcare, during the conduct of the study. F. J. reports personal fees from Norvatis, personal fees from Lilly, personal fees from Piramal, personal fees from AC Immune, personal fees from Boehringer, personal fees from Nutricia, personal fees from Schwabe, during the conduct of the study. J. K. received financial reimbursement for a talk by Lilly as well as financial support for a symposium by Lilly, Piramal, and Euroimmun. All activities were unrelated to the study.
Acknowledgments
We are grateful to AVID Radiopharmaceutical, Inc. who provided image data of a healthy control sample for this study. G. R. F. and J. K. gratefully acknowledge support by the Marga and Walter Boll Foundation, Kerpen, Germany. Data used in preparation of this article were obtained from the Alzheimer's Disease Neuroimaging Initiative (ADNI) database (adni.loni.usc.edu). As such, the investigators within the ADNI contributed to the design and implementation of ADNI and/or provided data but did not participate in analysis or writing of this report. A complete listing of ADNI investigators can be found at: http://adni.loni.usc.edu/wpcontent/uploads/how_to_apply/ADNI_Acknowledgement_List.pdf
References
- 1. Ingelsson M, Fukumoto H, Newell KL, et al. Early Abeta accumulation and progressive synaptic loss, gliosis, and tangle formation in AD brain. Neurology 2004;62:925–931. [DOI] [PubMed] [Google Scholar]
- 2. Giannakopoulos P, Herrmann FR, Bussière T, et al. Tangle and neuron numbers, but not amyloid load, predict cognitive status in Alzheimer's disease. Neurology 2003;60:1495–1500. [DOI] [PubMed] [Google Scholar]
- 3. Pooler AM, Polydoro M, Maury EA, et al. Amyloid accelerates tau propagation and toxicity in a model of early Alzheimer's disease. Acta Neuropathol Commun 2015;3:14. [DOI] [PMC free article] [PubMed] [Google Scholar]
- 4. Altmann A, Ng B, Landau SM, et al.; Alzheimer's Disease Neuroimaging Initiative . Regional brain hypometabolism is unrelated to regional amyloid plaque burden. Brain 2015;138(Pt 12):3734–3746. [DOI] [PMC free article] [PubMed] [Google Scholar]
- 5. Marquié M, Normandin MD, Vanderburg CR, et al. Validating novel tau positron emission tomography tracer [F‐18]‐AV‐1451 (T807) on postmortem brain tissue. Ann Neurol 2015;78:787–800. [DOI] [PMC free article] [PubMed] [Google Scholar]
- 6. McKhann GM, Knopman DS, Chertkow H, et al. The diagnosis of dementia due to Alzheimer's disease: recommendations from the National Institute on Aging‐Alzheimer's Association workgroups on diagnostic guidelines for Alzheimer's disease. Alzheimers Dement 2011;7:263–269. [DOI] [PMC free article] [PubMed] [Google Scholar]
- 7. Della Rosa PA, Cerami C, Gallivanone F, et al. A standardized [18F]‐FDG‐PET template for spatial normalization in statistical parametric mapping of dementia. Neuroinformatics 2014;12:575–593. [DOI] [PubMed] [Google Scholar]
- 8. Klupp E, Grimmer T, Tahmasian M, et al. Prefrontal hypometabolism in Alzheimer disease is related to longitudinal amyloid accumulation in remote brain regions. J Nucl Med 2015;56:399–404. [DOI] [PubMed] [Google Scholar]
- 9. Götz J, Chen F, van Dorpe J, Nitsch RM. Formation of neurofibrillary tangles in P301 l tau transgenic mice induced by Abeta 42 fibrils. Science 2001;293:1491–1495. [DOI] [PubMed] [Google Scholar]
- 10. Shipton OA, Leitz JR, Dworzak J, et al. Tau protein is required for amyloid {beta}‐induced impairment of hippocampal long‐term potentiation. J Neurosci 2011;31:1688–1692. [DOI] [PMC free article] [PubMed] [Google Scholar]
- 11. Jin M, Shepardson N, Yang T, et al. Soluble amyloid beta‐protein dimers isolated from Alzheimer cortex directly induce Tau hyperphosphorylation and neuritic degeneration. Proc Natl Acad Sci USA 2011;108:5819–5824. [DOI] [PMC free article] [PubMed] [Google Scholar]
- 12. Esparza TJ, Zhao H, Cirrito JR, et al. Amyloid‐β oligomerization in Alzheimer dementia versus high‐pathology controls. Ann Neurol 2013;73:104–119. [DOI] [PMC free article] [PubMed] [Google Scholar]
- 13. Bloom GS. Amyloid‐β and tau: the trigger and bullet in Alzheimer disease pathogenesis. JAMA Neurol 2014;71:505–508. [DOI] [PubMed] [Google Scholar]
- 14. Gómez‐Isla T, Hollister R, West H, et al. Neuronal loss correlates with but exceeds neurofibrillary tangles in Alzheimer's disease. Ann Neurol 1997;41:17–24. [DOI] [PubMed] [Google Scholar]
- 15. Braak H, Alafuzoff I, Arzberger T, et al. Staging of Alzheimer disease‐associated neurofibrillary pathology using paraffin sections and immunocytochemistry. Acta Neuropathol 2006;112:389–404. [DOI] [PMC free article] [PubMed] [Google Scholar]
- 16. Chételat G, Desgranges B, Landeau B, et al. Direct voxel‐based comparison between grey matter hypometabolism and atrophy in Alzheimer's disease. Brain 2008;131(Pt 1):60–71. [DOI] [PubMed] [Google Scholar]
- 17. Kawachi T, Ishii K, Sakamoto S, et al. Comparison of the diagnostic performance of FDG‐PET and VBM‐MRI in very mild Alzheimer's disease. Eur J Nucl Med Mol Imaging 2006;33:801–809. [DOI] [PubMed] [Google Scholar]
- 18. Braak H, Thal DR, Ghebremedhin E, Del Tredici K. Stages of the pathologic process in Alzheimer disease: age categories from 1 to 100 years. J Neuropathol Exp Neurol 2011;70:960–969. [DOI] [PubMed] [Google Scholar]
- 19. Crary JF, Trojanowski JQ, Schneider JA, et al. Primary age‐related tauopathy (PART): a common pathology associated with human aging. Acta Neuropathol 2014;128:755–766. [DOI] [PMC free article] [PubMed] [Google Scholar]
- 20. Brettschneider J, Del Tredici K, Lee VM‐Y, Trojanowski JQ. Spreading of pathology in neurodegenerative diseases: a focus on human studies. Nat Rev Neurosci 2015;16:109–120. [DOI] [PMC free article] [PubMed] [Google Scholar]