. 2016 Dec 22;5:e20894. doi: 10.7554/eLife.20894

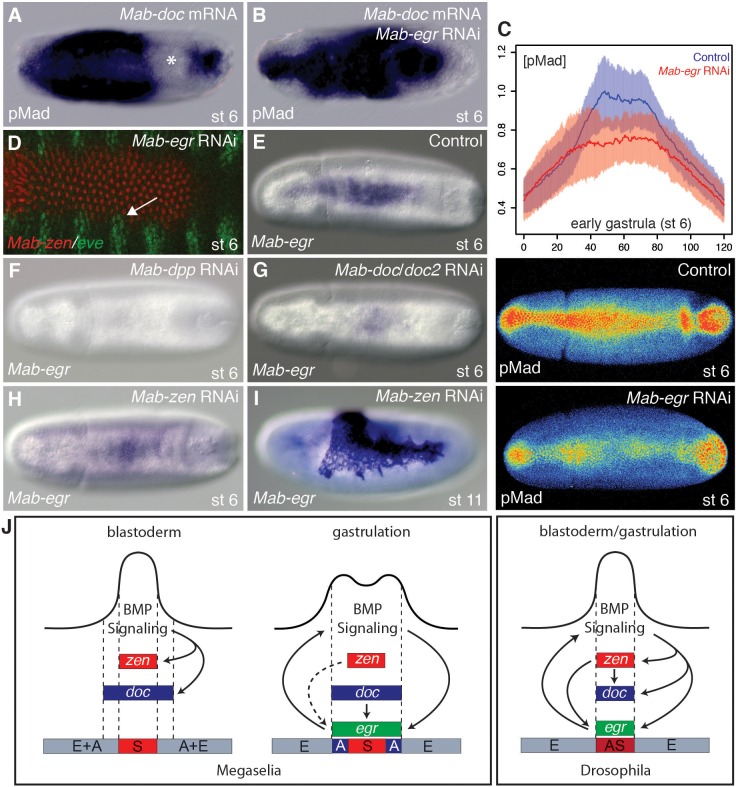
Figure 4. Mab-egr is downstream of Mab-doc and promotes BMP signaling.

(A, B) pMad staining following Mab-doc overexpression (A) or Mab-doc overexpression and Mab-egr knockdown (B). The asterisk marks site of endogenous pMad depletion. (C) Mean intensity and standard deviation of pMad staining in control injected embryos (blue, n = 10) and Mab-egr knockdown embryos (red, n = 9) at early gastrulation with representative embryos stained for pMad underneath the plot. (D) Mab-zen and Mab-eve expression at early gastrulation after Mab-egr knockdown with arrow indicating suppressed gap between the Mab-eve and Mab-zen domains. (EH) Mab-egr expression in wild type (E), Mab-dpp knockdown (F), Mab-doc/doc2 knockdown (G), and Mab-zen knockdown (H) embryos at early gastrulation. (I) Mab-egr expression in a Mab-zen knockdown embryo after germ band extension. (J) BMP gene regulatory networks in Megaselia abdita and Drosophila melanogaster.

DOI: http://dx.doi.org/10.7554/eLife.20894.010

Figure 4.

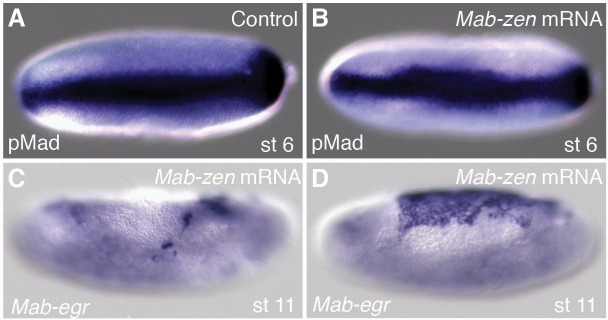
Figure 4—figure supplement 1. Effect of Mab-zen overexpression on BMP signaling.

Figure 4—figure supplement 1.

(A, B) pMad staining at early gastrulation in control (A) and after Mab-zen overexpression (B). (C, D) Mab-egr expression at late germband extension after Mab-zen overexpression. The majority of embryos showed reduced Mab-egr expression (37/51) (C) while a minority of embryos showed either expanded Mab-egr expression (7/51) (D), possibly as a consequence of premature serosa-amnion disruption, or were indistinguishable from wild type (7/51) (not shown). (A, B) Dorsal views with anterior left. (C, D) Lateral views with dorsal up and anterior left.
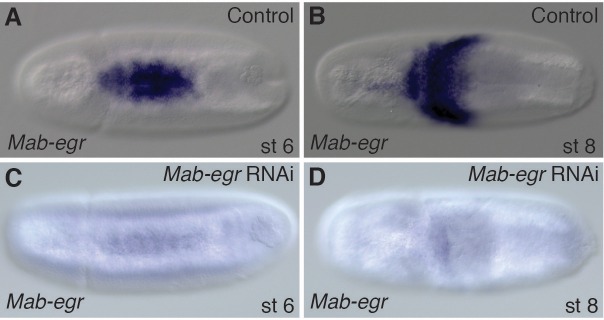
Figure 4—figure supplement 2. Efficiency of Mab-egr RNAi.

Figure 4—figure supplement 2.

(AD) Mab-egr expression in control (A, B) and Mab-egr knockdown embryos (C, D) at early gastrulation (A, C) and during germ band extension (B, D). Dorsal views with anterior left.
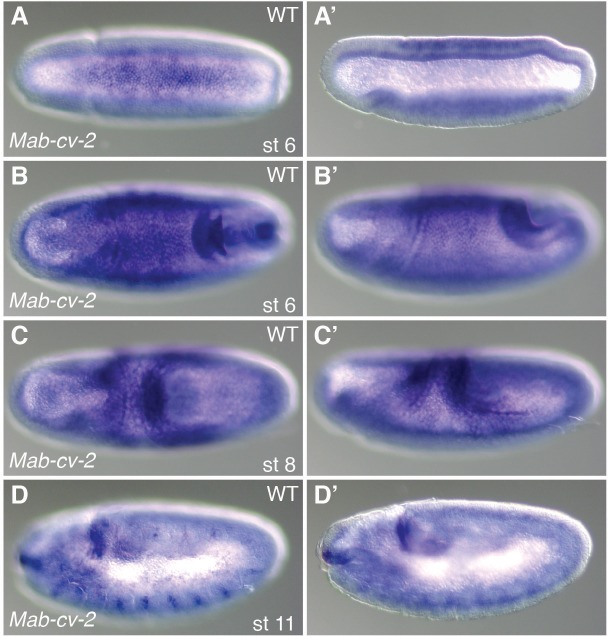
Figure 4—figure supplement 3. Expression profile of Mab-cv-2.

Figure 4—figure supplement 3.

(AD) Mab-cv-2 expression in Megaselia embryos at early gastrulation (A), late gastrulation (B), during germ band retraction (C), and at the end of germ band retraction (D). (A, B, C) Dorsal views with anterior left. (A’, B’, C’, D, D’) Lateral views with dorsal up and anterior left.
Figure 4—figure supplement 4. Mab-cv-2 promotes amnion specification.

Figure 4—figure supplement 4.

(A, B) Mab-zen and Mab-eve expression at early gastrulation with some embryos showing reduced amnion after Mab-cv-2 knockdown (3/9) (A), and after Mab-egr/cv-2 knockdown (2/9) (B). Dorsal views with anterior left.
Figure 4—figure supplement 5. Regulation of Mab-cv-2 is largely independent of Mab-doc/doc2.

Figure 4—figure supplement 5.

(A, B) Mab-cv-2 expression at early gastrulation in control (A) and after Mab-doc/doc2 knockdown (B). Dorsal views with anterior left.