. 2017 Jan 10;6:e20983. doi: 10.7554/eLife.20983

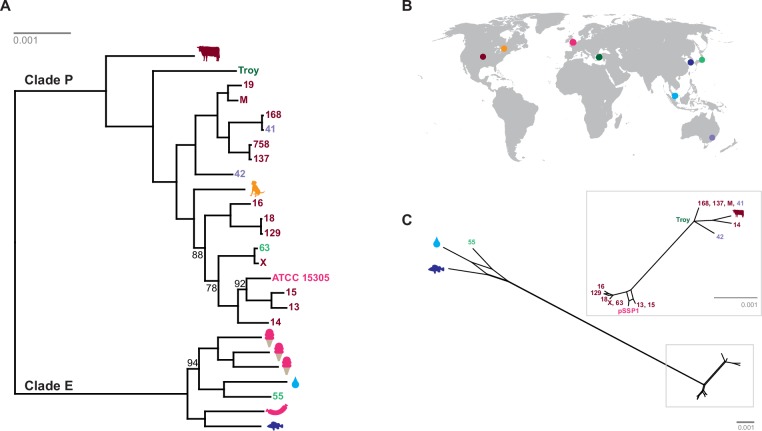
Figure 4. Phylogenetic analysis of Staphylococcus saprophyticus.

(A) Maximum likelihood tree estimated using RAxML (Stamatakis, 2014) (Figure 4—source data 3) from an alignment of S. saprophyticus genomes (Figure 4—source data 1, Figure 4—source data 2). Bootstrap values less than 100 are labeled. Silhouettes indicate bacterial sample source. Isolates without silhouettes are from human clinical samples isolated from urine. Color corresponds to country of isolation as seen on the map. Full sample descriptions are in Supplementary file 1H. (B) Source countries of bacterial samples. (C) Neighbor-net network of S. saprophyticus plasmid sequences (Figure 4—source data 4) related to pSST1 created in SplitsTree4 (Huson and Bryant, 2006). The boxed inset is an enlarged version of the portion of the network from Clade P isolates. Some S. saprophyticus isolates do not encode pSST1-like plasmids, and therefore, they are not included in the network. Starts and stops of recombinant regions of the alignment can be found in Figure 4—source data 5.

DOI: http://dx.doi.org/10.7554/eLife.20983.025

Figure 4—source data 1. S. saprophyticus whole genome alignment.
DOI: 10.7554/eLife.20983.026
Figure 4—source data 2. S. saprophyticus whole genome alignment trimmed with trimal.
DOI: 10.7554/eLife.20983.027
Figure 4—source data 3. Maximum likelihood phylogenetic analysis of trimmed S. saprophyticus alignment with RAxML.
DOI: 10.7554/eLife.20983.028
Figure 4—source data 4. S. saprophyticus plasmid alignment trimmed with trimal.
elife-20983-fig4-data4.fasta (208.8KB, fasta)
DOI: 10.7554/eLife.20983.029
Figure 4—source data 5. Recombinant fragments detected with BratNextGen in S. saprophyticus alignment.
DOI: 10.7554/eLife.20983.030

Figure 4.

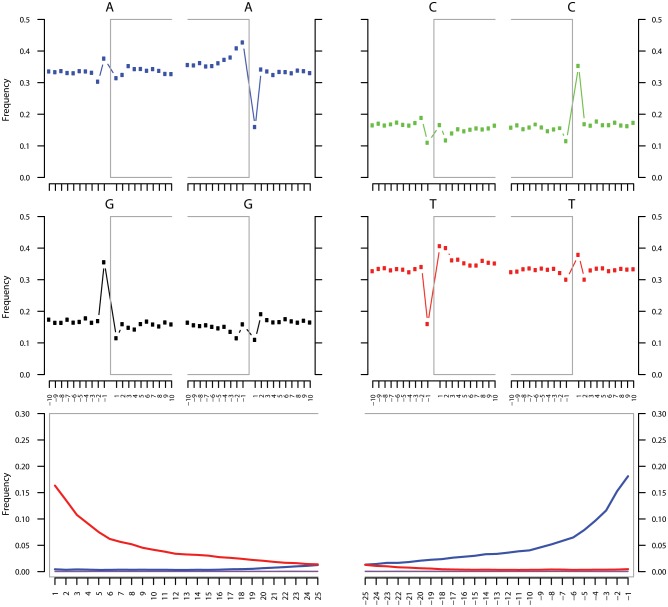
Figure 4—figure supplement 1. Ancient DNA damage assessment of S. saprophyticus.

Figure 4—figure supplement 1.

Damage profiles of non-UDG treated (‘nonU’) reads from a pooled NOD1_nonU and NOD2_nonU data set (total of 1,565,548 trimmed reads >24 bp) mapping to S. saprophyticus strain ATCC 15305. Paired end reads were mapped using bwa (Li and Durbin, 2009) with default settings and duplicates were removed with samtools rmdup (Li et al., 2009). Damage profiles were generated using mapDamage2 (Jonsson et al., 2013).

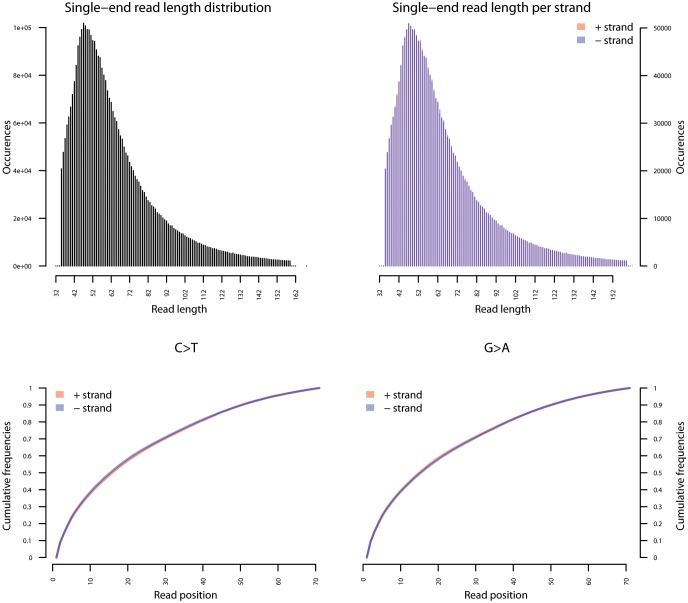
Figure 4—figure supplement 2. Fragment length distribution (FLD) for S. saprophyticus ATCC 15305.

Figure 4—figure supplement 2.

All nodule shotgun libraries (Nod1_1h-UDG, Nod1_1h-nonU, Nod2-UDG, Nod2-nonU) were pooled, reads were restricted to a minimum length of 35 bp and mapping quality of 30 and all duplicates removed both within and between libraries. The fragment length distribution of the remaining 3,904,552 reads was visualized using mapDamage2 (Jonsson et al., 2013).

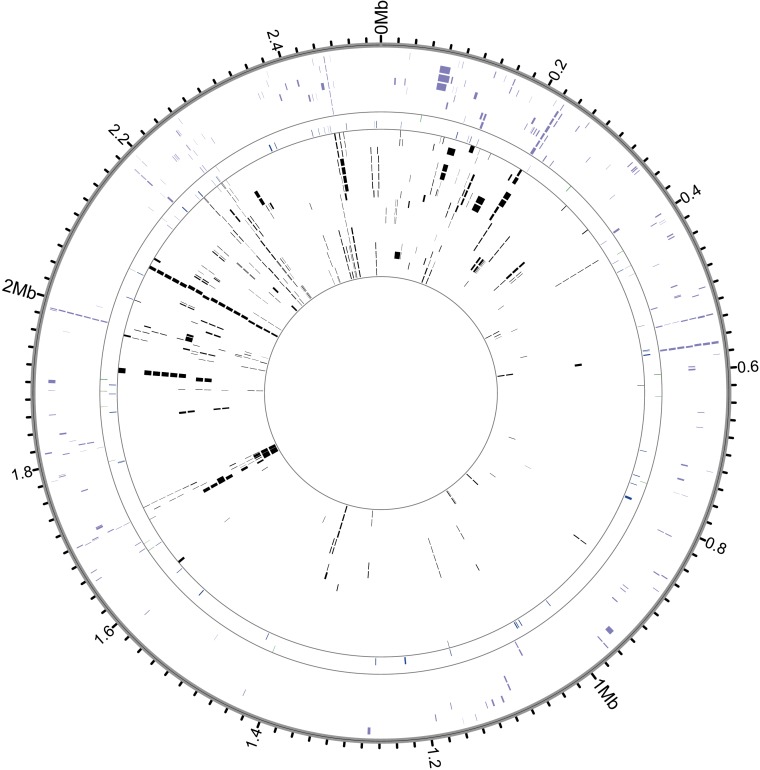
Figure 4—figure supplement 3. Genome coverage plots for pooled nodule shotgun libraries.

Figure 4—figure supplement 3.

S. saprophyticus (NC_007350), average coverage 298.6X. All reads were restricted to minimum length of 35 bp and minimum map quality 30 with all duplicates removed. Figures depict coverage of the genome in 100 bp blocks across references. Concentric grey circles demarcate increments of 50X coverage in both plots.

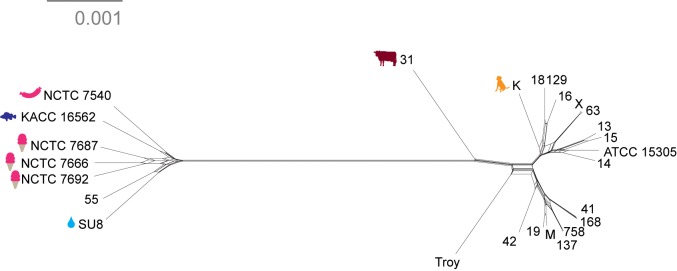
Figure 4—figure supplement 4. Neighbor net network of core genomes.

Figure 4—figure supplement 4.

Networks created in SplitsTree v 4 (Huson and Bryant, 2006) of S. saprophyticus. The networks recapitulate the structure of maximum likelihood trees (Figure 4).

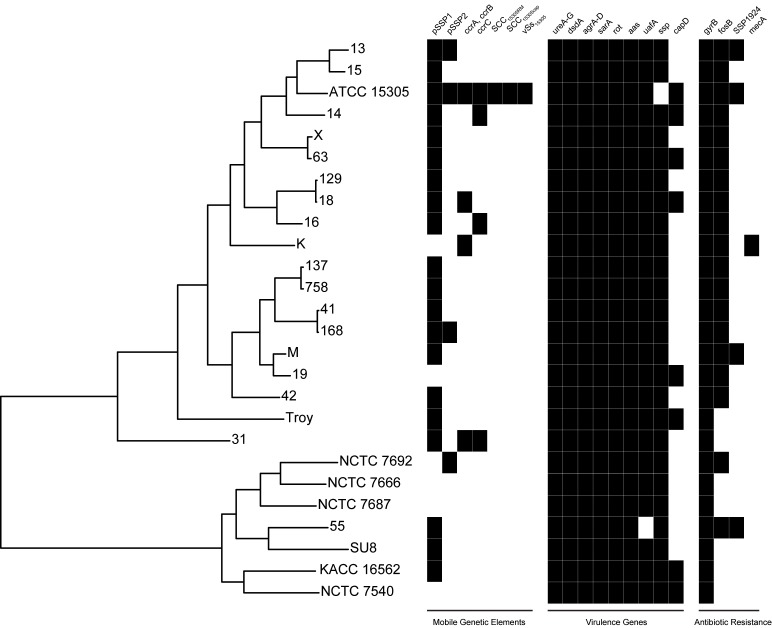
Figure 4—figure supplement 5. Presence of mobile genetic elements, virulence genes, and antibiotic resistance in S. saprophyticus.

Figure 4—figure supplement 5.

Novobiocin resistance is conferred by a glycine at position 85 and lysine at position 140 (Vickers et al., 2007), which is present in all S. saprophyticus genomes examined here. SSP1924 and fosB confer streptomycin and fosfomycin resistance, respectively, and are encoded in vSs15305 in the ATCC 15305 reference genome (Kuroda et al., 2005). While none of the other isolates encode the entire genomic island, fosB and SSP1924 are found in isolates from both Clade P and Clade E. The canine isolate (K) harbors SCCmec containing mecA conferring methicillin resistance that has been identified in human clinical isolates of S. saprophyticus (Higashide et al., 2008).

Figure 4—figure supplement 6. Recombinant regions detected by BratNextGen in S. saprophyticus.

Figure 4—figure supplement 6.

Each circle in the figure represents one isolate. Regions with significant evidence for recombination are shown as black or colored blocks. Black ticks mark intervals of 20 kb, and positions are in reference to ATCC15305. 17.9% of the alignment is recombinant in at least one strain. After removing fragments associated with known MGEs, 15.0% of sites are recombinant in the core genome. Isolates are colored according to clade (purple- Clade E, green- bovine, blue- Troy, black- Clade P).