

Abstract
Sterile alpha motif (SAM) and Histidine-Aspartate (HD)-domain containing protein 1 (SAMHD1) is a triphosphohydrolase that converts deoxyribonucleoside triphosphates (dNTPs) into deoxyribonucleosides and triphosphates. SAMHD1 exists in multiple states. The monomer and apo- or GTP-bound dimer are catalytically inactive. Binding of dNTP at allosteric site 2 (AS2), adjacent to the GTP-binding, allosteric site 1 (AS1), induces formation of tetramer, the catalytically active form. We have developed an enzyme kinetic assay, tailored to control specific dNTP binding at each site, allowing us to determine the kinetic binding parameters of individual dNTPs at both the AS2 and catalytic site for all possible combinations of dNTP binding at both sites. Here, we show that the apparent Km values of dNTPs at AS2 vary, in order of dCTP<dGTP<dATP<dTTP. Interestingly, dCTP binding at AS2 significantly reduces the dCTP hydrolysis rate, which is restored to a rate comparable to that of other dNTPs upon dGTP, dATP or dTTP binding at AS2. Strikingly, a phosphomimetic mutant, Thr592Asp SAMHD1 as well as phospho-Thr592, show a significantly altered substrate specificity, with the rate of dCTP hydrolysis being selectively reduced regardless of which dNTP binds at AS2. Further, cyclin A2 binding at the C-terminus of SAMHD1 induces disassembly of the SAMHD1 tetramer, suggesting an additional layer of SAMHD1 activity modulation by cyclin A2/CDK2 kinase. Together, our results reveal multiple allosteric mechanisms for controlling the rate of dNTP destruction by SAMHD1.
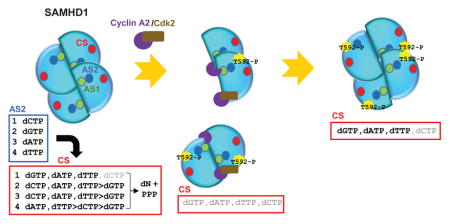
Graphical abstract
Deoxyribonucleoside triphosphates (dNTPs) are the building blocks of DNA and are essential for DNA replication and repair. The cellular concentrations of dNTP change dramatically during the cell cycle, increasing up to 6-fold in yeast and 18-fold in mammalian cells during the S-phase of the cell cycle to support efficient DNA replication (1, 2). However, abnormally high or imbalanced relative concentrations of each dNTP can increase the rate of mutation during DNA replication by altering proof-reading and fidelity of the polymerases (3–7). On the other hand, insufficient levels of dNTP pools reduce the rate of DNA replication and trigger an intra-S phase checkpoint (8, 9). Defects in the S-phase checkpoint cause DNA damage and apoptosis, due to error accumulation (10).
The proper level of the total dNTP pool is dynamically maintained by ribonucleotide reductase (RNR), which catalyzes the conversion of ribonucleotides to deoxyribonucleotides by an elegant allostery that involves dNTP binding at a specificity site (11). The binding of one type of dNTP at the specificity site alters the active site such that it favors binding of other ribonucleotides (12, 13). The cellular level of RNR is actively controlled and is maximal at the S-phase, when high concentrations of dNTP are needed for DNA replication (14, 15).
SAMHD1, a deoxyribonucleoside triphosphate triphosphohydrolase (dNTPase), adds another dimension to maintaining an appropriate balance of dNTP pools in cells. SAMHD1 catalyzes the conversion of dNTPs to deoxyribonucleosides and triphosphates (16, 17). SAMHD1 and RNR protein levels are intricately controlled and inversely correlated in cycling cells, with the level of SAMHD1 being lower during the S-phase and increasing at the G1 and G0 phases (18).
The enzymatic activity of SAMHD1 is regulated by nucleoside triphosphate binding at two adjacent allosteric sites, which induces formation of a dimer of dimer, the catalytically active form of the enzyme (19). X-ray crystal structures of the SAMHD1 tetramer have revealed the structural basis of nucleoside triphosphate-induced tetramerization and dNTP catalysis (20, 21). Allosteric site 1 (AS1) is configured to specifically bind GTP or dGTP, with AS1 residues providing a total of five hydrogen bonds to the guanine base of these molecules (22–24). On the other hand, allosteric site 2 (AS2) is relatively loosely configured and accommodates any dNTP, with distinct hydrogen bonding patterns between AS2 residues and dNTP bases (22–24). Additionally, AS1 and AS2 are adjacent to each other, and the triphosphates of the GTP/dNTPs occupying the sites are coordinated by Mg2+ and form multiple hydrogen bonding interactions with residues from both sites, constituted by three monomers; consequently, each SAMHD1 tetramer binds a total of 8 nucleoside triphosphates (20–24). These interactions allow formation of a stable SAMHD1 tetramer that can hydrolyze dNTPs for a long period of time without disassembling and exchanging the dNTP bound at AS2 (25). Current crystal structures suggest that dNTP binding at the catalytic site (CS) is mainly via hydrogen bonding and ionic interactions between the triphosphate of the dNTP and active site residues, implying promiscuity of the catalytic site (22).
The most well recognized and intensively studied biological function of SAMHD1 is HIV-1 restriction. SAMHD1 executes this function by altering dNTP pools such that they are below the levels required for efficient reverse transcription by HIV reverse transcriptase in immune cells (26–29). SAMHD1 has a reported RNAse activity that restricts HIV-1 infectivity (30). However, this notion was recently challenged and requires further investigation (31). Mutation of catalytic residues or knock-down of SAMHD1 results in enhanced HIV-1 replication (32). The anti-retroviral activity of SAMHD1 can be modulated by phosphorylation at Thr592 by the cyclin A2/CDK2 complex (33–37). A phosphomimetic mutant of SAMHD1 cannot restrict HIV-1 infection, and active phosphorylation of Thr592 was observed in permissive cells. The structural basis for phosphorylation-dependent suppression of HIV-1 restriction by SAMHD1 was recently illustrated by independent crystallographic studies from two groups (38, 39). Thr592Glu and phospho-Thr592 SAMHD1 tetramers show conformational changes with rearrangement of the dimers in the tetramer, which results in short-lived forms of the tetramer and reduces catalytic activity compared to wild type (WT) protein. On the other hand, several studies suggest that phosphorylation does not change the overall dNTPase activity of SAMHD1, neither in vitro nor in vivo (34, 35).
Here, we investigated the kinetic parameters of individual dNTPs binding at AS2 and of GTP binding at AS1 and characterized the substrate specificities of SAMHD1 tetramers induced by different GTP/dNTP combinations. We show that the apparent Km values of dNTPs binding at AS2 are in the range of 2 – 20 μM. Strikingly, GTP/dCTP-induced SAMHD1 tetramer lacks dCTPase activity at physiological concentrations of the substrates. Further, we show that cyclin A2/CDK2 down-modulates the dNTPase activity of SAMHD1 in two distinct manners. Firstly, a phosphomimetic mutant of SAMHD1 and phospho-Thr592 show selectively suppressed dCTPase activity for all possible GTP/dNTP-induced tetramers. Secondly, cyclin A2 binding at the C-terminus of SAMHD1 induces dissociation of tetramer to inactive dimer and monomer. Together, our data provide mechanistic insight into how the dNTPase activity of SAMHD1 is modulated by different allosteric activators and by post-translational modification.
EXPERIMENTAL PROCEDURES
Protein Purification
The N-terminally His6-tagged full-length WT SAMHD1, T592D and L620A/F621A SAMHD1 and thioredoxin-His6-SAMHD1-CTD (the C-terminal residues 605–626) and cyclin A2/CDK2 complex were expressed in E. coli and purified as previously described (40). CDK-activating kinase complex comprising cyclin H, GST-CDK7, and MAT1 were expressed and purified from SF21 cells, co-infected with recombinant baculoviruses at individual multiplicity of infection of 2 for 40 h, as described previously (41). GST-cyclin A2/CDK2 complex was expressed and purified from SF21 cells in a similar manner. Aliquots of proteins in a buffer containing 25 mM sodium phosphate, pH 7.5, 150 mM NaCl, 1 mM Dithiothreitol, 10% glycerol, and 0.02% sodium azide were flash frozen with liquid nitrogen and stored at −80 °C.
Enzyme Kinetic Assays
Sequential activation of SAMHD1 was carried out as depicted in Figure 1A, with the specific dNTP added at each step varying based on the experimental goal. As shown in Figure 1A, typically, SAMHD1 at a concentration of 5.6 μM was mixed with GTP at an initial concentration of 2500 μM, Step 1. The concentrations of SAMHD1 and GTP after Step 1 were 3.36 μM and 1,000 μM, respectively (Preactivation Step). The SAMHD1/GTP mixture was then mixed with dATP at an initial concentration of 125 μM, Step 2. Pipetting and mixing were performed with an automatic multichannel liquid dispenser in a 96 well plate format (Biomek3000, Beckman Coulter, Inc). Each step had 65 sec of mixing and dispensing time. The concentrations of SAMHD1, GTP, and dATP after Step 2 were 2.0 μM, 600 μM, and 50 μM, respectively (Tetramerization Step). The reaction mixture was incubated for 60 sec, pause time. After the SAMHD1/GTP/dATP mixture was diluted with reaction buffer by 10-fold at Step 3, it was mixed with dCTP at an initial concentration of 111 μM, resulting in an additional 10-fold dilution (dNTP hydrolysis Step). The final concentrations of SAMHD1, GTP, dATP, and dCTP were 0.02 μM, 6.0 μM, 0.5 μM, and 100 μM, respectively, at the dNTP hydrolysis Step. A buffer containing 20 mM Tris·HCl, pH 7.8, 50 mM NaCl, 5 mM MgCl2, 0.02% sodium azide, and 5% glycerol was used throughout the reaction. The reaction mixtures were quenched with EDTA at a final concentration of 20 mM after specific time intervals, and the reaction mixtures were separated by reversed-phase high performance liquid chromatography (HPLC) as previously described (19, 20). The products were quantified by peak integration of the absorbance trace at UV 260 nm. The data were fitted with Michaelis-Menten kinetics,
Figure 1. Sequential activation of SAMHD1 with nucleoside triphosphates.

A. Schematic of the enzyme kinetic assay. SAMHD1 monomer and dimers are converted to GTP-bound SAMHD1 dimer (Step 1), upon GTP binding at allosteric site 1 (AS1); subsequent addition of a specific dNTP induces SAMHD1 tetramerization (Step 2), with the dNTP binding at allosteric site 2 (AS2) (dATP is shown in this example scheme); after a short pause (typically 60 s), the mixture is diluted 100-fold, and substrate dNTP is added (Step 3), resulting in hydrolysis of the dNTP as it binds at the catalytic site (CS) (dCTP is shown in this example scheme); a short time after Step 3 (ranging from 8 to 32 minutes), EDTA (20 mM final concentration) is added, and the products are separated by HPLC (red trace on right, this example shows the products from a mixture with all dNTPs added at Step 3, rather than just dCTP as illustrated in the schematic). In this scheme, the concentration of GTP at Step 1, or dNTP at Step 2, can be varied to determine the Km at each allosteric site. The concentration of substrate (Step 3) can also be varied, with fixed concentrations of GTP at Step 1 and dNTP at Step 2, to determine Km and Vmax at the catalytic site for dNTP hydrolysis. The concentrations of SAMHD1, GTP, dATP and dCTP are indicated after initial introduction steps and at the final step. B. The rate of dCTP hydrolysis is independent of pause time after Step 2. Sequential activation of SAMHD1 was performed with GTP at Step 1 and dATP at Step 2, and the rate of dCTP hydrolysis was determined. The final concentrations of SAMHD1, GTP, dATP and dCTP were 0.02 μM, 6.0 μM, 0.5 μM and 100 μM, respectively. The pause time was varied between 60 and 420 sec. The pause time (abscissas) is plotted against the rate of dC formation (ordinate). The averages of two independent experiments are shown. GTP/dATP/dCTP on the upper left corner of the panel indicates that AS1, AS2 and CS are occupied with GTP, dATP and dCTP, respectively. C. The rate of dC formation was determined by plotting dC production against reaction time with various concentrations of dATP present at Step 2 (note GTP/◀dATP/dCTP on the upper left corner of the panel). The final concentrations of SAMHD1, GTP and dCTP were 0.02 μM, 6.0 μM, and 100 μM, respectively. D. The rates of dATP hydrolysis (dA rate, s−1) were determined with GTP present (black circles) or not (red squares) at Step 1 and increasing concentrations of dGTP present at Step 2. The final concentration of dATP substrate was 100 μM. The dA formation rate at a specific dGTP concentration was determined from the slope of a plot similar to that shown in C. E. The rates of dCTP hydrolysis were determined with increasing concentrations of GTP at Step 1. The concentrations of dATP at Step 2 and dCTP at Step 3 were 50 μM and 100 μM, respectively. The data were fitted with Michaelis-Menten kinetics. The value of Km,AS1 was 47 ± 6.3 μM and the maximal rate of dCTP hydrolysis at 100 μM was 1.1 ± 0.1 s−1.
| (Eq.1) |
where v is the reaction rate, Vmax represents the maximum rate, and Km is the dNTP concentration at half maximal rate. The data were analyzed with Prism 7 (GraphPad Software, Inc.)
Tetramerization Assays
Mixtures of SAMHD1 (0.5 μM), GTP and dATP, as indicated, were injected into an analytical Superdex 200 10/300 GL size exclusion column (GE Healthcare) at a flow rate of 0.5 mL/min. The column was pre-equilibrated with 20 mM Tris-HCl, pH 7.8, 50 mM NaCl, 5 mM MgCl2, 5% glycerol and 0.02%sodium azide along with the indicated concentrations of GTP and dATP. The protein elution from the size exclusion column was detected with an in-line fluorescence detector, as previously described (19). Alternatively, mixtures of SAMHD1 variants, GTP, dATP, cyclin A2, and cyclin A2/CDK2, as indicated, were applied to an analytical Superdex 200 Increase 10/300 GL size exclusion column (GE Healthcare) at a flow rate of 0.5 mL/min in the same buffer. All proteins were at 14 μM, and elution was detected with absorbance at wavelength 280 nm. The elution was collected in 0.5 mL fraction, which were concentrated, separated by SDS-PAGE, and analyzed by Coomassie blue staining.
Chemical Cross-linking Assays
Sequential activation of SAMHD1 was performed as described in Enzyme Kinetic Assays. SAMHD1 proteins at 56 μM were initially mixed with 2,500 μM GTP, then with 125 μM dATP. Activated tetramers were mixed with dCTP at a final concentration of 100 μM in 200 μL volume. The reaction mixture (25 μL) was subjected to cross-linking with 2.5 mM glutaraldehyde for 6 min after 8, 16, 24 or 32 min of enzyme catalysis reaction. The chemical cross-linking was quenched with 1 M TrisHCl, pH 8.0. The mixtures were separated by SDS-PAGE and analyzed by Western blot. Monomer and tetramer were detected with anti-His antibody (Sigma).
Phosphorylation of SAMHD1
Typically, cyclin A2/CDK2 was pre-incubated with CDK activation kinase complex, cyclin H/CDK7/MAT1, at a ratio of 1:1 (mole/mole) for 2 h at 15 °C in a kinase buffer containing 25 mM HEPES pH 7.5, 100 mM NaCl, 5 mM MgCl2, 0.5 mM tris(2-carboxyethyl)phosphine, 2 mM ATP and 0.02% sodium azide. SAMHD1 was added to the cyclin A2/CDK2 kinase at a ratio of 16:1 for 12 h at 15 °C in the same buffer. Phospho-Thr592 SAMHD1 was purified over a Mono Q 10/100GL column (GE Healthcare) at pH 7.5 using 0–1 M NaCl gradient. The phosphorylation at Thr592 was confirmed by Western blotting with anti-phospho-Thr592 antibody (a gift from Jacek Skowronski at Case Western Reserve University) and in-gel trypsin digestion combined with mass spectrometry (data not shown).
GST Pulldown
GST-cyclin A2/CDK2 were incubated with GST beads for 3 h, with shaking, in PBS buffer containing 0.5% Nonidet P-40 and 2 mg/mL BSA. Excess protein was washed away with the same buffer. SAMHD1 proteins were incubated with these GST beads for 3 h with shaking. After washing three times with the buffer, proteins were eluted with 20 mM glutathione, separated by SDS-PAGE and analyzed by Western blotting with anti-GST (Sigma) and anti-T7 (Millipore) antibody.
RESULTS
Sequential activation of SAMHD1 with GTP and dNTP for enzyme catalysis
Several reports have shown that SAMHD1 exists in several different states: monomer and dimer in apo-form, GTP-bound dimer and GTP/dNTP-bound tetramer (16, 19–21, 24, 25). GTP specifically binds at allosteric site 1 (AS1), and any dNTP can bind at the adjacent allosteric site 2 (AS2) (22–24). The GTP/dNTP-bound tetramer, the catalytically active form of the enzyme, is stable such that it can be isolated by subjecting the mixture of GTP, dNTP and SAMHD1 to size exclusion column chromatography and does not exchange the dNTP bound at AS2 during substrate turnover (19, 25). Using this knowledge, we designed a stepwise protocol to assemble GTP/dNTP tetramer (Figure 1A, see the Experimental Procedures for detail). By controlling each assembly step, the apparent Km value of GTP binding at AS1 (Km,AS1), and the apparent Km values of any dNTPs binding at AS2 (Km,AS2(dNTP)) can be determined. Further, the dNTP that occupies the catalytic site can be controlled at the dNTP Hydrolysis Step by varying substrate concentrations at Step 3, allowing determination of the apparent Km value at the catalytic site (Km,AS2(dNTP)/CS(dNTP)) and the maximal rate constant (Vmax,AS2(dNTP)/CS(dNTP)) for each SAMHD1 tetramer activated by a particular GTP/dNTP combination. Since the final concentrations of GTP supplied during Step 1 and the dNTP supplied during Step 2 are extremely low (< 6 μM) compared to the concentration of dNTP supplied at Step 3 (100 μM, dCTP in Figure 1A) and because the tetramer is stable for a long period of time without exchanging dNTP at AS2, the tetramer is unlikely to disassemble and reassemble during the short period of the dNTP Hydrolysis Step. We validated these assumptions by characterizing the system in detail.
To confirm that the rate of tetramerization is not rate-limiting, we varied the pause time after the Tetramerization Step (Figure 1A) then assayed for dCTP hydrolysis. The rates of dCTP hydrolysis were practically constant for all pause times tested (Figure 1B). Thus, for all subsequent experiments, we used a pause time of 60 seconds. Of note, the concentration of dATP at the Tetramerization Step was 50 μM, thus converting the majority of SAMHD1 into tetramer; the concentration of dCTP at the Hydrolysis Step was 100 μM, which is close to the half maximal rate of dCTP hydrolysis (see below). Thus, this experimental condition should be optimal to detect small variations in kinetics. When the concentration of dATP at the Tetramerization Step was varied from 0 – 50 μM, with fixed concentrations of GTP (1000 μM) at the Preactivation Step and dCTP (100 μM) at the Hydrolysis Step, the production of dC was linear over time. This confirms that the SAMHD1 tetramer is stable and active for the duration of the assay (Figure 1C).
Since AS1 is specific for guanine base-containing nucleotides and can bind either GTP or dGTP, we wanted to confirm that dGTP introduced at Step 2 would not replace GTP bound at AS1. When the sequential activation of SAMHD1 was performed with a fixed concentration of GTP (1000 μM) at the Preactivation Step and increasing concentrations of dGTP at the Tetramerization Step, the dATPase activity of the SAMHD1 tetramer nicely fit Michaelis-Menten kinetics, yielding a Km,AS2(dGTP) value of 2.8 ± 0.4 μM (Figure 1D). However, a similar experiment without the GTP-Preactivation Step showed non-detectable dATP hydrolysis at low concentrations of dGTP (Figure 1D). Further, the tetramer induced only by dGTP had far less dATPase activity than the GTP/dGTP-induced tetramer. These results suggest that the GTP-bound SAMHD1 dimer is stable and competent to form a tetramer, with dGTP provided at Step 2, binding at AS2.
We next determined the apparent Km constant of GTP at AS1, by varying the concentrations of GTP at the Preactivation Step, with fixed concentrations of dATP at the Tetramerization Step and of dCTP at the dNTP Hydrolysis Step (Figure 1E). The value of Km,AS1 was determined to be 47 ± 6.3 μM for GTP. Since the concentration of GTP at the Preactivation Step was typically 1000 μM, we expect that a vast majority of SAMHD1 proteins have GTP bound at AS1 following Step 1. Further, GTP introduced at the Preactivation Step, despite being at a substantially higher concentration than the dNTPs used in the subsequent steps, is not expected to compete for AS2 and the catalytic site since these sites bind dNTPs exclusively, as evidenced by our previous biochemical and structural data (23).
The Km values of dNTPs at AS2 are within physiological concentrations of dNTPs
After having established and validated our kinetic scheme (Figure 1A), we next determined the apparent Km constant for dNTPs at AS2 (Km,AS2(dNTP)). The hydrolysis rates of individual dNTPs, namely dGTP, dCTP, dATP, and dTTP, were measured with increasing concentrations of dGTP at the Tetramerization Step (Figure 2A). The apparent Km values of dGTP were essentially the same (approx. 3–4 μM) regardless of which dNTP was introduced at the Hydrolysis Step (Table 1). These results suggest that tetramerization is independent of dNTP hydrolysis, further confirming the validity of our kinetic scheme. The apparent Km values of dCTP, dATP and dTTP for AS2 were also measured, in a similar manner, and were largely independent of which dNTP was introduced at the Hydrolysis Step (Figure 2B–D, Table 1). The order of apparent Km constant at the AS2 is dCTP < dGTP < dATP < dTTP. Interestingly, the values are within physiological concentrations of dNTPs in cycling cells, which is in the range of 1 – 40 μM (42–44).
Figure 2. Michaelis-Menten kinetics of dNTPase activity of SAMHD1 with all possible pairs of nucleoside triphosphates bound at the allosteric sites.

A–D. The hydrolysis rates of dGTP (green circles), dCTP (red squares), dATP (blue triangles), and dTTP (purple inverted triangles), each at 100 μM final concentration, were determined with increasing concentrations of dGTP (A), dCTP (B), dATP (C) and dTTP (D) at Step 2 with a fixed concentration of GTP (1000 μM) at Step 1. The experiments were performed as described in Figure 1A and 1C. AS1/AS2/CS indicates that the allosteric site 1, allosteric site 2 and catalytic site are occupied with the individual nucleoside triphosphate noted below each. The data were fitted with Michaelis-Menten kinetics as described in the Experimental Procedures. The values of Km,AS2(dGTP), Km,AS2(dCTP), Km,AS2(dATP), and Km,AS2(dTTP) for each dNTP substrate are summarized in Table 1.
Table 1.
Km,AS2(dNTP)1 for dNTP bound at allosteric site 2 (AS2).
| Substrate | dGTP | dCTP | dATP | dTTP |
|---|---|---|---|---|
| Km,AS2(dGTP) | 3.7 ± 0.8, 3.1 ± 0.2 | 3.3 ± 0.6, 7.7 ± 0.9 | 2.8 ± 0.4, 3.2 ± 0.2 | 3.5 ± 0.4, 3.9 ± 0.3 |
| Km,AS2(dCTP) | 2.1 ± 0.2, 2.9 ± 0.3 | 1.6 ± 0.4, 1.5 ± 0.4 | 1.6 ± 0.2, 1.5 ± 0.4 | 2.0 ± 0.3, 1.3 ± 0.3 |
| Km,AS2(dATP) | 6.5 ± 0.6, 3.4 ± 0.7 | 5.6 ± 1.1, 7.8 ± 1.7 | 4.1 ± 0.9, 8.8 ± 0.6 | 7.7 ± 2.6, 4.9 ± 0.8 |
| Km,AS2(dTTP) | 13.5 ± 3.3, 18.9 ± 3.8 | 22.5 ± 5.7, 28.9 ± 7.2 | 14.2 ± 2.3, 19.5 ± 3.4 | 15.3 ± 3.2, 13.4 ± 2.6 |
Two independent experiments, each with SAMHD1 purified separately, were performed as described in Figure 2 and the values for each are shown. The unit is μM. The error bars indicate the curve fit error, calculated by the Graphpad software.
The apparent Km constants of dATP and dTTP binding at AS2 were previously reported, and the values are much smaller (0.1 – 0.15 μM) than what we observed in our assays, while the maximal rates of dNTP catalysis are comparable in both assays (~ 1 s−1) (45). The discrepancies in Km are likely due to differences in the experimental set-up. In their assays, GTP and dNTP were mixed with SAMHD1 in a single reaction.
GTP/dCTP-induced SAMHD1 tetramer lacks dCTPase activity at physiological concentrations of dCTP
We extended our kinetic studies to dNTP binding and hydrolysis at the catalytic site. We first formed GTP/dGTP tetramer and measured the apparent Km constant and catalytic rates (Vmax) for each individual dNTP (Figure 3A). Kinetic parameters for GTP/dCTP-, GTP/dATP-, and GTP/dTTP-induced tetramers were also determined (Figure 3B–3D). Several features of dNTP binding at the catalytic site were discerned (Table 2). The Km value of dGTP at the catalytic site varied by as much as 7-fold, depending on the identity of the dNTP bound at AS2. However, the apparent Km values for both dATP and dTTP at the catalytic site were similar across all GTP/dNTP-induced SAMHD1 tetramers. Strikingly, for the GTP/dCTP-induced SAMHD1 tetramer, dCTP binding at the catalytic site could not be fitted with Michaelis-Menten kinetics since the data did not show a hyperbolic response curve (Figure 3B). At concentrations below 50 μM, the hydrolysis rate of dCTP was extremely slow. At higher concentrations of dCTP, the hydrolysis rate was similar to those of other dNTPs. The rates of dCTP hydrolysis for other GTP/dNTP-induced SAMHD1 tetramer were comparable to the rates of dATP and dTTP hydrolysis (Figure 3A, C and D). Kinetic parameters for all possible pairs of dNTP at AS2 and catalytic site are summarized in Table 2. Of note, the apparent Km constants for dNTP at the catalytic site are higher than those for dNTP at AS2 by a factor of 1–2 fold. Thus, dNTPs carried over from the Tetramerization Step to the dNTP Hydrolysis Step would not be a significant source of competition.
Figure 3. The type of deoxyribonucleoside triphosphate bound at the allosteric site 2 determines the substrate specificity of SAMHD1.

A. The rates of dGTP (green circles), dCTP (red squares), dATP (blue triangles) and dTTP (purple inverted triangles) hydrolysis were individually determined, with increasing concentrations of each dNTP at Step 3 and fixed concentrations of dGTP (50 μM) at Step 2 and GTP (1000 μM) at Step 1 (GTP/dGTP/◀dNTP). AS1/AS2/CS at the top of each figure indicates the allosteric site 1, allosteric site 2 and catalytic site are occupied with the individual nucleoside triphosphates noted below each. The data were fitted with Michaelis-Menten kinetics. B–D. The rates of dGTP, dCTP, dATP and dTTP hydrolysis were individually determined with a fixed concentration (50 μM) of dCTP (B), dATP (C) or dTTP (D) at Step 2. The values of Km,AS2(dNTP),CS(dNTP) and Vmax,AS2(dNTP),CS(dNTP) for all possible pairs at the allosteric site 2 (AS2) and catalytic site (CS) are summarized in Table 2.
Table 2.
Km,AS2(dNTP)/CS(dNTP)1, and Vmax,AS2(dNTP)/CS(dNTP)2 for all possible pairs of deoxynucleoside triphosphate types bound at allosteric site 2 (AS2) and catalytic site (CS).
| Substrate | dGTP | dCTP | dATP | dTTP |
|---|---|---|---|---|
| Km, AS2(dGTP),CS(dNTP) | 79 ± 16, 85 ± 4 | 105 ± 19, 156 ± 8 | 107 ± 16, 90 ± 1 | 126 ± 18, 123 ± 32 |
| Km, AS2(dCTP),CS(dNTP) | 12 ± 5, 13 ± 3 | N/D, N/D3 | 71 ± 10, 99 ± 22 | 156 ± 15, 203 ± 49 |
| Km, AS2(dATP),CS(dNTP) | 76 ± 9, 70 ± 21 | 79 ± 5, 63 ± 7 | 99 ± 4, 79 ± 8 | 102 ± 5, 116 ± 13 |
| Km, AS2(dTTP),CS(dNTP) | 82 ± 12, 72 ± 5 | 211 ± 45, 208 ± 20 | 99 ± 9, 73 ± 10 | 121 ± 15, 136 ± 28 |
|
| ||||
| Vmax,AS2(dGTP),CS(dNTP) | 0.37 ± 0.03, 0.33 ± 0.02 | 1.7 ± 0.2, 1.7 ± 0.1 | 1.7 ± 0.1, 1.4 ± 0.1 | 2.1 ± 0.1, 1.9 ± 0.2 |
| Vmax,AS2(dCTP),CS(dNTP) | 0.36 ± 0.02, 0.32 ± 0.02 | N/D, N/D3 | 1.8 ± 0.1, 1.6 ± 0.2 | 2.9 ± 0.1, 2.4 ± 0.3 |
| Vmax,AS2(dATP),CS(dNTP) | 0.33 ± 0.02, 0.30 ± 0.03 | 1.7 ± 0.1, 1.4 ± 0.1 | 1.8 ± 0.1, 1.5 ± 0.1 | 1.9 ± 0.1, 1.9 ± 0.1 |
| Vmax,AS2(dTTP),CS(dNTP) | 0.32 ± 0.02, 0.28 ± 0.02 | 1.9 ± 0.2, 1.7 ± 0.1 | 1.6 ± 0.1, 1.3 ± 0.1 | 1.7 ± 0.1, 1.9 ± 0.2 |
Two independent experiments, each with SAMHD1 purified separately, were performed as describe in Figure 3 and the values for each are shown. The units of Km,AS2(dNTP)/CS(dNTP) and Vmax,AS2(dNTP)/CS(dNTP) are μM and s−1, respectively. The error bars indicate the curve fit error, calculated by the Graphpad software
The kinetic parameters were not determined since the rates did not show hyperbolic response curve over varying concentrations of dCTP.
T592D and phospho-T592 SAMHD1 mutants lack dCTPase activity
The antiviral activity of SAMHD1 is down-modulated by phosphorylation (33–37). Specifically, a phosphomimetic mutation at Thr592 (T592D) significantly impairs the ability of SAMHD1 to restrict HIV-1 infection in immune cells (35). Further, SAMHD1 is phosphorylated during the S and G2-phases of the cell cycle (40). Thus, we wished to determine the effect of this modification on the enzymatic activity of SAMHD1 using our kinetic scheme. First, we examined whether T592D SAMHD1 behaves in a manner similar to WT protein in our kinetic scheme. To that end, we investigated whether T592D SAMHD1 forms a stable tetramer by introducing chemical cross-linking after the dNTP Hydrolysis Step (Scheme in Figure 4A). Immunoblot analysis of chemically cross-linked WT and T592D SAMHD1 showed that both proteins existed as tetramer during the dNTP hydrolysis reaction time, which ranged from 8 to 32 minutes (Figure 4A, lower panel). To further confirm that both GTP/dATP-bound WT and T592D SAMHD1 undergo tetramerization, we subjected mixtures of SAMHD1, GTP, and dATP, at two different concentrations, to analytical size-exclusion column chromatography (Figure 4B). The column was pre-equilibrated with GTP and dATP at the same concentrations present in the mixtures. WT and T592D SAMHD1 alone elute at 13.8–13.9 mL (upper panels), indicating that they are mainly monomer at this concentration, as previously reported (20, 40). While a significant portion of WT SAMHD1 elutes as tetramer (11. 1 mL), in the presence of 600 μM GTP and 5 μM dATP, as previously reported (23), T592D SAMHD1 does not appear to form a similar amount of tetramer at the same nucleoside triphosphate concentrations (middle panels). T592D SAMHD1 appears to form tetramer and dimer, eluting at 10.9 mL and 12.3 mL, respectively. An extended concentration curve of dATP, with a fixed concentration of GTP, showed that both WT and T592D form tetramer to different degrees, in a dATP dose-dependent manner (Figure S1). Still, at a high concentration of dATP (50 μM), a majority of T592D SAMHD1 eluted as tetramer (bottom panels).
Figure 4. SAMHD1 T592D and phospho-T592 lack dCTPase activity.

A. Cross-linking of SAMHD1 tetramers during enzyme catalysis. SAMHD1 WT and T592D proteins were sequentially activated with GTP at Step 1 and dATP at Step 2, in a manner similar to that shown in Figure 1A, with dCTP added at Step 3 as a substrate. The reaction mixtures were subjected to cross-linking for 6 min, after 8, 16, 24 and 32 min of catalysis, then separated over SDS-PAGE, followed by immunoblotting (lower panel). The control is SAMHD1 without cross-linking. B. WT and T592D SAMHD1 proteins alone (0.5 μM, upper panels) or with the mixture of GTP and dATP (lower panels) were separated with analytical size exclusion column chromatography. The elution profile was recorded with an in-line fluorescence detector. The positions of apo-SAMHD1 and GTP/dATP-bound tetramer in the elution profiles are indicated with arrows and elution volumes (19). The column was pre-equilibrated with GTP and dATP when indicated. C. The rates of dCTP hydrolysis were determined for T592D SAMHD1, with increasing concentrations of GTP at Step 1 and a fixed concentration of dATP (50 μM) at Step 2 as shown in Figure 1A (◀GTP/dATP/dCTP). The concentration of dCTP at the Hydrolysis Step was 100 μM. The values of Km,AS1 and the maximal rate of dCTP hydrolysis at 100 μM were 14.6 ± 4.5 μM and 0.10 ± 0.01 s−1, respectively. D. The Km value of dATP at the allosteric site 2 was measured for WT and T592D. The values of Km,AS2(dATP) for WT and T592D were 5.5 ± 1.1 μM, and 17.8 ± 5.0 μM, respectively. The maximal rates of dCTP hydrolysis at 100 μM for WT and T592D were 0.75 ± 0.03, 0.23 ± 0.02 s−1, respectively. E. The Km constant of dCTP at the allosteric site 2 was determined for WT and T592D. The values of Km,AS2(dCTP) for WT and T592D were 1.5 ± 0.4 μM, and 2.0 ± 0.5 μM, respectively. The maximal rates of dATP hydrolysis at 100 μM for WT and T592D were 1.0 ± 0.1, 0.93 ± 0.01 s−1, respectively. F. The hydrolysis of dGTP at 100 μM was measured for T592D SAMHD1 tetramer in complex with GTP/dGTP (green circles), GTP/dCTP (red squares), GTP/dATP (blue triangles), and GTP/dTTP (purple inverted triangles), respectively as shown in Figure 1A. The concentrations of dNTP at Step 2 was 50 μM. G. The rates of hydrolysis for each dNTP (ordinate) were measured for WT or T592D, with the allosteric site 1 and allosteric site 2 occupied by GTP (1000 μM at Step 1) and the indicated dNTP (50 μM at Step 2, abscissas), respectively. For example, GTP/dGTP at the abscissas indicates that the allosteric site 1 and 2 are occupied with GTP and dGTP, respectively. The rates of dGTP (green circles), dCTP (red squares), dATP (blue triangles), and dTTP (purple inverted triangles) at 100 μM were determined individually. Experiments were repeated in two to four replicates, and data are shown with error bars, SD. H. The rate of dCTP hydrolysis was measured with increasing concentrations of dCTP at Step 3 for GTP/dATP-induced WT or T592D tetramer. The concentration of dATP at Step 2 was 100 μM. The Km,AS2(dATP)/CS(dCTP) and Vmax, AS2(dATP)/CS(dCTP) value for WT was 76 ± 9 μM and 1.9 ± 0.1 s−1, respectively. I. The rate of dCTP hydrolysis was measured with increasing concentrations of dCTP at Step 3 for GTP/dTTP-induced WT or T592D tetramer. The concentration of dTTP at Step 2 was 100 μM. The Km,AS2(dTTP)/CS(dCTP) and Vmax, AS2(dTTP)/CS(dCTP) value for WT was 136 ± 36 μM and 1.7 ± 0.2 s−1, respectively. J. The rate of hydrolysis for each individual dNTP, at 100 μM, was determined for mock treated WT or phospho-Thr592 SAMHD1, which was sequentially activated with GTP (1000 μM at Step 1) and a mixture of dNTPs (Step 2; each at 12.5 μM). Experiments were repeated in three replicates, and data are shown with error bars, SD.
After having established that T592D SAMHD1 forms tetramer at high concentrations of GTP and dATP, we determined the apparent Km value of GTP at AS1 (Km,AS1), by varying the concentrations of GTP at the Preactivation Step (Step 1) and using fixed concentrations of dATP (50 μM) at the Tetramerization Step (Step 2) and dCTP (100 μM) at the Hydrolysis Step (Step 3), similar to the scheme shown in Figure 1A. The value of Km,AS1 for GTP binding to T592D SAMHD1 is 14.6 ± 4.5 μM, which is about 3-fold lower than the Km,AS1 value for WT (see Figures 1E and 4C). However, the maximal rate of dCTP hydrolysis at 100 μM is 0.10 ± 0.01 s−1, which is lower than that of WT by 11-fold (see Figure 1E). Since a higher concentration of dATP is required for tetramerization of T592D compared to WT (Figure 4B), we wondered whether the lower dCTPase activity of T592D tetramer is due to insufficient conversion to tetramer at Step 2 (Figure 1A). Thus, we determined the apparent Km constant of dATP binding at AS2, by varying concentrations of dATP at the Tetramerization Step (Figure 4D). The value of Km,AS2(dATP) for T592D is 17.8 ± 5.0 μM, 3-fold higher than that of WT SAMHD1 and much lower than the concentration of dATP (50 μM) used at Step 2. Further, the maximal rate of dCTP hydrolysis by T592D is 3-fold lower than that of WT (Figure 4D). In contrast, the rates of dATP hydrolysis are similar for both WT and T592D when the tetramers are induced by GTP and increasing concentrations of dCTP (Figure 4E). Note, the Km values of dCTP binding at AS2 for WT and T592D are essentially the same. Together, these data suggest that WT and T592D intrinsically possess different catalytic activities toward dCTP.
Since WT and T592D showed distinct kinetic parameters for dCTP hydrolysis, we set out to compare the enzymatic activities of all possible GTP/dNTP-induced SAMHD1 tetramers. We first surveyed the rates of dGTP hydrolysis for GTP/dNTP-induced T592D SAMHD1 tetramer (Figure 4F). All forms of T592D tetramer hydrolyzed dGTP at similar rates with less than two-fold variation. In the next set of experiments, individual dNTP hydrolysis rates for all possible GTP/dNTP-WT and GTP/dNTP-T592D SAMHD1 tetramers were compared (Figure 4G). Strikingly, the dCTP hydrolysis rate of T592D was significantly (5 – 30-fold) lower than that of WT for any combination of GTP/dNTP-induced tetramer, while other dNTP hydrolysis rates differed by less than two-fold. These results suggest that the catalytic site of T592D is not optimal for dCTP hydrolysis. Since GTP/dCTP-induced WT tetramer showed a dCTP hydrolysis rate comparable to other dNTPs at higher concentrations of dCTP (Figure 3B), we measured the rates of dCTP hydrolysis for GTP/dATP- (Figure 4H) or GTP/dTTP- (Figure 4I) induced WT and T592D tetramers with increasing concentrations of dCTP at Step 3. Both GTP/dATP- and GTP/dTTP-T592D tetramers showed significantly lower rates of dCTP hydrolysis than WT tetramers at all concentrations of dCTP tested. Phospho-Thr592 SAMHD1 also displayed an undetectable dCTPase activity relative to other dNTPase activity when the tetramer was formed with GTP and a mixture of all dNTP at equal concentration (Figure 4J). Together, the data from our kinetic assays suggest that modification of Thr592 specifically alters the dCTPase activity of GTP/dNTP-induced SAMHD1 tetramer.
Cyclin A2 inhibits dNTPase activity of SAMHD1
We and others previously reported that cyclin A2/CDK2 phosphorylates SAMHD1 at Thr592 (37, 40). Cyclin A2 binds to an evolutionary conserved di-hydrophobic motif at Leu620-Phe621 of human SAMHD1 to facilitate phosphorylation by CDK2 (40). Since the C-terminus of SAMHD1, residues 596 – 626, is critical for tetramer stability (19), we investigated whether cyclin A2 binding would affect the dNTPase activity of SAMHD1 tetramer. Addition of cyclin A2 or cyclin A2/CDK2, but not CDK2 alone, at the sequential activation Step 2 (see Figure 1A) effectively down-modulated the catalytic activity of SAMHD1 (Figure 5A). To further understand the mechanisms of cyclin A2-dependent SAMHD1 inactivation, we performed tetramerization assays (Figure 5B). As previously reported, SAMHD1 dimer/monomer eluted at 12.01 – 13.01 mL, while GTP/dATP-induced tetramer eluted at 10.23 mL, when protein mixtures were subjected to analytical size exclusion column chromatography. Note, elution volumes of protein species in this set are different from those in Figure 4B. Different Superdex 200 size exclusion columns were used (see Experimental Procedures). Addition of cyclin A2 into GTP/dATP-induced SAMHD1 tetramer resulted in reduction of the SAMHD1 tetramer peak. The height of second and third peak increased accordingly and eluted earlier. Analysis of elution fractions suggested co-elution of SAMHD1 and cyclin A2 in the second and third peak, not in the first peak. This suggests that cyclin A2 binds SAMHD1 dimer and monomer, not tetramer. Next, we asked whether cyclin A2 and cyclin A2/CDK2 bind SAMHD1 dimer and monomer at residue L620-Phe621 (Figure S2). SAMHD1 with L620A and F621A mutation failed to bind cyclin A2, while SAMHD1 WT and SAMHD1-CTD (residues 605–626) co-eluted with cyclin A2 or cyclin A2/CDK2. However, introduction of negative charge residue at Thr592 did not affect cyclin A2 interaction (Figure 5C). Together, these data suggest that cyclin A2 binding at the C-terminus of SAMHD1 disassembles the catalytically active tetramer and inhibits its catalytic activity.
Figure 5. Cyclin A2 inhibits SAMHD1 catalysis.

A. The rates of dCTP hydrolysis by SAMHD1 were measured with increasing amounts of cyclin A2, CDK2, or cyclin A2/CDK2 added at Step 1 (Figure 1A). Three different molar ratios (0.1X, 0.2X and 1X) of cyclin A2 (blue bars) or cyclin A2/CDK2 (green bars) were used, or an equal molar ratio of CDK2 to SAMHD1 was used (red bar). B. Mixtures of SAMHD1 (14 μM), GTP and dATP, with or without cyclin A2 (14 μM), as indicated, were subjected to analytical size exclusion column chromatography. Elution volume with the UV280 absorbance at the peak are indicated. Numbers below the bottom trace indicate fractions analyzed by SDS-PAGE and Coomassie blue staining, shown on the right. C. Purified SAMHD1 WT, L620A/F621A and T592D proteins were separated by SDS-PAGE and stained with Coomassie Blue (upper panel). GST-cyclin A2/CDK2 complex was incubated with recombinant SAMHD1 proteins and bound fractions were analyzed by Western blotting.
DISCUSSION
The dNTPase activity of SAMHD1 is controlled by the substrates. First, GTP binding at AS1 is a prerequisite for activation, then dNTP binding at AS2 induces tetramerization and activates dNTP hydrolysis at the catalytic site (22–25, 45, 46). Since the apparent Km constant of GTP at AS1 is 47 μM (Figure 1E) and the cellular concentration of GTP is in the mM range (42, 43), the majority of SAMHD1 would exist as the GTP-bound form. Each dNTP binds AS2 with a distinctive Km constant (Figure 2 and Table 1), in order of dCTP (Km,AS2, 1.8 ± 0.5 μM) < dGTP (Km,AS2, 3.9 ± 1.5 μM) < dATP (Km,AS2, 6.1 ±1.8 μM) < dTTP (Km,AS2, 18.3 ± 5.0 μM) overall (Figure 6). Importantly, these GTP/dNTP-induced SAMHD1 tetramers exhibit different substrate specificities toward individual dNTP substrates. Detailed kinetic studies allowed us to determine the substrate specificities, also known as catalytic efficiency, Vmax/Km of dNTPs for all possible GTP/dNTP-induced SAMHD1 tetramers (Table 2). The substrate specificity of dGTP hydrolysis varies by 6-fold for different GTP/dNTP-induced SAMHD1 tetramers, while the value for dATP and dCTP hydrolysis remains constant. The substrate specificity of dCTP varies by 2-fold, excluding GTP/dCTP-induced tetramer, which is a poor dCTPase. Together, our findings indicate that the dNTPase activity of SAMHD1 is selectively regulated by each dNTP binding at AS2.
Figure 6. Regulation of SAMHD1 dNTPase activity by deoxyribonucleoside triphosphate and cyclin A2/CDK2.

GTP binding at the allosteric site 1 (AS1) is prerequisite for activation of SAMHD1 catalysis. SAMHD1 always likely exists in a GTP-bound form due to high cellular concentration of GTP. Binding of dCTP at the allosteric site 2 (AS2) increases triphosphohydrolase activity for dGTP, dATP and dTTP, not dCTP. Binding of dGTP, dATP and dTTP at AS2 differentially induces dNTPase activity. Binding of cyclin A2 or cyclin A2/CDK2 induces disassembly of SAMHD1 tetramer. Phosphorylation of Thr592 by cyclin A2/CDK2 induces conformational changes, resulting in an overall inhibition of dCTP hydrolase activity.
SAMHD1 is post-translationally modified by cyclin A2/CDK1 or cyclin A2/CDK2 kinase, and the modification is closely related to its biological function (33–37, 40). Several independent reports suggested that phosphorylation of Thr592 by the kinase has a negative impact on its HIV-1 restriction activity (33–37). The currently accepted mechanism of HIV-1 restriction by SAMHD1 is associated with its dNTPase activity, which limits dNTP pools, interfering with reverse transcription of the viral genome. Recent biochemical and structural studies suggest a link between the reduced dNTPase activities of phospho-Thr592 SAMHD1 and a phosphomimetic mutant SAMHD1 and reduced tetramer stability and loss of HIV-1 restriction (38, 39). In those structures, AS1 is occupied with GTP, and AS2 and the catalytic sites are occupied with dATP. Introduction of charged residues induced conformational changes in the region where the modification is located. These might have also caused rearrangement of the catalytic site, selectively affecting dCTPase activity while leaving the hydrolysis activity against other dNTPs largely unaltered. Analysis of the crystal structure of SAMHD1 tetramer with a negative charge at T592 and with dCTP bound at AS2 will reveal more structural detail, addressing how substrate specificity is modulated by post-translational modification. Further, investigation into the impact of T592 phosphorylation on each dNTP pool and its correlation with HIV-1 reverse transcription also is needed.
Cyclin kinases play essential roles in cell cycle regulation and comprise cyclin and CDK (47, 48). Cyclins recognize a specific sequence motif of cellular factors in cell cycle regulatory pathways and recruit them to CDK for phosphorylation. At each specific cell cycle stage, different cyclin/CDK complexes regulate progression to the next stage. Cyclin A2/CDK, which phosphorylates SAMHD1 at T592, is at a high level during S and G2 phases. During the S-phase, RNR is highly active (14, 15) and SAMHD1 is phosphorylated (40), creating cellular conditions for higher dNTP pools. Binding of cyclin A2 to the C-terminus of SAMHD1 appears to be favorable for DNA replication since it directly inhibits SAMHD1 dNTPase activity (Figure 5A). Size exclusion column chromatography analysis suggests that cyclin A2 binding to SAMHD1 induces destruction of the catalytically active tetramer (Figure 5B). This is not surprising, based on our previous observation that the C-terminus is essential for tetramer stability (19). Further, Vpx from HIV and SIV recruits SAMHD1, by binding its C-terminus, to DCAF1, the receptor component of the Cullin4 E3 ubiquitin ligase for proteasomal-dependent degradation, and can effectively disassemble GTP/dNTP-induced tetramers (49). Thus, cyclin A2/CDK regulates SAMHD1 at multiple levels, modulating substrate specificity by phosphorylation and inhibiting tetramerization by direct interaction (Figure 6).
In conclusion, our new sequential activation kinetic scheme sheds light on the mechanisms of dNTP-mediated allostery of SAMHD1 dNTPase activity. Significantly, current kinetic studies provided insight into how phosphorylation of SAMHD1 modulates and controls its dNTPase substrate specificity. Application of this new kinetic scheme is expected to propel further understanding of SAMHD1 enzyme activity.
Supplementary Material
Acknowledgments
This work was supported, in whole or in part, by the National Institutes of Health, grant GM116642 to J.A.
The authors thank Dr. Teresa Brosenitsch for editorial help and Drs. Angela M. Gronenborn and Jacek Skowronski for discussion. We would like to thank Maria DeLucia for technical assistance.
Abbreviations
- AS1
the allosteric site 1
- AS2
the allosteric site 2
- CS
the catalytic site
- dNTP
deoxyribonucleoside triphosphate
- dNTPase
deoxyribonucleoside triphosphate triphosphohydrolase
- HIV-1
human immunodeficiency virus 1
- RNR
ribonucleotide reductase
- SAMHD1
Sterile alpha motif (SAM) and Histidine-Aspartate (HD)-domain containing protein 1
- WT
wild type
References
- 1.Hakansson P, Dahl L, Chilkova O, Domkin V, Thelander L. The Schizosaccharomyces pombe replication inhibitor Spd1 regulates ribonucleotide reductase activity and dNTPs by binding to the large Cdc22 subunit. J Biol Chem. 2006;281:1778–1783. doi: 10.1074/jbc.M511716200. [DOI] [PubMed] [Google Scholar]
- 2.Hakansson P, Hofer A, Thelander L. Regulation of mammalian ribonucleotide reduction and dNTP pools after DNA damage and in resting cells. J Biol Chem. 2006;281:7834–7841. doi: 10.1074/jbc.M512894200. [DOI] [PubMed] [Google Scholar]
- 3.Bebenek K, Roberts JD, Kunkel TA. The effects of dNTP pool imbalances on frameshift fidelity during DNA replication. J Biol Chem. 1992;267:3589–3596. [PubMed] [Google Scholar]
- 4.Chabes A, Georgieva B, Domkin V, Zhao X, Rothstein R, Thelander L. Survival of DNA damage in yeast directly depends on increased dNTP levels allowed by relaxed feedback inhibition of ribonucleotide reductase. Cell. 2003;112:391–401. doi: 10.1016/s0092-8674(03)00075-8. [DOI] [PubMed] [Google Scholar]
- 5.Gon S, Napolitano R, Rocha W, Coulon S, Fuchs RP. Increase in dNTP pool size during the DNA damage response plays a key role in spontaneous and induced-mutagenesis in Escherichia coli. Proc Natl Acad Sci USA. 2011;108:19311–19316. doi: 10.1073/pnas.1113664108. [DOI] [PMC free article] [PubMed] [Google Scholar]
- 6.Kumar D, Abdulovic AL, Viberg J, Nilsson AK, Kunkel TA, Chabes A. Mechanisms of mutagenesis in vivo due to imbalanced dNTP pools. Nucleic Acids Res. 2011;39:1360–1371. doi: 10.1093/nar/gkq829. [DOI] [PMC free article] [PubMed] [Google Scholar]
- 7.Ahluwalia D, Schaaper RM. Hypermutability and error catastrophe due to defects in ribonucleotide reductase. Proc Natl Acad Sci USA. 2013;110:18596–18601. doi: 10.1073/pnas.1310849110. [DOI] [PMC free article] [PubMed] [Google Scholar]
- 8.Koc A, Wheeler LJ, Mathews CK, Merrill GF. Hydroxyurea arrests DNA replication by a mechanism that preserves basal dNTP pools. J Biol Chem. 2004;279:223–230. doi: 10.1074/jbc.M303952200. [DOI] [PubMed] [Google Scholar]
- 9.Alvino GM, Collingwood D, Murphy JM, Delrow J, Brewer BJ, Raghuraman MK. Replication in hydroxyurea: it’s a matter of time. Mol Cell Biol. 2007;27:6396–6406. doi: 10.1128/MCB.00719-07. [DOI] [PMC free article] [PubMed] [Google Scholar]
- 10.Sabatinos SA, Green MD, Forsburg SL. Continued DNA synthesis in replication checkpoint mutants leads to fork collapse. Mol Cell Biol. 2012;32:4986–4997. doi: 10.1128/MCB.01060-12. [DOI] [PMC free article] [PubMed] [Google Scholar]
- 11.Nordlund P, Reichard P. Ribonucleotide reductases. Ann Rev Biochem. 2006;75:681–706. doi: 10.1146/annurev.biochem.75.103004.142443. [DOI] [PubMed] [Google Scholar]
- 12.Larsson KM, Jordan A, Eliasson R, Reichard P, Logan DT, Nordlund P. Structural mechanism of allosteric substrate specificity regulation in a ribonucleotide reductase. Nat Struct Mol Biol. 2004;11:1142–1149. doi: 10.1038/nsmb838. [DOI] [PubMed] [Google Scholar]
- 13.Zimanyi CM, Chen PY, Kang G, Funk MA, Drennan CL. Molecular basis for allosteric specificity regulation in class Ia ribonucleotide reductase from Escherichia coli. eLife. 2016;5 doi: 10.7554/eLife.07141. [DOI] [PMC free article] [PubMed] [Google Scholar]
- 14.Bjorklund S, Skog S, Tribukait B, Thelander L. S-phase-specific expression of mammalian ribonucleotide reductase R1 and R2 subunit mRNAs. Biochemistry. 1990;29:5452–5458. doi: 10.1021/bi00475a007. [DOI] [PubMed] [Google Scholar]
- 15.Elledge SJ, Davis RW. Two genes differentially regulated in the cell cycle and by DNA-damaging agents encode alternative regulatory subunits of ribonucleotide reductase. Genes Dev. 1990;4:740–751. doi: 10.1101/gad.4.5.740. [DOI] [PubMed] [Google Scholar]
- 16.Goldstone DC, Ennis-Adeniran V, Hedden JJ, Groom HC, Rice GI, Christodoulou E, Walker PA, Kelly G, Haire LF, Yap MW, de Carvalho LP, Stoye JP, Crow YJ, Taylor IA, Webb M. HIV-1 restriction factor SAMHD1 is a deoxynucleoside triphosphate triphosphohydrolase. Nature. 2011;480:379–382. doi: 10.1038/nature10623. [DOI] [PubMed] [Google Scholar]
- 17.Powell RD, Holland PJ, Hollis T, Perrino FW. Aicardi-Goutieres syndrome gene and HIV-1 restriction factor SAMHD1 is a dGTP-regulated deoxynucleotide triphosphohydrolase. J Biol Chem. 2011;286:43596–43600. doi: 10.1074/jbc.C111.317628. [DOI] [PMC free article] [PubMed] [Google Scholar]
- 18.Franzolin E, Pontarin G, Rampazzo C, Miazzi C, Ferraro P, Palumbo E, Reichard P, Bianchi V. The deoxynucleotide triphosphohydrolase SAMHD1 is a major regulator of DNA precursor pools in mammalian cells. Proc Natl Acad Sci USA. 2013;110:14272–14277. doi: 10.1073/pnas.1312033110. [DOI] [PMC free article] [PubMed] [Google Scholar]
- 19.Yan J, Kaur S, DeLucia M, Hao C, Mehrens J, Wang C, Golczak M, Palczewski K, Gronenborn AM, Ahn J, Skowronski J. Tetramerization of SAMHD1 is required for biological activity and inhibition of HIV infection. J Biol Chem. 2013;288:10406–10417. doi: 10.1074/jbc.M112.443796. [DOI] [PMC free article] [PubMed] [Google Scholar]
- 20.Ji X, Wu Y, Yan J, Mehrens J, Yang H, DeLucia M, Hao C, Gronenborn AM, Skowronski J, Ahn J, Xiong Y. Mechanism of allosteric activation of SAMHD1 by dGTP. Nat Struct Mol Biol. 2013;20:1304–1309. doi: 10.1038/nsmb.2692. [DOI] [PMC free article] [PubMed] [Google Scholar]
- 21.Zhu C, Gao W, Zhao K, Qin X, Zhang Y, Peng X, Zhang L, Dong Y, Zhang W, Li P, Wei W, Gong Y, Yu XF. Structural insight into dGTP-dependent activation of tetrameric SAMHD1 deoxynucleoside triphosphate triphosphohydrolase. Nat Commun. 2013;4:2722. doi: 10.1038/ncomms3722. [DOI] [PubMed] [Google Scholar]
- 22.Ji X, Tang C, Zhao Q, Wang W, Xiong Y. Structural basis of cellular dNTP regulation by SAMHD1. Proc Natl Acad Sci USA. 2014;111:E4305–4314. doi: 10.1073/pnas.1412289111. [DOI] [PMC free article] [PubMed] [Google Scholar]
- 23.Koharudin LM, Wu Y, DeLucia M, Mehrens J, Gronenborn AM, Ahn J. Structural basis of allosteric activation of sterile alpha motif and histidine-aspartate domain-containing protein 1 (SAMHD1) by nucleoside triphosphates. J Biol Chem. 2014;289:32617–32627. doi: 10.1074/jbc.M114.591958. [DOI] [PMC free article] [PubMed] [Google Scholar]
- 24.Zhu CF, Wei W, Peng X, Dong YH, Gong Y, Yu XF. The mechanism of substrate-controlled allosteric regulation of SAMHD1 activated by GTP. Acta Crystallogr D Biol Crystallogr. 2015;71:516–524. doi: 10.1107/S1399004714027527. [DOI] [PubMed] [Google Scholar]
- 25.Hansen EC, Seamon KJ, Cravens SL, Stivers JT. GTP activator and dNTP substrates of HIV-1 restriction factor SAMHD1 generate a long-lived activated state. Proc Natl Acad Sci USA. 2014;111:E1843–1851. doi: 10.1073/pnas.1401706111. [DOI] [PMC free article] [PubMed] [Google Scholar]
- 26.Baldauf HM, Pan X, Erikson E, Schmidt S, Daddacha W, Burggraf M, Schenkova K, Ambiel I, Wabnitz G, Gramberg T, Panitz S, Flory E, Landau NR, Sertel S, Rutsch F, Lasitschka F, Kim B, Konig R, Fackler OT, Keppler OT. SAMHD1 restricts HIV-1 infection in resting CD4(+) T cells. Nat Med. 2012;18:1682–1687. doi: 10.1038/nm.2964. [DOI] [PMC free article] [PubMed] [Google Scholar]
- 27.Descours B, Cribier A, Chable-Bessia C, Ayinde D, Rice G, Crow Y, Yatim A, Schwartz O, Laguette N, Benkirane M. SAMHD1 restricts HIV-1 reverse transcription in quiescent CD4(+) T-cells. Retrovirology. 2012;9:87. doi: 10.1186/1742-4690-9-87. [DOI] [PMC free article] [PubMed] [Google Scholar]
- 28.Kim B, Nguyen LA, Daddacha W, Hollenbaugh JA. Tight interplay among SAMHD1 protein level, cellular dNTP levels, and HIV-1 proviral DNA synthesis kinetics in human primary monocyte-derived macrophages. J Biol Chem. 2012;287:21570–21574. doi: 10.1074/jbc.C112.374843. [DOI] [PMC free article] [PubMed] [Google Scholar]
- 29.Lahouassa H, Daddacha W, Hofmann H, Ayinde D, Logue EC, Dragin L, Bloch N, Maudet C, Bertrand M, Gramberg T, Pancino G, Priet S, Canard B, Laguette N, Benkirane M, Transy C, Landau NR, Kim B, Margottin-Goguet F. SAMHD1 restricts the replication of human immunodeficiency virus type 1 by depleting the intracellular pool of deoxynucleoside triphosphates. Nat Immunol. 2012;13:223–228. doi: 10.1038/ni.2236. [DOI] [PMC free article] [PubMed] [Google Scholar]
- 30.Ryoo J, Choi J, Oh C, Kim S, Seo M, Kim SY, Seo D, Kim J, White TE, Brandariz-Nunez A, Diaz-Griffero F, Yun CH, Hollenbaugh JA, Kim B, Baek D, Ahn K. The ribonuclease activity of SAMHD1 is required for HIV-1 restriction. Nat Med. 2014;20:936–941. doi: 10.1038/nm.3626. [DOI] [PMC free article] [PubMed] [Google Scholar]
- 31.Seamon KJ, Sun Z, Shlyakhtenko LS, Lyubchenko YL, Stivers JT. SAMHD1 is a single-stranded nucleic acid binding protein with no active site-associated nuclease activity. Nucleic Acids Res. 2015;43:6486–6499. doi: 10.1093/nar/gkv633. [DOI] [PMC free article] [PubMed] [Google Scholar]
- 32.Laguette N, Sobhian B, Casartelli N, Ringeard M, Chable-Bessia C, Segeral E, Yatim A, Emiliani S, Schwartz O, Benkirane M. SAMHD1 is the dendritic- and myeloid-cell-specific HIV-1 restriction factor counteracted by Vpx. Nature. 2011;474:654–657. doi: 10.1038/nature10117. [DOI] [PMC free article] [PubMed] [Google Scholar]
- 33.Cribier A, Descours B, Valadao AL, Laguette N, Benkirane M. Phosphorylation of SAMHD1 by cyclin A2/CDK1 regulates its restriction activity toward HIV-1. Cell Rep. 2013;3:1036–1043. doi: 10.1016/j.celrep.2013.03.017. [DOI] [PubMed] [Google Scholar]
- 34.Welbourn S, Dutta SM, Semmes OJ, Strebel K. Restriction of virus infection but not catalytic dNTPase activity is regulated by phosphorylation of SAMHD1. J Virol. 2013;87:11516–11524. doi: 10.1128/JVI.01642-13. [DOI] [PMC free article] [PubMed] [Google Scholar]
- 35.White TE, Brandariz-Nunez A, Valle-Casuso JC, Amie S, Nguyen LA, Kim B, Tuzova M, Diaz-Griffero F. The retroviral restriction ability of SAMHD1, but not its deoxynucleotide triphosphohydrolase activity, is regulated by phosphorylation. Cell Host Microbe. 2013;13:441–451. doi: 10.1016/j.chom.2013.03.005. [DOI] [PMC free article] [PubMed] [Google Scholar]
- 36.Pauls E, Ruiz A, Badia R, Permanyer M, Gubern A, Riveira-Munoz E, Torres-Torronteras J, Alvarez M, Mothe B, Brander C, Crespo M, Menendez-Arias L, Clotet B, Keppler OT, Marti R, Posas F, Ballana E, Este JA. Cell cycle control and HIV-1 susceptibility are linked by CDK6-dependent CDK2 phosphorylation of SAMHD1 in myeloid and lymphoid cells. J Immunol. 2014;193:1988–1997. doi: 10.4049/jimmunol.1400873. [DOI] [PubMed] [Google Scholar]
- 37.St Gelais C, de Silva S, Hach JC, White TE, Diaz-Griffero F, Yount JS, Wu L. Identification of cellular proteins interacting with the retroviral restriction factor SAMHD1. J Virol. 2014;88:5834–5844. doi: 10.1128/JVI.00155-14. [DOI] [PMC free article] [PubMed] [Google Scholar]
- 38.Arnold LH, Groom HC, Kunzelmann S, Schwefel D, Caswell SJ, Ordonez P, Mann MC, Rueschenbaum S, Goldstone DC, Pennell S, Howell SA, Stoye JP, Webb M, Taylor IA, Bishop KN. Phospho-dependent Regulation of SAMHD1 Oligomerisation Couples Catalysis and Restriction. PLoS Pathog. 2015;11:e1005194. doi: 10.1371/journal.ppat.1005194. [DOI] [PMC free article] [PubMed] [Google Scholar]
- 39.Tang C, Ji X, Wu L, Xiong Y. Impaired dNTPase activity of SAMHD1 by phosphomimetic mutation of Thr-592. J Biol Chem. 2015;290:26352–26359. doi: 10.1074/jbc.M115.677435. [DOI] [PMC free article] [PubMed] [Google Scholar]
- 40.Yan J, Hao C, DeLucia M, Swanson S, Florens L, Washburn MP, Ahn J, Skowronski J. CyclinA2-Cyclin-dependent Kinase Regulates SAMHD1 Protein Phosphohydrolase Domain. J Biol Chem. 2015;290:13279–13292. doi: 10.1074/jbc.M115.646588. [DOI] [PMC free article] [PubMed] [Google Scholar]
- 41.Pinhero R, Liaw P, Yankulov K. A uniform procedure for the purification of CDK7/CycH/MAT1, CDK8/CycC and CDK9/CycT1. Biol Proced online. 2004;6:163–172. doi: 10.1251/bpo86. [DOI] [PMC free article] [PubMed] [Google Scholar]
- 42.Ferraro P, Franzolin E, Pontarin G, Reichard P, Bianchi V. Quantitation of cellular deoxynucleoside triphosphates. Nucleic Acids Res. 2010;38:e85. doi: 10.1093/nar/gkp1141. [DOI] [PMC free article] [PubMed] [Google Scholar]
- 43.Gandhi VV, Samuels DC. A review comparing deoxyribonucleoside triphosphate (dNTP) concentrations in the mitochondrial and cytoplasmic compartments of normal and transformed cells. Nucleosides Nucleotides Nucleic Acids. 2011;30:317–339. doi: 10.1080/15257770.2011.586955. [DOI] [PMC free article] [PubMed] [Google Scholar]
- 44.Amie SM, Noble E, Kim B. Intracellular nucleotide levels and the control of retroviral infections. Virology. 2013;436:247–254. doi: 10.1016/j.virol.2012.11.010. [DOI] [PMC free article] [PubMed] [Google Scholar]
- 45.Miazzi C, Ferraro P, Pontarin G, Rampazzo C, Reichard P, Bianchi V. Allosteric regulation of the human and mouse deoxyribonucleotide triphosphohydrolase sterile alpha-motif/histidine-aspartate domain-containing protein 1 (SAMHD1) J Biol Chem. 2014;289:18339–18346. doi: 10.1074/jbc.M114.571091. [DOI] [PMC free article] [PubMed] [Google Scholar]
- 46.Amie SM, Bambara RA, Kim B. GTP is the primary activator of the anti-HIV restriction factor SAMHD1. J Biol Chem. 2013;288:25001–25006. doi: 10.1074/jbc.C113.493619. [DOI] [PMC free article] [PubMed] [Google Scholar]
- 47.Pines J. Cyclins and cyclin-dependent kinases: a biochemical view. Biochem J. 1995;308:697–711. doi: 10.1042/bj3080697. [DOI] [PMC free article] [PubMed] [Google Scholar]
- 48.Reed SI. Control of the G1/S transition. Cancer surv. 1997;29:7–23. [PubMed] [Google Scholar]
- 49.DeLucia M, Mehrens J, Wu Y, Ahn J. HIV-2 and SIVmac accessory virulence factor Vpx down-regulates SAMHD1 enzyme catalysis prior to proteasome-dependent degradation. J Biol Chem. 2013;288:19116–19126. doi: 10.1074/jbc.M113.469007. [DOI] [PMC free article] [PubMed] [Google Scholar]
Associated Data
This section collects any data citations, data availability statements, or supplementary materials included in this article.