Abstract
Electron tomography is a promising technology for imaging ultrastructures at nanoscale resolutions. However, image and quantitative analyses are often hindered by high levels of noise, staining heterogeneity, and material damage either as a result of the electron beam or sample preparation. We have developed and built a framework that allows for automatic segmentation and quantification of filamentous objects in 3D electron tomography. Our approach consists of three steps: (i) local enhancement of filaments by Hessian filtering; (ii) detection and completion (e.g., gap filling) of filamentous structures through tensor voting; and (iii) delineation of the filamentous networks. Our approach allows for quantification of filamentous networks in terms of their compositional and morphological features. We first validate our approach using a set of specifically designed synthetic data. We then apply our segmentation framework to tomograms of plant cell walls that have undergone different chemical treatments for polysaccharide extraction. The subsequent compositional and morphological analyses of the plant cell walls reveal their organizational characteristics and the effects of the different chemical protocols on specific polysaccharides.
Keywords: 3d segmentation, tensor voting, plant cell wall, electron tomography
1. INTRODUCTION
Electron tomography provides us with a new view of the nature and its nanometric structures. One of the main challenges in the analysis of a tomogram involves segmentation of 3D filamentous organizations underlying intrinsic architectural phenotype. Automatic segmentation is often complicated by material damage and high levels of noise, which are ubiquitous in the current electron tomographic data. Heterogeneity in the staining and the material damage caused by chemical treatments, as in the case of stained, resin-embedded samples, add an extra layer of deterioration to the imaging quality. As a result, otherwise continuous 3D filamentous networks are often imaged in fragments that show heterogeneous contrast and poor signal to noise ratio.
Despite the mentioned challenges, we have developed a framework for automatic segmentation of 3D filamentous structures and networks from tomographic data. We explore the efficacy of our approach by determining the composition and 3D architecture of plant cell walls through tomographic imaging of resin-embedded and cryo-preserved samples. In this context, our goal is to develop an ultrastructural organizational understanding of plant cell walls that will ultimately allow the re-engineering of cell wall properties, e.g., for improved lignocellulytic degradation of the biomass and fermentation into renewable transportation fuels/biofuels, while withstanding biochemical and microbial attack upon plant growth and development.
Current plant cell wall models assume a tightly packed network of two major types of polysaccharides, namely cellulose and hemicellulose. The space in-between is filled by pectic polysaccharides and/or polymeric aromatic lignin with irregular chemical structure, as well as some glycoproteins. Previous attempts on imaging the cell wall architecture used transmission electron microscopy (TEM) of fast-frozen, deep-etched, rotary-shadowed replicas of cell walls [14]; Field Emission Scanning Electron Microscopy (FESEM) of chemically extracted, freeze-fractured cell walls [20, 11]; and atomic force microscopy (AFM) of fully hydrated cell walls [1]. Although these studies have provided an interesting insight into the in situ filamentous structure dimensions and orientations, as well as the degree of connections between the cell wall components, the information obtained is typically restricted to two dimensions or is topographical in nature. Electron tomography is the only method currently available that has provided a three-dimensional view of the plant cell walls at a molecular resolution [22, 23].
Insight into the 3D organization of the plant cell wall requires analyses of a large number of tomograms in order to attain statistics. Therefore, interactive segmentation needs to be replaced by automated detection, classification and geometric analysis algorithms. Since the 3D organization of the cell wall is not known and ground truth cannot be established, we resorted to an analysis, under different experimental conditions, that aims at removing increasing portions of the respective cell wall polymers. We then asked whether our approach could account for the anticipated reduction in material and/or change in the organization.
The main barriers to the analysis of electron tomographic images are non-uniform foreground signature, heterogeneity of background contrast, and the presence of noise. Combined, these features can cause fragmentation in the structural organization of the sample. Consequently, these barriers inhibit the use of standard methods (e.g., thresholding, skeletonization) for detecting and delineating filamentous structures. Previous researchers have utilized model-based approaches for filament detection and tracking. In [5], a computational pipeline is introduced to first enhance the signal using a combination of data and model driven frameworks. This is followed by segmentation using shape priors and tracing along the medial axis. In a recently published approach, a cascade of operators to denoise and track filaments with a cylindrical templates was utilized [16].
The core of our approach relies on Tensor Voting [15] to group local features by enforcing continuity, and to construct a global representation. Tensor voting is based on entities that deform under the influence of their vicinity to reveal perceptual structures. This influence is inferred through a voting system, where voxels in an image propagate, within their vicinity, information that is relative to their particular nature. The interpretation of these local interactions leads to a global understanding of the structural context these voxels participate. Very importantly, tensor voting does not rely on shape priors and templates. In the past, we applied tensor voting in different configurations and to different problems [9, 10]. Based on our experience, tensor voting depends on interaction from voxel to voxel and can be fairly expensive when applied to large and dense (e.g., not thresholded) 3D images. Therefore, in the approach presented here, Hessian filtering is used to enhance the stained filamentous structure so a thresholded input can be provided to tensor voting. This pre-processing step also provides an estimate of the voxels’ local directions, which promotes an even larger improvement in the tensor voting’s performance, both in running time and quality of structural inference. Once filaments are detected and gaps are bridged, a curve tracking algorithm traces along filamentous structures and detects junctions, providing a rich representation that allows for quantitative analysis of the structural organization of the filamentous networks. We demonstrate the utility of our approach both through synthetic images and 3D electron tomograms of plant cell walls that were chemically treated for controlled extraction of specific polysaccharides.
This manuscript develops as follows: Section 2 presents a detailed description of our computational framework. Section 3 describes our experiments and presents a discussion on the obtained results. Section 4 concludes this work with an overall view of the approach and the achieved results.
2. COMPUTATIONAL FRAMEWORK
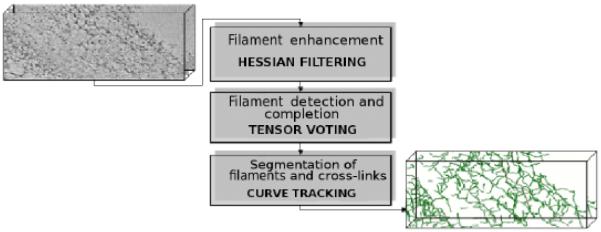
Here we describe our approach to segmenting filamentous structures in plant cell walls from 3D electron tomograms. The segmentation is achieved through a three-step approach, as depicted in Figure 1. First, Hessian filtering enhances the stained filamentous regions by computing a second-order differential operator. Second, tensor voting is applied for detection and completion (e.g., gap filling) of the filaments. Third, curve tracking is employed, with filaments and junctions then being segmented for subsequent quantification. In the following sections, we present details about each step and how these steps are coupled together.
Figure 1.
Our approach segments filamentous networks from 3D electron tomograms through a three-step computational protocol. As depicted in this diagram, Hessian filtering, tensor voting and curve tracking are coupled together to produce high quality segmentations of the filamentous structures.
2.1 Enhancement by Hessian filtering
As a first step, our approach filters a 3D tomogram to enhance the locations where filamentous structures are present. The approach is based on the fact that filamentous structures form an organized network of continuous and elongated fragments, and the encounter of 2 or more filaments forms a junction. Previous works by [17, 8, 3] discuss the suitability of using a second order differential operator for segmentation of curvilinear structures. In structural inference, the similarity among these works is in the interpretation of the eigenvalues and eigenvectors of the image resulting from Hessian filtering. However, the cited approaches and their particular interpretations proved insufficient to deal with our data and goals. Instead, we utilize Hessian only as a pre-filtering step, as described below. More elaborated formulations imposed a higher computational load, with little or no gain to the overall result. In general, an image is Hessian filtered using Equation 1, where and G(σ) is a Gaussian function with standard deviation σ. The term σI promotes scale normalization, as proposed in [7].
| (1) |
For structural analysis, the outcome of Hessian filtering H(I(x, y, z)) is decomposed into eigenvalues (∣λ1∣ ≥ ∣λ2∣ ≥ ∣λ3∣) and eigenvectors (). Here, we apply Hessian filtering for enhancement of filaments in the plant cell wall, that are visualized through chemical staining. In order to enhance the filamentous structures and junctions that are imaged as bright signal against a non-stained background, we must compute an intensity map based on eigenvalues with the largest negative magnitude. To this end, λ1 is zeroed if positive (e.g., dark structures), and inverted if negative (e.g., bright structures). In addition, eigenvectors associated with the smallest magnitude eigenvalues () are used to define the tangential direction of the filament. In summary, the intensity map computed at this step is composed of a measure of likelihood of bright structure, PH(x,y,z), and a local estimate of structure direction, .
2.2 Detection and completion by tensor voting
The next step of our approach explores the intensity map computed from Hessian filtering to locate filaments and to fill in the gaps. This is done by Tensor Voting [15]. In Tensor Voting, structural saliency is estimated through vote casting between primitives of an image. Such primitives are represented by tensors, mathematical entities whose capability for encoding magnitude and orientation make tensor voting particularly efficient for detecting perceptually organized structures, such as edges, lines and regions. In 3D, tensors are represented analytically as second order non-negative definite matrices or geometrically as ellipsoids, shaped by the tensors’ eigenvalues’ magnitude and eigenvectors’ directions. Initialized with a certain size, shape and orientation, input tensors are gradually deformed due to the accumulation of votes cast by other neighboring tensors. Similar to Hessian filtering, the tensor’s size and shape are given by its eigenvalues (λ1 ≥ λ2 ≥ λ3 ≥ 0), while its orientation is given by respective eigenvectors ().
Votes are also tensors composed of magnitude and orientation, which encode the Gestalt principles of proximity, smoothness and good continuation [21]. Given two tensors positioned in space, for example, at (x, y, z) and (u, v, w) as depicted in Figure 2(a), the distance l between them and the angle θ between the tangent of the osculating circle at (x, y, z) and the line that connects (x, y, z) to (u, v, w) are used to calculate the primitives’ relative arc length s = θl=sin(θ) and curvature κ = 2sin(θ)/l, which together produce V(u, v, w), (x, y, z)’s vote to (u, v, w), as shown in Equation 2. Without any prior knowledge, the path defined by the osculating circle with center C is the most likely smooth path since its curvature is kept constant.
| (2) |
Figure 2.
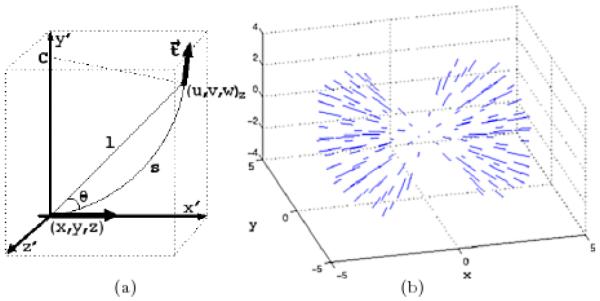
(a) A sketch of two tensors and their spatial relationship in the x′, y′, z′ coordinate system to produce the vote V(u, v, w) in Equation 2: briefly speaking, the vote from a tensor at (x, y, z) to another tensor at (u, v, w) with tangent t depends only on their relative distance l and angle θ (see text for full description). (b) The figure depicts the tensor voting stick field with tensors shown along their tangential direction: since the votes are computed solely from the relative position of neighboring tensors, a voting field can be pre-computed.
In the expression above, is the vector tangent to the osculating circle at location (u, v, w). The scale factor σ is the only free parameter in this expression and determines the extension of the voting neighborhood. The parameter c is a function of the scale and controls the decay in high curvature areas. It is traditionally set to c = −16log(0.1) × (σ – 1) × π−2. Intuitively, the vote intensity decays exponentially as a function of the distance between the voter and the recipient, and the vote orientation determined by their osculating circle.
A voting field can be formed by calculating all votes that can be cast from a tensor located in the center of the field to its neighboring tensors (Figure 2(b)). Its extension is limited by σ, and it can only exist at ∣θ∣ ≤ 45°, as beyond this angle the osculating circle ceases to represent the smoothest path between the tensors.
The deformation imposed to each tensor by accumulating the magnitude and orientation of the votes eventually reveals behavioral coherence among image primitives. Primitives that lie on the same salient feature (e.g. a curve or a region) strongly support each other and deform the tensor at those sites according to the underlying structure orientation. The accumulation of votes involves simply tensor additions (e.g., summation of matrices), and can be algebraically represented by , where Txyz is the resulting tensor at location (x, y, z), after receiving the votes V(x, y, z) from its neighboring tensors Tuvw at locations (u, v, w). Naturally, Txyz’s size and orientation are obtained from its eigen-decomposition . Each kind of structure is expected to produce tensors of a particular shape, for example, very elongated tensors (high λ1 – λ2) for curvilinear structures, and more rounded ones (e.g., low λ1 – λ2 or low λ1 – λ3) for other structures. Figure 3 exemplifies how a set of input primitives are encoded as tensors, whose deformations resulting from accumulated votes reveal an underlying salient curvilinear structure.
Figure 3.
Tensor voting allows for inference of organized structures through low-level interactions between image elements. (a) input primitives composed by points in the image plane; (b) primitives encoded as second-order tensors; (c) deformed tensors resulting from voting; (d) underlying curve revealed by grouping tensors with similar properties.
Here, in our review of tensor voting, we briefly summarize concepts that were introduced earlier [15]. Basically, the voting process can be either sparse or dense. Sparse voting restricts the tensors so that they only cast votes on the input set within their vicinity. In contrast, dense voting permits tensors to vote within a local neighborhood that may not be part of the input set. Therefore, dense voting allows for inference of structures beyond the initial input maps, yielding structure detection as well as gap completion. In both sparse and dense voting, structures are inferred from thresholding a saliency map, which is created by the particular combination of eigenvalues that best suits the detection requirements (e.g., λ1 – λ2 for filaments, λ3 for regions, etc). Yet another aspect of the tensor voting framework, tensors and tensor operations can be replaced by vectors and vector operations, respectively. Due to the different outcome obtained by using vector operations, a new map is produced by computing the resulting vector’s norm. Roughly speaking, this new map encodes, at each location, the direction where the majority of votes come from (e.g., polarity of votes). Given its characteristics, this polarity map has been used to determine the boundaries or the extremities of structures. Tensor voting has been shown to have high immunity to noise and have little sensitivity to parameter setting.
Regarding the problem on our hands, the first step in applying tensor voting is the construction of a voting space. We start by translating the Hessian intensity map into input tensor field H. Analytically, , which is simply the encoding of the vector , with magnitude PH(x,y,z), as a tensor. Here, the locations with low PH(x,y,z) are thresholded out from the tensor voting input map. Together, the thresholding of low magnitude values and the encoding of the directions estimated by Hessian help reduce the overall computational time significantly.
After the voting space is constructed, a dense tensor voting pass is executed using the stick tensor field (Figure 2(b)). The deformation caused by locally accumulating votes reveals, although still inaccurately, the presence or absence of structures in the image. Votes cast outside the input map potentially create paths between disconnected structures. The resulting magnitude (λ1, λ2, λ3) and direction () are obtained by recomputing the tensor’s eigen-decomposition at each location.
From the point of view of vote analysis, filamentous structures are characterized by an unbalanced distribution of elements along one main direction. In contrast to other structures whose tensors tend to deform more evenly due to the influence from different directions, curvilinear structures produce elongated tensors. Therefore, tensors from filamentous structures are likely to be evidenced on the stick saliency map (defined as the image formed by computing λ1 – λ2 at each location (x, y, z)). Similarly, filament boundaries are evidenced on the polarity map.
2.3 Representation by 3D curve tracking
In the next step, 3D curve tracking allows for detection and labeling filaments and junctions, which can subsequently be quantified. We developed a curve tracking algorithm that iterates between (i) finding voxels to serve as seeds for tracking and (ii) linking adjacent voxels along a consistent direction. A pool of seed voxels is selected from locations (x, y, z) with high saliency (λ1 – λ2), which must be larger than a threshold. This threshold is set based on a percentage of the maximum saliency in the image, which we call Tsglobal. It determines the stop criterion for tracking all the filaments in the image. Starting from a seed, voxels are recursively linked along their tangential direction until the saliency value drops below another threshold, which forms a curve. This new threshold is set based on a percentage of the saliency of the seed that initiated the curve, which we refer to as Tslocal. It determines one of the stop criteria needed for tracking each of the filaments. Also, being local, it is less sensitive to signal heterogeneity across the image. Tangential directions for the voxels are obtained from the previously computed tensor voting map, i.e., at location (x, y, z). Both and are analyzed and the one that agrees the best (i.e., smallest dot product) with the curve’s direction is used. Curve smoothness is guaranteed by inhibiting sharp edges. Specifically, a second stop criterion for tracking each filament is determined by linking voxels with directions forming angles larger than 45° with the curve direction. Linking voxels must be locally maximum within the 3×3 planar neighborhood that is perpendicular to the tracking curve’s direction. Since the seed can be a voxel in the middle of a filament, tracking is first performed in one direction and then in the reverse direction, starting again from the same seed. The two curve segments are then concatenated to form a filament. Voxels are marked once they have been linked. To avoid tracking of the same filament multiple times, all voxels within the aforementioned 3×3 planar neighborhood, including those from the pool of seeds, are also marked and cannot be linked to another curve. Although our filament tracking approach is susceptible to slight jagging which is caused by angular quantization, it is fast and precise in regards to the main properties of the filament, i.e., location, direction and length. If the intuit is improved visualization, the tracked structures can be interpolated with splines.
Junction locations are detected from delineated filaments that intersect one another during tracking. This simplifies the process of detecting junctions directly from the tensor voting saliency map (as suggested by [15]), which can be non-trivial and time consuming. In addition, the filament width is approximated by the position of the peak in the polarity map by traversing it in the normal direction of linked voxels (). This is possible because, while saliency results in a bell shape intensity profile along the filament’s center line (the tracking direction), polarity results in a bell shape intensity profile along the edges of the filament.
3. EXPERIMENTAL RESULTS
3.1 Synthetic data
The proposed approach was initially evaluated on a synthetic 3D image of a 5 voxel-thick helix The helix is centered in an image affected by artifacts such as noise, pores and gaps. The image is binary with the background set at intensity “0,” and the foreground (e.g., the helix) at intensity “1.” We opted for a helix because of its perceived similarity with the filamentous structures observed in the plant cell wall. To evaluate our computational approach in less than ideal scenarios, two experiments were designed to corrupt the image and the helix structure: In the first experiment, we induced different levels of noise on the background and different levels of pores in the helix. In the second experiment, we added gaps of different lengths to the synthetic helix. The parameter setting was kept constant across all experiments at σHessian = 4, σTensorVoting = 10, Tslocal = 0.3 and Tsglobal = 0.3.
More specifically, in the first experiment, the image containing the helix structure was altered either by randomly adding noise (“n”) to the background or randomly adding pores (“p”) to the foreground (e.g., removing voxels from the helix). This policy leads to a perturbation matrix as shown in Table 1. Here, n = 2% means that, on average, 2 out of every 100 background voxels had a value of “1.” Similarly, p = 25% means that, on average, 25 out of every 100 foreground voxels had value “0.” For a quantitative assessment of the approach’s outcome, Precision and Recall rates were computed. The precision rate is a measure of the amount of noise present in the solution, while the Recall rate is a measure of the amount of segmented ground truth. They are computed by using:
and
where TP, FP and FN stand for True Positive, False Positive and False Negative, respectively. All three measures are computed based on the number of segmented voxels. TP is the number of segmented voxels that are in the true filaments; FP is the number of segmented voxels that are not in the true filaments; FN is the number of non-segmented voxels in the true filaments.
Table 1.
Precision and Recall ([P R]) results on synthetic helix affected by noise, “n”, and porosity, “p”.

|
0% | 1% | 2% | 5% |
|---|---|---|---|---|
| 0% | [1 1] | [1 1] | [.99 1] | [.95 1] |
| 25% | [1 1] | [1 1] | [.99 .99] | [.95 .99] |
| 50% | [1 1] | [1 .99] | [.94 .99] | [.93 .99] |
| 75% | [1 .99] | [.97 .99] | [.93 .99] | [.88 .98] |
| 95% | [.99 .98] | [.89 .98] | [.85 .97] | [.79 .97] |
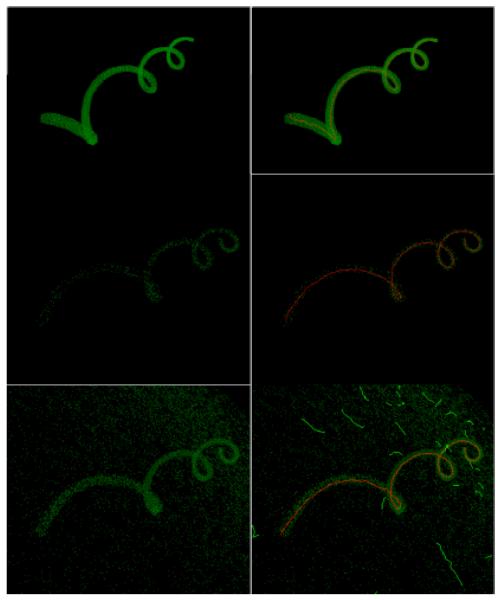
An analysis of Table 1 indicates that, as expected, segmentation deteriorated as a function of increased background noise and signal porosity. The precision rate definitely appears to be more seriously compromised at higher noise levels, which may mostly be a result of spurious filaments being created out of fortuitously aligned voxels (see Figure 4(bottom-right)). However, the consistent 97% or higher recall rate confirms the reliability of our approach in retrieving the filament structures even in severely corrupted images.
Figure 4.
Synthetic helix at different levels of noise and porosity (left column), and the results produced by our approach (right column). Top row: n=0%, p=0%; middle row: n=0%, p=95%; bottom row: n=2%, p=75%. In summary, our approach performs well in a range of scenarios, properly detecting the helix at high porosity and noise levels. However, when noise reaches an extreme limit, spurious filaments begin to form. See Table 1 for reports of the quantitative results.
Figure 4 shows representatives of the data set (left column) and the corresponding segmentation results (right column). Despite the deterioration caused by increased corruption, it is clear that the helix can still be reliably retrieved.
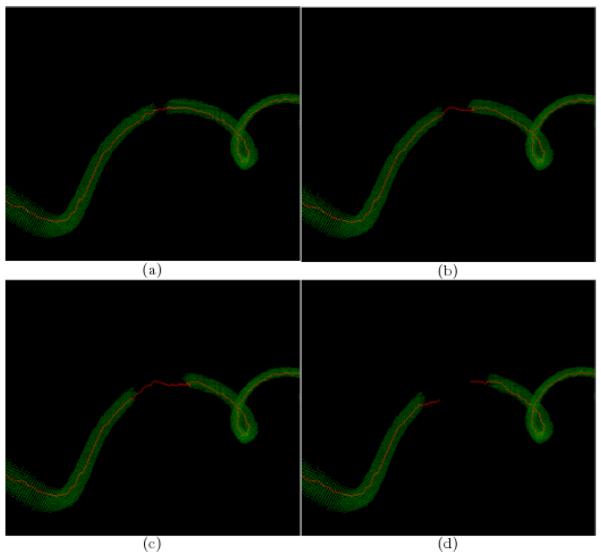
In the second experiment, gaps of varying lengths were introduced in the helix structure. Figure 5 shows representatives of the segmentation results at 5, 10, 20, and 30 voxels lengths. It is evident that at shorter gap lengths, the system performance is stable and the approach successfully reconnected the disrupted helix. It should be noted that the filament completion is a function of σTensorVoting and imposes a trade-off between correct bridging of a disrupted signal and an erroneous connection of independent filaments, which ultimately can limit interpolation.
Figure 5.
Results from filament completion for a disrupted synthetic helix. The segmented helix (in red) with gap length, in voxels, equal to (a) 6 (b) 12; (c) 21; (d) 27. In general, the method fails to bridge gaps much larger than twice the size of the tensor voting neighborhood (Here, σTensorVoting = 10).
3.2 Experiments with real samples
Our computational approach was designed to detect, complete and delineate filamentous structures in full 3D images. To this end, we prepared a set of 3D electron tomograms of plant cell wall samples to provide a real scenario for evaluation of our automatic framework. Regarding TEM sample preparation, we used a microwave-assisted chemical fixation, room temperature dehydration and resin-embedding protocol. We grew wild type Arabidopsis thaliana seeds (Col 0) in MS-agar media with 16:8 h LD cycle at 21 °C for 4 weeks. 1mm-long stem segments were fixed in 4% paraformaldehyde and 2% glutaraldehyde in 0.03M phosphate buffer (pH 7.4), with 0.5mg/ml ruthenium red, at 4 °C overnight. Samples were then rinsed in the same buffer and consecutive stem segments from the same plants were treated in parallel with three different treatments: (a) Control samples, without any further chemical treatment; (b) 0.5% ammonium oxalate at 60° C for 48 hours for pectin removal; and (c) pectin removal as in (b) followed by 4% NaOH at RT for 96 h to remove hemicelluloses and non-cellulosic polysaccharides [4, 18]. All samples were rinsed in distilled water before being fixed in 0.1% osmium tetroxide in 0.03 M phosphate buffer (pH 7.4), with 0.5mg/ml Ruthenium red, for 1 h at RT. The samples were subsequently dehydrated in acetone series (10%, 25%, 50%, 75%, 95%, 100%, twice for 45 s at 250 W for each concentration) and infiltrated in Epon-Araldite resin-acetone series (10%, 25%, 50%, 75%, 100%, thrice for 3 min at 450W for each concentration), using the Leica EM AMW automatic microwave tissue processor. Samples were incubated overnight in 100% resin and then polymerized at 60° C in a conventional oven for 2-3 days. 150 nm thick sections were cut using the Leica EM U26 ultramicrotome.
For imaging purposes, the sections were labeled with 5 nm gold fiducials on both sides, post-stained with 2% uranyl acetate in methanol for 5 min, followed by lead citrate staining for 2 min. Comparable primary cell wall areas from similar cell types (xylem tracheary elements) were located in each section with a Tecnai12 TEM (FEI), for electron tomography. Dual axis tilt series [12] were collected from +65° to −65° with 1° increments, underdefocus of 1 μm, and a voxel size of 0.79 nm, at 120 kV accelerating voltage, using the SerialEM software package [13]. Marker-based alignment of dual-axis tilt-series and their reconstruction into tomograms were done using the IMOD package [6]. Figure 6 illustrates sample views of such tomograms.
Figure 6.
TEM imaging of samples prepared through microwave-assisted chemical fixation, room temperature dehydration and resin-embedding protocol. Images show the filamentous nature of the cell wall and the increasing level of extraction from untreated (left-most) to treated with ammonium oxalate (center) and treated with ammonium oxalate plus NaOH (right-most) plant samples.
Three biological replicates were collected from each treatment group: (a) Control, (b) Ammonium Oxalate, and (c) Ammonium Oxalate+NaOH. Tomograms of 2000x2000xZ voxels length were then partitioned into 3 smaller regions of interest of 800x800xZ voxels for a total of 27 images. Z varied from 178 to 220 layers and was automatically produced by IMOD.
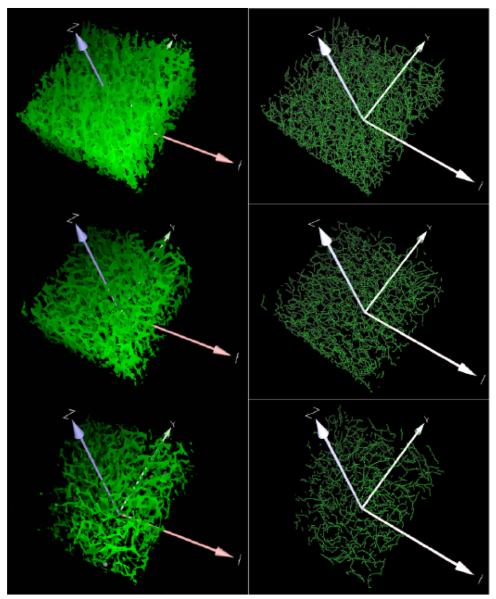
Ultimately, our computational method allows for quantification of the filamentous structures. Computed filament properties include morphometric attributes (e.g., length and width of a filament), and compositional properties (e.g., number of filaments and junctions, and percentage of polysaccharides in the image). Figure 7 shows representatives of the original tomographic images and the computed representation. Figure 8 shows that the loss in polysaccharides caused by the chemical treatments is evident.
Figure 7.
Results after enhancement, detection and completion of filaments from images in Figure 6. Images show maximum projection views of the results.
Figure 8.
Left column shows 3D views of the results after enhancement, detection and completion of filaments. Right column shows filamentous structures after curve tracking. Per our chemical treatments, top row shows control, middle row shows ammonium oxalate and bottom row shows ammonium oxalate + NaOH. Our scheme evidentiates the expected loss of polysaccharides resulting from different chemical treatments.
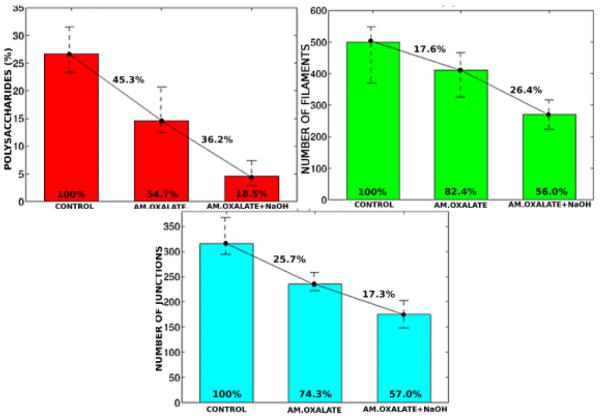
From a quantitative perspective, Figure 9(a) indicates a reduction of polysaccharides relative to the whole image for each treatment condition. It is well known that ammonium oxalate mainly removes pectins from the cell walls. It has been reported that primary cell walls in dicotyledonous plants are composed of around 35% pectins [19], and hence in reasonable agreement with the 45.3% of detectable carbohydrate loss (Figure 9(a)), particularly because our data includes the middle lamella known to contain higher concentration of pectin [2]. Additional treatment with sodium hydroxide is known to remove hemicelluloses from the cell walls. Hemicelluloses represent 20-40% of the carbohydrates in primary cell walls, hence our observed 81.5% is in reasonable agreement with the expectation of up to 75% loss of material for the combined two chemical treatments. This finding is consistent with the literature.
Figure 9.
Quantification of the plant cell wall composition across chemical treatments. (Top left) Volume of polysaccharides per treatment relative to whole imaged volume; (top right) number of filaments per treatment; (bottom) number of junctions per treatment. Bars show the average value among replicates within each treatment category. The error lines represent the variation between minimum and maximum values within replicates from the same treatment category. Cross lines show the composition change across treatments, while numbers inside the bars represent their height, both in percentage.
We observed that after the double treatment, the cell walls retained 18.5% of the total wall polysaccharides. However, neither of the treatments are known to remove cellulose. Trace amounts of hemicellulose, if tightly bound to the cellulose microfibrils, are most likely to remain unextracted as well. The residual volume of polysaccharides after double treatment accounts for the unextracted cellulose and hemicelluloses. The expected amount of cellulose is 15-30% in primary cell walls [19], and our findings are within this range. However, it should be noted here that pure cellulose does not take up the stains used for electron microscopy and hence, some of the cellulose microfibrils that are stripped of all the hemicelluloses and pectins might not be detected.
Generally speaking, pectins are heavily branched polysaccharides that are thought to make cross-connections among themselves and with other cell wall polysaccharides. In contrast, hemicelluloses are long filamentous polysaccharides with less branching compared to pectins. Hemicelluloses are also thought to interact with the cellulose microfibrils either by coating some parts of it or creating junctions with another cellulose microfibrils in the same local neighborhood. Hemicelluloses may possibly interact with cell wall pectins as well [2]. An important contribution of our computational protocol is that it goes beyond volumetric quantification of the samples by concomitantly characterizing compositional and morphometric attributes of the plant cell wall. Our analyses show that ammonium oxalate caused (i) a decrease in number of filaments by 17.6% (Figure 9(b)) and (ii) a decrease in junctions by 25.7% (Figure 9(c)). After subsequent extraction with sodium hydroxide, the number of filaments decreased by 44.0% (Figure 9(b)), where 26.4% loss of filaments was due to sodium hydroxide treatment alone. Due to the same treatment, the number of junctions decreased by 43.0% (Figure 9(c)) out of which, only 17.3% was caused by sodium hydroxide treatment alone. The loss of large number of junctions in addition to filaments is consistent with reports from the literature in that pectins and hemicelluloses make cross-connections in primary cell walls. However, in absolute terms, the number of junctions between filaments are not consistent with the literature under control (e.g., untreated) conditions. Our qualitative observation indicate that larger number of junctions may be simply not visible. This is the current area of our research in improving the sample preparation.
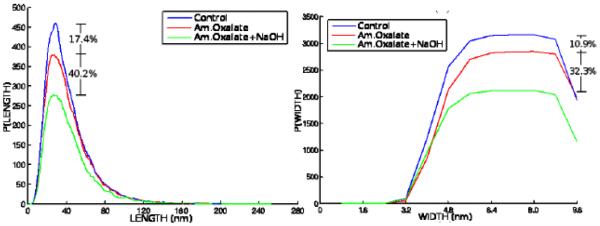
In a deeper look into the structural properties of filaments, our analysis shows that even though the treatments caused loss in cell wall polysaccharides, the distribution of length and width of filaments remained unchanged after the chemical treatments (Figure 10). The breakdown products of ammonium oxalate and sodium hydroxide are soluble in the treatment chemicals and most likely are washed away during sample processing. This could explain the lack of increase in number of smaller fragments in spite of decrease in number of long filaments in the chemically treated walls (Figure 10(a)). Note that cellulose microfibrils are reported to be 3-10 nm in diameter [2]. Width of hemicelluloses and pectins are not known with certainty, but based on their chemical formula they can be expected to range between 2 and 4 nm. The filaments detected in our analysis possibly account for cellulose microfibrils coated with hemicellulose and pectins. It should be noted here that the stains used for electron microscopy also add to the filament width. The fact that we see higher loss of thick filaments because of the treatments (Figure 10(b)), more so with sodium hydroxide removal of hemicelluloses, also supports the idea that the thicker filaments are most likely to be cellulose microfibrils coated with hemicellulose and pectins. When the cellulose microfibrils are completely stripped of the other polysaccharides due to the treatments, they will be closer to 2-3 nm in width and most likely become undetectable due to known staining limitations of pure cellulose [22].
Figure 10.
Histograms of length (left) and width (right) reveal the profile of filamentous structures and how they change as a function of the chemical treatments. Such results permit quantification of the progressive change in filament morphometric properties caused by chemical removal of polysaccharides. The relative loss of material is illustrated at the histogram location that showed the maximum variation across treatments.
4. CONCLUSIONS
We presented a computational protocol for automatic segmentation of filamentous structures imaged by tomographic electron microscopy. Our approach is based on enhancement, detection, completion and segmentation of filamentous networks. The tensor voting framework is a fundamental part the proposed approach. It does not use shape priors or shape templates and is shown to inhibit noise while enhancing signal and maintaining structural integrity through gap filling. We have validated the utility of our approach by using synthetic data and by introducing artifacts to the data. Subsequently, the method was applied to biological samples under different treatment conditions to quantify both compositional and morphometric properties of the plant cell wall. Our results were validated with prior literature, indicating consistency; however, new research questions were simultaneously raised. In summary, proposed computational protocol is a promising approach for quantifying composition of filamentous structures from different species and/or within species under different experimental conditions. Ultimately, these methods can be utilized for better understanding of the mechanical property of the plant cell wall.
Acknowledgement
This research was supported by (i) the Energy Biosciences Institute, U.C. Berkeley (EBI grant No. 007G18), (ii) the National Cancer Institute (grant No. R01CA140663) under Contract No. DE-AC02-05CH11231, and (iii) the National Institute of Health (grant No. 2 P01 GM051487-15). 1
Footnotes
DISCLAIMER: This document was prepared as an account of work sponsored by the United States Government. While this document is believed to contain correct information, neither the United States Government nor any agency thereof, nor the Regents of the University of California, nor any of their employees, makes any warranty, express or implied, or assumes any legal responsibility for the accuracy, completeness, or usefulness of any information, apparatus, product, or process disclosed, or represents that its use would not infringe privately owned rights. Reference herein to any specific commercial product, process, or service by its trade name, trademark, manufacturer, or otherwise, does not necessarily constitute or imply its endorsement, recommendation, or favoring by the United States Government or any agency thereof, or the Regents of the University of California. The views and opinions of authors expressed herein do not necessarily state or reflect those of the United States Government or any agency thereof or the Regents of the University of California.
Categories and Subject Descriptors
I.4.6 [Computing Methodologies]: Image Processing and Computer Vision—Segmentation
5. REFERENCES
- [1].Ding S, Himmel M. The maize primary cell wall microfibril: A new model derived from direct visualization. J. Agric. Food Chem. 2006;54:597–606. doi: 10.1021/jf051851z. [DOI] [PubMed] [Google Scholar]
- [2].A P, et al. Plant cell walls : from chemistry to biology. Garland Science; New York, NY: 2011. [Google Scholar]
- [3].Frangi AF. Ph.D. Thesis. Utrecht University; The Netherlands: 2001. Three-dimensional model-based analysis of vascular and cardiac images. [Google Scholar]
- [4].Jensen W. The composition of the developing primary wall in onion root tip cells .ii. cytochemical localization. Am. J. Botany. 1960;47:287–295. [Google Scholar]
- [5].Jiang M, Ji Q, McEwen B. Model-based automated extraction of microtubules from electron tomography volume. IEEE Trans. Inf. Technol. Biomed. 2006;10:608–617. doi: 10.1109/titb.2006.872042. [DOI] [PubMed] [Google Scholar]
- [6].Kremer J, Mastronarde D, McIntosh J. Computer visualization of three-dimensional image data using imod. J. Struct. Biol. 1996;116:71–76. doi: 10.1006/jsbi.1996.0013. [DOI] [PubMed] [Google Scholar]
- [7].Lindeberg T. Feature detection with automatic scale selection. Int. J. Computer Vision. 1998;30(2):77–116. [Google Scholar]
- [8].Lorenz C, Carlsen IC, Buzug TM, Fassnacht1 C, Weese J. Multi-scale line segmentation with automatic estimation of width, contrast and tangential direction in 2d and 3d medical images. Lecture Notes in Computer Science. 1997;1205:233–242. [Google Scholar]
- [9].Loss L, Bebis G, Nicolescu M, Skurikhin A. An iterative multi-scale tensor voting scheme for perceptual grouping of natural shapes in cluttered backgrounds. J. Computer Vision and Image Understanding. 2009;113(1):126–149. [Google Scholar]
- [10].Loss L, Bebis G, Parvin B. Iterative tensor voting for perceptual grouping of ill-defined curvilinear structures. IEEE Trans. on Medical Imaging. 2011;30(8):1503–1513. doi: 10.1109/TMI.2011.2129526. [DOI] [PMC free article] [PubMed] [Google Scholar]
- [11].MacKinnon I, Sturcova A, Sugimoto-Shirasu K, His I, McCann M. Cell-wall structure and anisotropy in procuste a cellulose synthase mutant of arabidopsis thaliana. Planta. 2006;224:438–448. doi: 10.1007/s00425-005-0208-6. [DOI] [PubMed] [Google Scholar]
- [12].Mastronarde DN. Dual-axis tomography: An approach with alignment methods that preserve resolution. J. Structural Biology. 1997;120:343–352. doi: 10.1006/jsbi.1997.3919. [DOI] [PubMed] [Google Scholar]
- [13].Mastronarde DN. Automated electron microscope tomography using robust prediction of specimen movements. J. Structural Biology. 2005;152:36–51. doi: 10.1016/j.jsb.2005.07.007. [DOI] [PubMed] [Google Scholar]
- [14].McCann M, Wells B, Roberts K. Direct visualization of cross-links in the primary plant cell wall. J. Cell. Science. 1990;96:323–334. [Google Scholar]
- [15].Medioni G, Lee M-S, Tang C-K. A computational framework for feature extraction and segmentation. Elsevier Science. 2000 [Google Scholar]
- [16].Rigorta A, GÃijnthera D, Hegerla R, Baumb D, Weberb B, Prohaskab S, Medaliac O, Baumeistera W, Hegeb H-C. Automated segmentation of electron tomograms for a quantitative description of actin filament networks. J. Structural Biology. 2012;177(1):135–144. doi: 10.1016/j.jsb.2011.08.012. [DOI] [PubMed] [Google Scholar]
- [17].Sato Y, Nakajima S, Shiraga N, Atsumi H, Yoshida S, et al. 3d multi-scale line filter for segmentation and visualization of curvilinear structures in medical images. Lecture Notes in Computer Science. 1998;1205:213–222. doi: 10.1016/s1361-8415(98)80009-1. [DOI] [PubMed] [Google Scholar]
- [18].Saxton C, Jewell G. The morphological changes produced in cauliflower stems during pickling, and their relationship to texture parameters. J. Food Technol. 1969;4:363–375. [Google Scholar]
- [19].Sticklen M. Plant genetic engineering for biofuel production: towards affordable cellulosic ethanol. Nat. Rev. Genet. 2008;9(6):433–443. doi: 10.1038/nrg2336. [DOI] [PubMed] [Google Scholar]
- [20].Sugimoto K, Williamson R, Wasteneys G. New techniques enable comparative analysis of microtubule orientation, wall texture, and growth rate in intact roots of arabidopsis. Plant Physiology. 2000;124:1493–1506. doi: 10.1104/pp.124.4.1493. [DOI] [PMC free article] [PubMed] [Google Scholar]
- [21].Wertheimer M. Laws of journal in perceptual forms (english title) II. Psychologische Forschung. 1923;4:301–305. [Google Scholar]
- [22].Xu P, Donaldson L, Gergely Z, Staehelin L. Dual-axis electron tomography: a new approach for investigating the spatial journal of wood cellulose microfiA̧brils. Wood Sci. Tech. 2007;41:101–116. [Google Scholar]
- [23].Xu P, Liu H, Donaldson L, Zhang Y. Mechanical performance and cellulose microfibrils in wood with high s2 microfibril angles. J. Mater. Sci. 2011;46:534–540. [Google Scholar]


