Abstract
Purpose
To improve our understanding of central serous chorioretinopathy (CSC), we performed an analysis of noninvasive, high-resolution retinal imaging in patients with active and resolved CSC.
Methods
Adaptive optics scanning light ophthalmoscopy (AOSLO) and spectral-domain optical coherence tomography (SD-OCT) were performed on five subjects with CSC. A custom AOSLO system was used to simultaneously collect confocal and split-detector images. Spectral domain–OCT volume scans were used to create en face views of various retinal layers, which then were compared to montaged AOSLO images after coregistration.
Results
Three distinct types of intraretinal hyperreflective clusters were seen with AOSLO. These clusters had a well-demarcated, round, and granular appearance. Clusters in active CSC over areas of serous retinal detachment were termed type-1. They were found primarily in the outer nuclear layer (ONL) and were associated with large defects in the photoreceptor mosaic and ellipsoid zone. Clusters in areas where the retina had reattached were termed type-2. They also were located primarily in the ONL but showed stability in location over a period of at least 8 months. Smaller clusters in the inner retina along retinal capillaries were termed type-3.
Conclusions
Retinal imaging in CSC using en face OCT and AOSLO allows precise localization of intraretinal structures and detection of features that cannot be seen with SD-OCT alone. These findings may provide greater insight into the pathophysiology of the active and resolved phases of the disease, and support the hypothesis that intraretinal hyperreflective foci on OCT in CSC are cellular in nature.
Keywords: central serous chorioretinopathy, adaptive optics, optical coherence tomography, hyperreflective foci, photoreceptors
Central serous chorioretinopathy (CSC) is an eye disease characterized by serous retinal detachment and/or pigment epithelial detachment (PED), generally confined to the macula, and often is associated with leakage of fluid through a defect in the RPE into the subretinal space. Central serous chorioretinopathy generally resolves spontaneously within a few months with minimal sequelae, but chronic disease can lead to widespread RPE damage, photoreceptor death, and permanent vision loss.1
Various morphologic changes of the retina in CSC have been described using optical coherence tomography (OCT), including PED, subretinal exudates, retinal cystic changes, and increased thickness of the photoreceptor outer segments (OS) at the detached retina.2–6 The development of spectral-domain OCT (SD-OCT) allowed for improved imaging sensitivity and signal-to-noise ratio,7,8 which led to the discovery of subtler outer retinal findings. For example, the external limiting membrane (ELM) generally was found to persist at the area of retinal detachment, while the ellipsoid zone (EZ; also referred to as the inner/OS junction9–11) often became disrupted or irregular.12 Thinning of the outer nuclear layer (ONL) at the detached portion of the retina also was described, suggesting apoptosis of the photoreceptor cells.13 Intraretinal hyperreflective foci or hyperreflective dots have been described in patients with active CSC. The hyperreflective foci were thought to possibly represent accumulations of proteins or activated microglia or macrophages with phagocytized OS.14,15
Despite the advances provided by SD-OCT, the lateral resolution (15–20 μm for commercial systems) precludes the visualization of many small cellular structures. The advent of adaptive optics (AO) ophthalmic imaging to correct the monochromatic aberrations in the eye allows for improved lateral resolution in retinal imaging. When combined with scanning light ophthalmoscopy (SLO), lateral resolution at the retina can reach as high as 2 μm, approaching the theoretical diffraction limit imposed by the eye.16,17 Reflectance confocal AOSLO allows for visualization of individual photoreceptors, including at the foveal center. A nonconfocal variation of AOSLO called split-detector also has been developed. This method enables the visualizing of certain structures that cannot be seen with the standard confocal technique, such as cone inner segments of non-waveguiding photoreceptors.18
We used confocal and split-detector AOSLO to study intraretinal structures in subjects with active and resolved CSC. Adaptive optics SLO results also were compared to those obtained with SD-OCT.
Methods
Human Subjects
Five subjects who were diagnosed with CSC were recruited for this study at the Medical College of Wisconsin (Milwaukee, WI, USA). Informed consent was obtained from all subjects after explanation of the nature and possible consequences of the study. The study protocol was approved by the Institutional Review Board at the Medical College of Wisconsin and was conducted in accordance with the tenets of the Declaration of Helsinki. Patients were diagnosed by clinical examination, fluorescein angiography, autofluorescence imaging, and SD-OCT. Axial length measurements were obtained on all subjects (Zeiss IOL Master; Carl Zeiss Meditec, Dublin, CA, USA) to determine the scale of retinal images. Subjects were dilated with phenylephrine hydrochloride 2.5% and tropicamide 1% before all imaging.
Spectral-Domain Optical Coherence Tomography
Images were obtained using a Bioptigen SD-OCT (Bioptigen, Research Triangle Park, NC, USA). Horizontal and vertical line scan sets were acquired (640 A-scans/B-scan; 120 repeated B-scans) through the foveal center with a nominal scan length of 7 mm. Scans were registered and averaged as described previously to increase the signal-to-noise ratio.19 Volume scans (640 A-scans/B-scan; 400 B-scans/volume) were acquired over a nominal 3 × 3 mm area with horizontal and vertical B-scans. Each B-scan within the volume scan was aligned and manually segmented to create en face views as described previously.20,21 En face OCT images were generated for the ONL, ELM, and EZ, each using a thin contour to avoid contamination from other layers of the retina and create the highest-contrast image. Active CSC was defined as the presence of subretinal fluid on OCT, while resolved CSC was defined as the resolution of fluid and reattachment of the retina.
Adaptive Optics Scanning Light Ophthalmoscopy
A custom AOSLO system was used for this study,22 which was modified to simultaneously acquire confocal and split-detector images.18 Imaging sequences consisted of 150 frames, which were processed to remove distortions from the sinusoidal scanning motion and then registered using a strip registration method described previously.23 Up to 40 registered frames with the highest normalized cross-correlation then were averaged to increase the signal-to-noise ratio. Because the confocal and split-detector images were collected in synchrony, the same registration transforms were applied to both, resulting in perfect spatial registration. These images then were montaged using Adobe Photoshop (Adobe Systems, San Jose, CA, USA). At each imaging session, the main region of interest was captured with a set of at least nine images, each with a 1.0° field of view. This set usually was centered on fixation with 0.6° intervals between images. Temporal and superior strips also were acquired, which extended 5° to 10° peripherally from the region of interest using images with a 1.5° or 2.0° field of view. All images were focused on the photoreceptor mosaic or hyperreflective clusters when present.
Measurement of Intraretinal Hyperreflective Clusters
Cluster location was determined after manual coregistration of the AOSLO montage and en face OCT images using Adobe Photoshop. The greatest linear dimension of each hyperreflective cluster was measured manually on the AOSLO image. Clusters located in the outer retina were included for analysis if they were in focus on confocal AOSLO and corresponded to the location of hyperreflective foci in the ONL on en face OCT. In the inner retina, clusters were included for analysis if they were in focus in the plane of the retinal capillaries. The results are expressed as the mean ± SD.
Results
Subject JK_1190 underwent four imaging sessions. The first two sessions took place during active CSC, and the final two sessions took place during resolved CSC. The first imaging session took place 1 month after diagnosis, and the final imaging session took place 13 months after diagnosis. This subject also underwent inner retinal imaging during all sessions and split-detector AOSLO imaging during the final session. Subject DW_1227 underwent two imaging sessions. The first imaging session took place 9 months after diagnosis during active but improving disease, and the final imaging session took place 14 months after diagnosis during resolved CSC. Subject DW_1188 underwent two imaging sessions 7 months apart, both during active CSC. Subjects DW_1175 and DW_1178 each underwent one imaging session with active and resolved CSC, respectively.
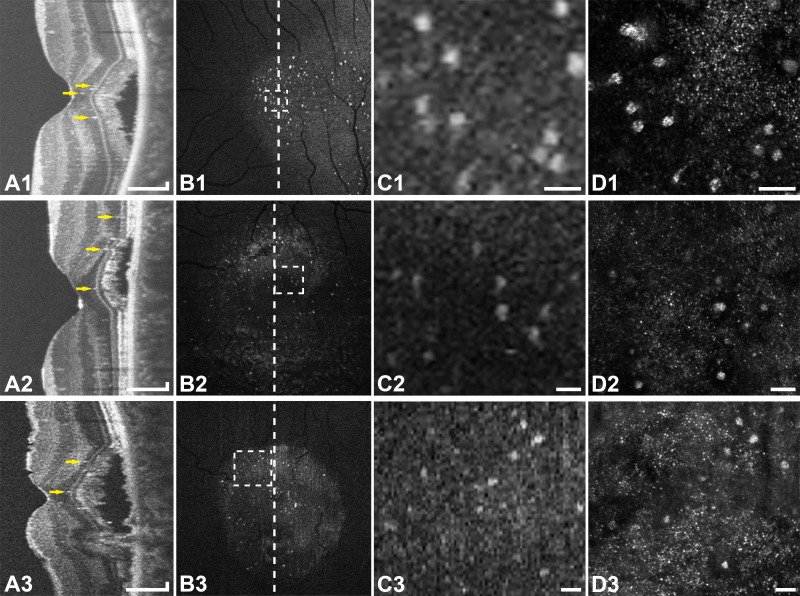
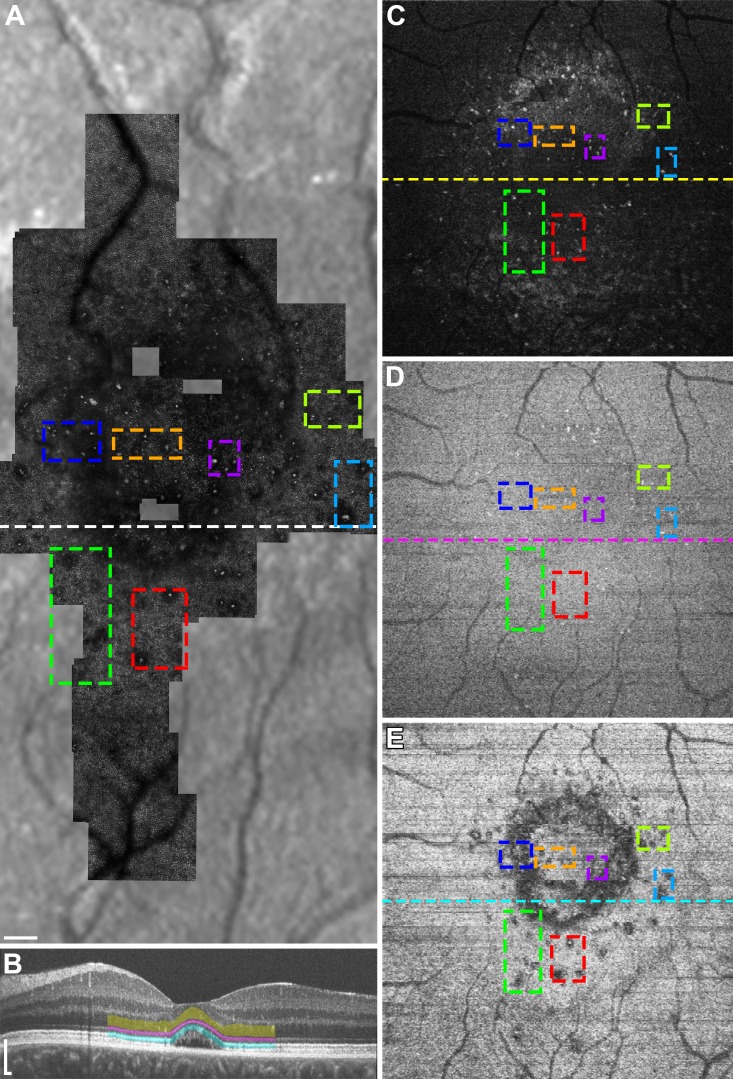
Hyperreflective clusters were found in all subjects using confocal AOSLO. The clusters were round with a distinct border and had a granular appearance. Clusters found in active CSC over areas of subretinal fluid were located primarily in the ONL, but also were seen within the ELM and EZ (Fig. 1). These clusters were surrounded by dark areas or defects in the photoreceptor mosaic, which corresponded with hyporeflectivity of the EZ on OCT (Fig. 2). Between each hyperreflective cluster and dark area in the photoreceptor mosaic, the ELM remained intact and homogeneous in reflectivity. The mean size of the clusters (n = 170) within the detached retina, as measured by greatest linear dimension, was 24.7 ± 7.6 μm.
Figure 1.
Multimodal imaging of active CSC in subjects JK_1190 (top row), DW_1227 (middle row), and DW_1175 (bottom row). (A1–3) Optical coherence tomography line scans show hyperreflective foci (arrows) primarily in the ONL. (B1–3) En face OCT images of the ONL show numerous hyperreflective foci within that layer. The vertical lines indicate the location of the OCT line scans (A1–3). (C1–3) Enlarged en face OCT images corresponding to the location of the rectangles in (B1–3). (D1–3) Confocal AOSLO at the location of (C1–3) shows type-1 hyperreflective clusters with associated dark areas in the photoreceptor mosaic. The clusters seen with AOSLO correspond to the location of the hyperreflective foci on en face OCT. Scale bars: 150 μm (A1–3) and 50 μm (C1–3, D1–3).
Figure 2.
Multimodal imaging of subject DW_1227 during active CSC. Colored boxes are added to compare given regions between different imaging modalities and retinal layers. (A) Confocal AOSLO montage overlaid onto an infrared reflectance SLO image shows type-1 hyperreflective clusters with associated dark areas in the photoreceptor mosaic. (B) Optical coherence tomography line scan at the location of the horizontal line in (A) with manual segmentation of the ONL (yellow), ELM (magenta), and EZ (cyan). (C–D) En face OCT images of the ONL (C), ELM (D), and EZ (E) corresponding to the location of the colored bands in (B). The horizontal lines represent the location of the OCT line scan in (B). Many of the hyperreflective clusters in (A) are seen as hyperreflective foci in the ONL (C), as well as the ELM (D) and EZ (E). The dark areas associated with the clusters in (A) are seen as areas of EZ disruption (E). Scale bars: 150 μm.
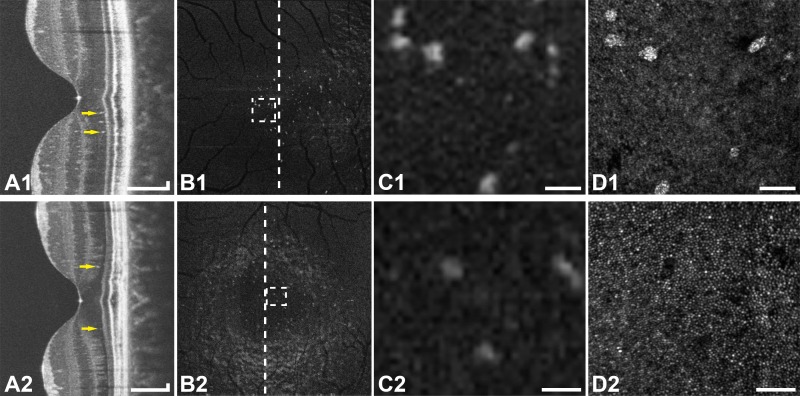
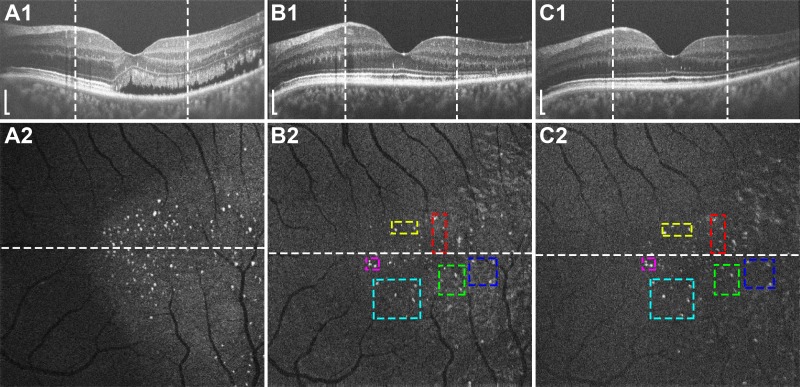
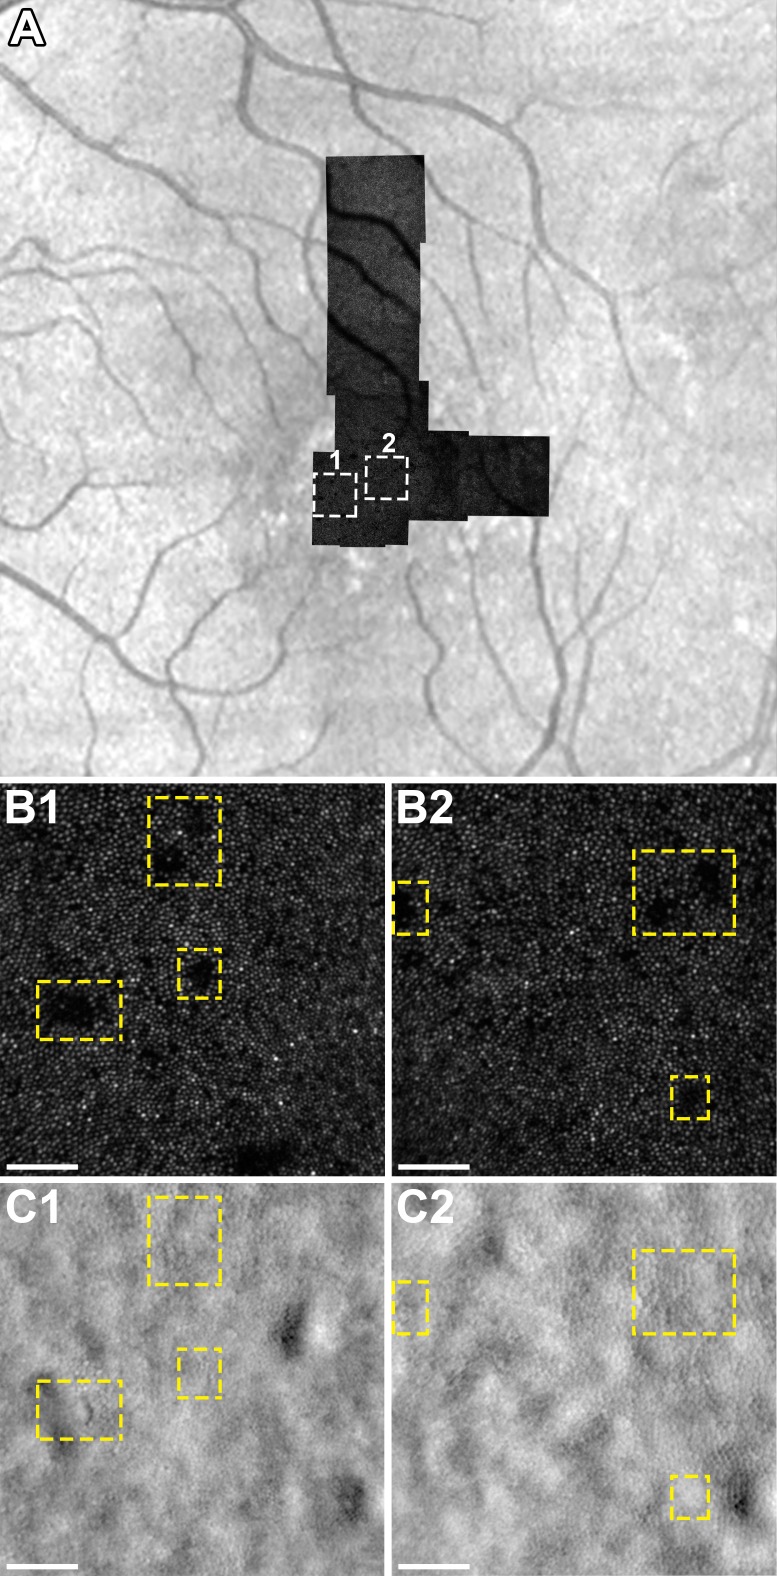
Clusters within areas of the retina that had reattached also were located primarily in the ONL (Fig. 3). Many of these clusters remained stable in location throughout an 8-month follow-up period (Fig. 4). The mean size of these clusters, as measured by greatest linear dimension, was 19.9 ± 6.0 μm (n = 28). These clusters also were associated with dark areas in the photoreceptor mosaic that correspond to areas of EZ disruption; however, the dark areas were smaller than those associated with clusters within detached retina. Split-detector images were collected during the final imaging session with subject JK_1190 during resolved CSC. This imaging modality showed that the dark areas seen with confocal AOSLO contain photoreceptor inner segments (Fig. 5).
Figure 3.
Multimodal imaging of resolved CSC in subjects JK_1190 (top row) and DW_1227 (bottom row). (A1–2) Optical coherence tomography line scans show hyperreflective foci (arrows) in the ONL. (B1–2) En face OCT images of the ONL show hyperreflective foci within that layer. The vertical lines indicate the location of the OCT line scans (A1–2). (C1–2) Enlarged en face OCT images corresponding to the location of the rectangles in (B1–2). (D1–2) Confocal AOSLO at the location of (C1–2) shows type-2 hyperreflective clusters (D1) or the corresponding dark areas in the photoreceptor mosaic (D2), depending on the level of focus. Scale bars: 150 μm (A1–2) and 50 μm (C1–2, D1–2).
Figure 4.
Longitudinal imaging of subject JK_1190 showing OCT line scans (top row) with vertical lines representing the boundaries of the en face OCT images of the ONL (bottom row). The horizontal lines represent the location of the OCT line scans. Imaging took place during active CSC (A1–2) and during resolved CSC 4 (B1–2) and 12 (C1–2) months later. Colored boxes are added to compare given regions between different time points. Many of the hyperreflective foci are stable in location between time points (B) and (C). Scale bars: 150 μm.
Figure 5.
(A) Confocal AOSLO montage of subject JK-1190 during resolved CSC overlaid onto an infrared reflectance SLO image with rectangles (1) and (2) corresponding to the location of insets (B1, C1) and (B2, C2), respectively. (B1-2) Confocal AOSLO shows dark areas in the photoreceptor mosaic, which correspond to the location of type-2 hyperreflective clusters (not shown). (C1-2) Split-detector AOSLO at the location of (B1-2) shows cone inner segments within the areas that appear dark on confocal AOSLO (dashed rectangles). Scale bars: 50 μm.
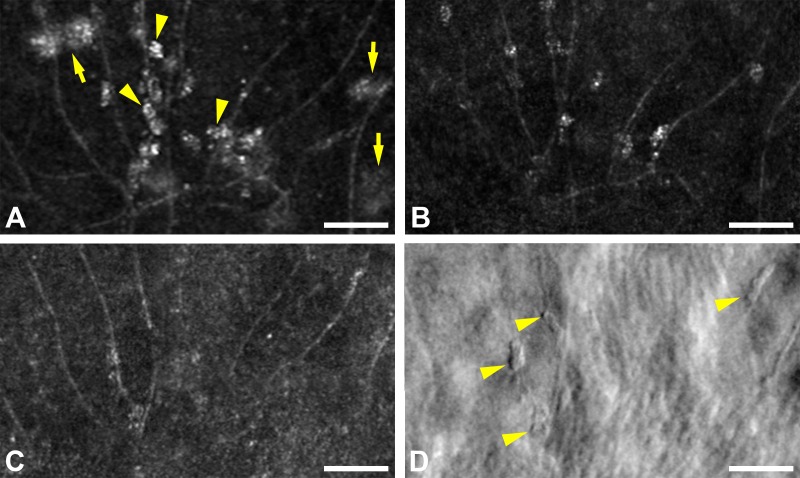
Hyperreflective clusters also were discovered along the capillaries in the inner retina (Fig. 6). These clusters were smaller than the other two types of clusters with the mean greatest linear dimension being 15.3 ± 4.1 μm (n = 28). They also differed markedly from clusters in the outer retina in appearance with split-detector imaging, with the former having clearly demarcated borders (Fig. 6D) and the latter being much more indistinct (not shown). The clusters along the retinal capillaries seemed more prevalent during the imaging session of active CSC, compared to the two imaging sessions of resolved disease.
Figure 6.
(A) Confocal AOSLO image during active CSC in subject JK_1190 shows type-3 clusters along the retinal capillaries (arrowheads). Larger type-1 clusters in the outer retina also are visible (arrows), but are out of focus. The same area 2 (B) and 10 (C) months later, both during resolved disease, shows persistent but less prevalent clusters. (D) Perivascular clusters that are faintly seen in (C) are clearly demarcated with split-detector AOSLO (arrowheads). Scale bars: 50 μm.
Discussion
We observed multiple intraretinal hyperreflective clusters in subjects with CSC using confocal and split-detector AOSLO. By comparing different imaging modalities, we classified these clusters into three distinct types, which we termed type-1, type-2, and type-3 (Table).
Table.
Types of Intraretinal Hyperreflective Clusters and Characteristics

Clusters in the areas of detached retina were labeled type-1 and were located primarily in the ONL as demonstrated using en face OCT (Fig. 1). Some of the hyperreflective clusters seen in the AOSLO images did not have a corresponding hyperreflective focus on en face OCT. These represented structures that are located outside of the contour used to generate the en face OCT of the ONL. Moreover, the AOSLO has a large depth of focus (∼30 μm), but cannot necessarily capture the entire width of the ONL when the level of focus is set on the photoreceptor mosaic. This explains why some structures seen on en face OCT of the ONL were not visible on AOSLO. It also should be noted that small distortions are present in the AOSLO and en face OCT images due to the scanning nature of the imaging systems and the fact that the eye moves during image acquisition. This prevents perfect colocalization of structures on AOSLO and en face OCT. Nevertheless, the overall concordance between the two imaging modalities was excellent, as demonstrated in Figures 1 and 3.
Adaptive optics SLO showed that type-1 hyperreflective clusters are associated with dark areas or defects of the photoreceptor mosaic that surrounded the individual clusters. Dark areas in the photoreceptor mosaic in CSC have been described previously by Ooto et al.24 using AOSLO and were attributed to lost or damaged cones. Our study demonstrated that the dark areas tend to correspond to the areas of hyporeflectivity within the EZ and also often are associated with hyperreflective clusters in the ONL (Fig. 1).
The ELM between the EZ and the hyperreflective clusters did not show signs of disruption on en face OCT (Fig. 2). One possibility for this finding is that the clusters cause displacement of the photoreceptor cell bodies, which is transmitted to the photoreceptor OS, thereby altering the OS alignment. Light reflected off the retina is directionally sensitive as described by the optical Stiles-Crawford effect,25 and this effect is thought to be due to the waveguiding properties and angular tuning of individual cones.26–28 Split-detector AOSLO detects multiple-scattered light from photoreceptor inner segments, and enables visualization of these structures regardless of the wave-guiding status of the OS. With split-detector, we have shown that some of the dark areas on confocal imaging contain cone photoreceptors (Fig. 5C), though we only obtained split-detector images in resolved CSC. The explanation for the darker areas on the split-detector images themselves is not well-established, but may be due to the subtraction of the left from right halves of the recorded nonconfocal signal in areas of small undulations of the photoreceptor inner segments.
Clusters found in areas where the retina had reattached were labeled type-2 clusters. These clusters also were associated with dark areas in the photoreceptor mosaic, though they were smaller than the dark areas associated with type-1 clusters. The presence of hyperreflective clusters/foci in resolved CSC contrasts with several studies, which described these structures on OCT as being confined to areas of serous retinal detachment.14,15,29,30 It is likely that these studies were describing the more numerous and slightly larger type-1 clusters. Unlike type-1 clusters, which seem to be transient, type-2 clusters remained stable in location. The duration of their stability will require further follow-up, but in subject JK_1190, these structures remained in the same location for 8 months (Fig. 4). Given this stability, these structures are less likely to be migratory cells, but could represent residual cellular debris.
Type-3 clusters are those that are located along the retinal capillaries in the inner retina (Fig. 6). These clusters are not seen clearly on OCT and to our knowledge have not been described previously in CSC, likely due to their small size. They resemble the vessel-associated macrophages seen in immunohistochemical-stained retina studies.31–34 Shen et al.34 described increased macrophages that lined the retinal vessels and wrapped around the smaller vessels in ischemic retinas. They were localized to areas of vascular sprouting as well as vascular regression. Other studies also have determined that macrophages, as well as microglia, have a role in vascular growth and regression, but with a larger contribution from macrophages.31,32
The identity and significance of the intraretinal hyperreflective clusters are currently unknown, though it is clear that type-1 and possibly type-2 hyperreflective clusters represent the intraretinal hyperreflective foci previously described on OCT. Others have hypothesized that intraretinal hyperreflective foci are an accumulation of proteins or lipids, activated microglia, or macrophages with phagocytized OS.14,15,35 During retinal detachment, microglia have been shown to become activated and migrate toward the outer retina. The microglial cell response also was highly localized to the detached areas of the retina.36 The AOSLO features support the hypothesis that the hyperreflective foci are cellular in nature, rather than deposits of material given their discrete, granular, and demarcated appearance and consistent size.
We observed multiple hyperreflective clusters in the inner and outer retina in eyes with active and resolved CSC using AOSLO. Confocal and split-detector AOSLO provides information about these structures that could not be obtained with OCT alone, such as their granular appearance, size, association with retinal vessels, and relationship with the photoreceptor mosaic. This allowed us to categorize the clusters into three distinct types and provided evidence that the clusters may be cellular in nature. The combined use of en face OCT with AOSLO allows for precise axial and lateral localization. Larger studies with longitudinal follow-up using AOSLO are needed to determine the clinical significance of these clusters and their relationship to the pathogenesis and resolution of CSC.
Acknowledgments
The authors thank Melissa A. Wilk and Alfredo Dubra for their contributions.
Supported by the National Eye Institute of the National Institutes of Health (Bethesda, MD, USA) under award numbers T32EY014537, T32GM080202, and P30EY001931. This investigation was conducted in a facility constructed with support from Research Facilities Improvement Program, Grant Number C06RR016511, from the National Center for Research Resources, National Institutes of Health. Also supported by the Thomas M. Aaberg, Sr., Retina Research Fund and an unrestricted departmental grant from Research to Prevent Blindness, Inc. (New York, NY, USA) to the Department of Ophthalmology at the Medical College of Wisconsin.
Disclosure: R.N. Vogel, None; C.S. Langlo, None; D. Scoles, None; J. Carroll, None; D.V. Weinberg, None; J.E. Kim, None
References
- 1. Nicholson B,, Noble J,, Forooghian F,, Meyerle C. Central serous chorioretinopathy: update on pathophysiology and treatment. Surv Ophthalmol. 2013; 58: 103–126. [DOI] [PMC free article] [PubMed] [Google Scholar]
- 2. Hussain N,, Baskar A,, Ram LM,, Das T. Optical coherence tomographic pattern of fluorescein angiographic leakage site in acute central serous chorioretinopathy. Clin Experiment Ophthalmol. 2006; 34: 137–140. [DOI] [PubMed] [Google Scholar]
- 3. Iida T,, Yannuzzi LA,, Spaide RF,, Borodoker N,, Carvalho CA,, Negrao S. Cystoid macular degeneration in chronic central serous chorioretinopathy. Retina. 2003; 23: 1–7. [DOI] [PubMed] [Google Scholar]
- 4. Iida T,, Hagimura N,, Sato T,, Kishi S. Evaluation of central serous chorioretinopathy with optical coherence tomography. Am J Ophthalmol. 2000; 129: 16–20. [DOI] [PubMed] [Google Scholar]
- 5. Mitarai K,, Gomi F,, Tano Y. Three-dimensional optical coherence tomographic findings in central serous chorioretinopathy. Graefes Arch Clin Exp Ophthalmol. 2006; 244: 1415–1420. [DOI] [PubMed] [Google Scholar]
- 6. Piccolino FC,, de la Longrais RR,, Ravera G,, et al. The foveal photoreceptor layer and visual acuity loss in central serous chorioretinopathy. Am J Ophthalmol. 2005; 139: 87–99. [DOI] [PubMed] [Google Scholar]
- 7. Leitgeb R,, Hitzenberger C,, Fercher A. Performance of fourier domain vs. time domain optical coherence tomography. Opt Express. 2003; 11: 889–894. [DOI] [PubMed] [Google Scholar]
- 8. de Boer JF,, Cense B,, Park BH,, Pierce MC,, Tearney GJ,, Bouma BE. Improved signal-to-noise ratio in spectral-domain compared with time-domain optical coherence tomography. Opt Lett. 2003; 28: 2067–2069. [DOI] [PubMed] [Google Scholar]
- 9. Spaide RF,, Curcio CA. Anatomical correlates to the bands seen in the outer retina by optical coherence tomography: literature review and model. Retina. 2011; 31: 1609–1619. [DOI] [PMC free article] [PubMed] [Google Scholar]
- 10. Staurenghi G, Sadda S, Chakravarthy U, Spaide RF; International Nomenclature for Optical Coherence Tomography (IN•OCT) Panel. . Proposed lexicon for anatomic landmarks in normal posterior segment spectral-domain optical coherence tomography: the IN•OCT consensus. Ophthalmology. 2014; 121: 1572–1578. [DOI] [PubMed] [Google Scholar]
- 11. Jonnal RS,, Kocaoglu OP,, Zawadzki RJ,, Lee S-H,, Werner JS,, Miller DT. The cellular origins of the outer retinal bands in optical coherence tomography images. Invest Ophthalmol Vis Sci. 2014; 55: 7904–7918. [DOI] [PMC free article] [PubMed] [Google Scholar]
- 12. Kim HC,, Cho W. Bin, Chung H. Morphologic changes in acute central serous chorioretinopathy using spectral domain optical coherence tomography. Korean J Ophthalmol. 2012; 26: 347–354. [DOI] [PMC free article] [PubMed] [Google Scholar]
- 13. Matsumoto H,, Kishi S,, Otani T,, Sato T. Elongation of photoreceptor outer segment in central serous chorioretinopathy. Am J Ophthalmol. 2008; 145: 162–168. [DOI] [PubMed] [Google Scholar]
- 14. Turgut B,, Yildirim H. The causes of hyperreflective dots in optical coherence tomography excluding diabetic macular edema and retinal venous occlusions. Open Ophthalmol J. 2015; 9: 36–40. [DOI] [PMC free article] [PubMed] [Google Scholar]
- 15. Kon Y,, Iida T,, Maruko I,, Saito M. The optical coherence tomography-ophthalmoscope for examination of central serous chorioretinopathy with precipitates. Retina. 2008; 28: 864–869. [DOI] [PubMed] [Google Scholar]
- 16. Kim JE,, Chung M. Adaptive optics for retinal imaging: current status. Retina. 2013; 33: 1483–1486. [DOI] [PubMed] [Google Scholar]
- 17. Liang J,, Williams DR. Aberrations and retinal image quality of the normal human eye. J Opt Soc Am A. 1997; 14: 2873–2883. [DOI] [PubMed] [Google Scholar]
- 18. Scoles D,, Sulai YN,, Langlo CS,, et al. In vivo imaging of human cone photoreceptor inner segments. Invest Ophthalmol Vis Sci. 2014; 55: 4244–4251. [DOI] [PMC free article] [PubMed] [Google Scholar]
- 19. Tanna H,, Dubis AM,, Ayub N,, et al. Retinal imaging using commercial broadband optical coherence tomography. Br J Ophthalmol. 2010; 94: 372–376. [DOI] [PMC free article] [PubMed] [Google Scholar]
- 20. Scoles D,, Flatter JA,, Cooper RF,, et al. Assessing photoreceptor structure associated with elipsoid zone disruptions visualized with optical coherence tomography. Retina. 2016; 36: 91–103. [DOI] [PMC free article] [PubMed] [Google Scholar]
- 21. Flatter JA,, Cooper RF,, Dubow MJ,, et al. Outer retinal structure after closed-globe blunt ocular trauma. Retina. 2014; 34: 2133–2146. [DOI] [PMC free article] [PubMed] [Google Scholar]
- 22. Dubra A,, Sulai Y,, Norris JL,, et al. Noninvasive imaging of the human rod photoreceptor mosaic using a confocal adaptive optics scanning ophthalmoscope. Biomed Opt Express. 2011; 2: 1864–1876. [DOI] [PMC free article] [PubMed] [Google Scholar]
- 23. Dubra A,, Harvey Z. Registration of 2D images from fast scanning ophthalmic instruments. : Fischer B,, Dawant B,, Lorenz C, Biomedical Image Registration SE - 6. Vol 6204. Lecture Notes in Computer Science Berlin: Springer; 2010: 60–71. [Google Scholar]
- 24. Ooto S,, Hangai M,, Sakamoto A,, et al. High-resolution imaging of resolved central serous chorioretinopathy using adaptive optics scanning laser ophthalmoscopy. Ophthalmology. 2010; 117: 1800–1809. e2. [DOI] [PubMed] [Google Scholar]
- 25. Stiles WS,, Crawford BH. The luminous efficiency of rays entering the eye pupil at different points. Proc R Soc B Biol Sci. 1933; 112: 428–450. [Google Scholar]
- 26. Liu Z,, Kocaoglu OP,, Turner TL,, Miller DT. Modal content of living human cone photoreceptors. Biomed Opt Express. 2015; 6: 3378–3404. [DOI] [PMC free article] [PubMed] [Google Scholar]
- 27. Rativa D,, Vohnsen B. Analysis of individual cone-photoreceptor directionality using scanning laser ophthalmoscopy. Biomed Opt Express. 2011; 2: 1423–1431. [DOI] [PMC free article] [PubMed] [Google Scholar]
- 28. Roorda A,, Williams DR. Optical fiber properties of individual human cones. J Vis. 2002; 2: 404–412. [DOI] [PubMed] [Google Scholar]
- 29. Matsumoto H,, Kishi S,, Sato T,, Mukai R. Fundus autofluorescence of elongated photoreceptor outer segments in central serous chorioretinopathy. Am J Ophthalmol. 2011; 151: 617–623.e1. [DOI] [PubMed] [Google Scholar]
- 30. Maruko I,, Iida T,, Ojima A,, Sekiryu T. Subretinal dot-like precipitates and yellow material in central serous chorioretinopathy. Retina. 2011; 31: 759–765. [DOI] [PubMed] [Google Scholar]
- 31. Caicedo A,, Espinosa-Heidmann DG,, Piña Y,, Hernandez EP,, Cousins SW. Blood-derived macrophages infiltrate the retina and activate Muller glial cells under experimental choroidal neovascularization. Exp Eye Res. 2005; 81: 38–47. [DOI] [PubMed] [Google Scholar]
- 32. Davies MH,, Eubanks JP,, Powers MR. Microglia and macrophages are increased in response to ischemia-induced retinopathy in the mouse retina. Mol Vis. 2006; 12: 467–477. [PubMed] [Google Scholar]
- 33. Marchetti V,, Yanes O,, Aguilar E,, et al. Differential macrophage polarization promotes tissue remodeling and repair in a model of ischemic retinopathy. Sci Rep. 2011; 1: 1–12. [DOI] [PMC free article] [PubMed] [Google Scholar]
- 34. Shen J,, Xie B,, Dong A,, Swaim M,, Hackett SF,, Campochiaro PA. In vivo immunostaining demonstrates macrophages associate with growing and regressing vessels. Invest Ophthalmol Vis Sci. 2007; 48: 4335–4341. [DOI] [PubMed] [Google Scholar]
- 35. Zaharova E,, Sherman J. The use of SD-OCT in the differential diagnosis of dots, spots and other white retinal lesions. Eye Brain. 2011; 3: 69–80. [DOI] [PMC free article] [PubMed] [Google Scholar]
- 36. Lewis GP,, Sethi CS,, Carter KM,, Charteris DG,, Fisher SK. Microglial cell activation following retinal detachment: a comparison between species. Mol Vis. 2005; 11: 491–500. [PubMed] [Google Scholar]


