

Abstract
Cadmium (Cd) is a ubiquitous environmental contaminant implicated as a developmental toxicant, yet the underlying mechanisms that confer this toxicity are unknown. Mother-infant pairs from a Rhode Island birth cohort were investigated for the potential effects of maternal Cd exposure on fetal growth, and the possible role of the PCDHAC1 gene on this association. Mothers with higher toenail Cd concentrations were at increased odds of giving birth to an infant that was small for gestational age or with a decreased head circumference. These associations were strongest amongst those with low levels of DNA methylation in the promoter region of placental PCDHAC1. Further, we found placental PCDHAC1 expression to be inversely associated with maternal Cd, and PCDHAC1 expression positively associated with fetal growth. Our findings suggest that maternal Cd affects fetal growth even at very low concentrations, and some of these effects may be due to the differential expression of PCDHAC1.
Keywords: maternal cadmium, fetal growth, small for gestational age, placenta, methylation, expression, PCDH, PCDHAC1
1. Introduction
Cadmium (Cd) is a ubiquitous environmental pollutant and well recognized public health hazard [1]. Cigarette smoking and certain occupations can result in high Cd exposure [2], though most people are exposed chronically to low levels of Cd via diet, primarily from cereal grains, vegetables, potatoes, and products made from these foods [1,3]. Cd has been long established as a toxicant to the kidney[4] and extremely high Cd intake was the cause of Itai-itai disease, a severe condition characterized by bone and renal injuries [5]. Currently Cd has a dietary intake recommendation of no more than 25 μg/kg body weight per month (corresponding to 5.8 μg/kg body weight per week), which protects against these extreme health outcomes; though some recommend that the weekly intake be reduced further to 2.5 μg/kg [3]. It is also classified as a group I human carcinogen by the International Agency for Research on Cancer [6] and more recently has been implicated as a developmental toxicant and possible teratogen [2,7].
Animal studies have shown that Cd exposure during pregnancy decreases neonatal birthweight [8], decreases trophoblast proliferation in the placenta [9], and induces pre-eclamptic conditions in the placenta [10]. These models have suggested that some of the developmentally toxic effects of cadmium may be related to increased glucocorticoid concentrations in placentae and plasma [8], repression of placental lactogens [9], oxidative damage to placental tissue [10], or inhibition of essential metals transfer from mother to fetus [11,12]. Multiple epidemiologic studies have also related maternal Cd exposures to restricted fetal development. To date, human maternal Cd has been associated with infants born small for gestational age (SGA) [13] or a lower birth weight [14–16], decreased head circumference [14,17], and overall growth in the first 3 years of life [17]. There are also indications that maternal Cd, in combination with other toxic metals, may result in mental [18] and possibly psychomotor impairment [19]. Although evidence of Cd as a developmental toxicant is mounting, the mechanisms through which it may exert these effect are still being uncovered. Thus, we hypothesized that Cd exposure may be working through the alteration of placental function to impact fetal growth.
Recent work has shown that low level Cd exposures induce or repress the expression of a wide array of genes [20,21], while others have suggested that Cd affects DNA methylation (DNA-M) [22–24], an epigenetic mechanism that regulates gene transcription, at the global and gene-specific levels [25]. Human, animal, and in vitro studies have illustrated that Cd may affect the functions of multiple epigenetic mechanisms [25]. Also, Cd may be responsible for the mis-expression of multiple cellular adhesion molecules (such as cadherins and catenins), whose activities are integral to normal embryo implantation as well as in post-implantation cellular signaling, remodeling and migration [2]. Cadherins are key regulators of trophoblast behavior and organization; altered expression and/or function of some cadherins has been suggested to play a role in fetal growth restriction and pre-eclampsia [26]. An in vitro study of human bronchial epithelial cells found that Cd altered the expression of many cellular adhesion and junction molecules, likely disrupting tight junction integrity [27]. Similarly, murine studies have shown Cd to affect the abundance of, and interactions between cadherin molecules [28,29]. Protocadherins (PCDH) comprise the largest subfamily of the cadherin cell-adhesion molecules, some of which are encoded very close in genomic proximity forming PCDH gene-clusters [30]. These PCDH clusters can produce multiple unique transcripts that could impart various functionalities and distinct cellular identities [31]. The PCDH genes also appear to be susceptible to epigenetic modifications in response to toxic heavy metal exposures, including Arsenic (As) and Cd [32], and the transcription of PCDH-α isoforms are regulated by promoter and 1st exon DNA-M [31,33]. The PCDH-α genes are predominantly expressed in the central nervous system (CNS) and likely play important roles in the innervation of serotonergic projections [34].
Given the importance of cellular-adhesion molecules in fetal development, as well as the apparent responsiveness of PCDH-genes to heavy metal exposures, altered PCDH-α gene activities could play a role in maternal Cd-restricted fetal development. We hypothesized that maternal Cd could influence the expression of placental PCDHAC1, which in turn may be associated with restricted fetal growth. Therefore, this study aimed to characterize the relationship between maternal toenail Cd concentrations and placental PCDHAC1 expression, and to investigate whether the expression of PCDHAC1 was related to various markers of fetal development.
2. Methods
2.1 The Rhode Island Child Health Study
The Rhode Island Child Health Study (RICHS) is a birth cohort that included non-pathologic term pregnancies at born at ≥37 weeks gestation at the Women and Infants’ Hospital in Providence, RI, USA with enrollment for this analysis from September 2010 through February 2013. Infants classified as large for gestational age (LGA) (≥ 90th BW percentile) and SGA (≤ 10th BW percentile) were oversampled for inclusion and adequate for gestational age (AGA) (between the 10th and 90th BW percentiles) infants that matched on sex, gestational age (±3 days), and maternal age (±2 years) were enrolled coincidentally. Mothers younger than 18 years of age, with life threatening conditions, or infants with congenital/chromosomal abnormalities were excluded. All protocols were approved by the institutional review boards at the Women and Infants Hospital and Dartmouth College and all participants provided written informed consent. An interviewer administered questionnaire was used to collect self-reported sociodemographic, lifestyle, and medical history data, and a structured medical records review was employed to collect anthropometric and clinical data. Birthweight (BW) percentiles were calculated while accounting for gestational age, infant sex, birthweight, head circumference, and length [35]. The samples used in this study included those mother-infant pairs for which maternal and newborn toenails had been collected for metals analyses. From this metals-sample (n=242) a sub-sample of those with the highest and lowest maternal Cd concentrations were selected for gene-expression assays (n=95).
2.2 Cadmium Measurements
Toenail clippings from all toes from both mothers and newborns were requested following discharge, and mailed back to the study office. Average time from birth to collection was 2.8 months and ranged from 0.3 to 7.1 months. From these samples, μg of Cd per gram of toenail were measured at the Dartmouth Trace Element Analysis Core following procedures, involving HNO3:HCl acid digestion of the nails followed by ICP-MS (Agilent 7700×, Santa Clara, CA) analysis of the resulting digests. The ICP-MS method and quality control (QC) followed that outlined in EPA 6020A and QC involved initial and continuing calibration verification and blanks, digestion blanks, fortified blanks and hair powder certified reference material (NIES # 13 and GBW07601, certified at 0.23 and 0.11 μg/g Cd respectively), analysis duplicates and spikes. Average Cd percent recovery for the reference materials across the digestion batches was 102 ± 11 % (n= 22). Detection limits were determined for each digestion batch by either the instrument detection limit or the method detection limit (average of digestion blanks + 3σ), whichever was the higher value. Samples that were below the limit of detection (LOD) were assigned a value equal to half the lowest LOD observed for that batch.
2.3 Placenta Sampling
Full-thickness sections of placenta were taken from the fetal side of the placenta, 2 cm from the umbilical cord insertion site and free of maternal decidua, from each of the four quadrants around the cord insertion within two hours of birth. These samples were immediately placed in RNAlater™ (Applied Biosystems, Inc., AM7020). Following ≥72 hours at 4°C, samples were blotted dry, snap-frozen in liquid nitrogen. The four biopsied samples were then pulverized to homogenize across the samples then stored at −80°C until analysis.
2.4 Nanostring Gene Expression Assay
The nCounter Panel-Plus custom gene expression panel (NanoString Technologies, Seattle, WA) was used to quantitate gene expression and was performed according to manufacturer’s instructions. Total RNA was isolated from placenta with 500 nanograms of RNA used per sample in this assay. Briefly, two sets of oligonucleotide probes were designed to target a specific gene sequence, along with a reporter probe and a capture probe this platform multiplexes the detection of 24 genes (3 of which were placenta housekeeping genes) per sample in a 96-sample format; only one of these 21 candidate genes (PCDHAC1) was the involved in this study. A table showing variation in relative expression by maternal Cd for all 21 genes is included in the supplemental materials (Supplemental Table 1).
Following an overnight hybridization (67°C), samples were vertically pooled, and placed into a cartridge for further processing. The cartridge was placed on the automated nCounter sample prep station where excess reporter and capture probes were washed away and probe/target complexes were aligned and immobilized. The cartridge was then transferred to the nCounter Digital Analyzer for data collection. This yielded raw transcript counts for the candidate genes, housekeeping genes, and QC probes. The lane-specific mean of the negative control probes was utilized to estimate the background signal (Supplemental Table 2); only one sample was assigned a value for PCDHAC1 expression that was indistinguishable from background.
One sample was a technical replicate, used to evaluate the reliability of the counts (Supplemental Figure 1), which was excluded from subsequent analyses and another sample was excluded due to extremely low transcript counts across all genes, yielding 94 samples for analyses. We then applied positive-control normalization to each lane based on the sum of its pooled positives relative to the sum of the pooled positives in all the other lanes. Then the data were normalized on the geometric mean of the three housekeeping genes (SDHA, TBP and YWHAZ), which have been shown to be stable housekeeping genes in placental tissue [36]. These housekeeping also genes exhibited no differential expression by maternal Cd concentrations in our sample (T-test p-values > 0.05; Supplemental Table 3).
2.5 Placenta Illumina 450 DNA Methylation Array
Genome-wide DNA-M was measured at the University of Minnesota Genomics Center via Illumina Infinium Human Methylation450K BeadArray (Illumina) and the full QA/QC and analytical procedures described elsewhere [37]. Briefly, samples were randomized across multiple batches, stratified by birthweight group and gender. Arrays were processed and normalized using standard methods; poorly-detected probes, probes measuring DNA-M at X- and Y-linked loci, and SNP-associated loci were excluded [38], and data were standardized across batches to remove technical variations [39]. DNA-M data were analyzed as β-values, which can be interpreted as the proportion of methylated alleles for that individual CpG site. DNA-M array data for the RICHS placenta are available via the NCBI Gene Expression Omnibus (GEO) accession number GSE75248; we provide a supplemental file herein which includes log-Cd, log-PCDHAC1, and a variable for cross-linking these data (Supplemental Data).
2.5 Statistical Analyses
Due to the skewed distributions of both Cd and PCDHAC1 expression, both were log-transformed for all continuous analyses. Also, because the study design for the sub-sample selected mother-infant pairs with the highest and lowest measures of toenail Cd concentrations, we ran all regression models with continuous measures of log-Cd and with dichotomous Cd (High vs. Low based on median split) for analyses of the sub-sample. We compared the distributions of all independent and dependent variables, as well as potential confounders between the sub-sample (n=94) and the metals-sample (n=242) using Student’s t-test for continuous measures and Chi-squared tests for categorical measures. Fisher’s Exact tests were used to compare categorical measures with low frequencies. Kruskal-Wallis rank sum tests were used to compare continuous measures across categorical groups for data that did not approximate a normal distribution. For all exposure-outcome regression analyses, models were fit using robust linear models for continuous outcomes and robust generalized linear models for categorical outcomes via the robustbase package in R [40], to limit the effects of outliers. Structural equation modeling was used to evaluate the direct, indirect and total effects via mediation analyses using the lavaan package in R [41]. For all analyses, determinations of statistical significance were set at α level of 0.05. In our adjusted models we included maternal BMI and maternal age, which have been shown to be associated with placental Cd concentrations [42], as well as infant sex and gestational age which are strong determinants of birth weight and size.
3. Results
3.1 Comparing the sub-sample (n=94) to the metals-sample (n=242)
The expression sub-sample (n=94) drawn for this study was representative of the metals-sample (n=242) in terms of maternal smoking during pregnancy, maternal BMI, maternal age, size for gestational age, infant sex, gestational time, and infant birthweight percentiles (Table 1). In the metals-sample (n=242), Cd concentrations ranged from 0.00062 μg/g to 0.0846 μg/g, with a right skewed distribution. Within the sub-sample, Cd concentrations among mothers with ‘low’ Cd (n=47) ranged from 0.00062 μg/g to 0.0029 μg/g, with a median of 0.00104 μg/g. Those with ‘high’ Cd (n=47) had concentrations ranging from 0.0088 μg/g to 0.0846 μg/g, with a median of 0.0159 μg/g. Maternal toenail Cd concentrations were modestly correlated with offspring toenail Cd concentrations (Kendall’s tau = 0.30, p-value < 0.001).
Table 1.
Comparison of this study’s sub-sample to the metals-sample across important maternal and infant characteristics.
| Maternal and Infant Characteristics | Expression Sub-Sample (n=94) |
Metals-Sample (n=242) |
Cross-Sample Comparisons | ||
|---|---|---|---|---|---|
|
| |||||
| N | % | N | % | χ2 p-value | |
| Mother Didn’t Smoke | 87 | 95.60 | 218 | 92.37 | 0.46 |
| Smoked During Pregnancy* | 4 | 4.40 | 18 | 7.63 | |
|
| |||||
| Female infant | 53 | 56.38 | 119 | 49.17 | 0.29 |
| Male infant | 41 | 43.62 | 123 | 50.83 | |
|
| |||||
| SGA | 18 | 19.15 | 39 | 16.12 | 0.56 |
| AGA | 48 | 51.06 | 139 | 57.44 | |
| LGA | 28 | 29.79 | 64 | 26.45 | |
|
| |||||
| Mean | Std. Dev. | Mean | Std. Dev. | T-test p-value | |
|
| |||||
| BW percentiles | 55.3 | 35.07 | 57.61 | 33.02 | 0.58 |
| BW (g) | 3523.55 | 683.67 | 3558.95 | 648.41 | 0.67 |
| Maternal BMI | 26.48 | 6.72 | 26.72 | 6.52 | 0.77 |
| Maternal Age | 31.68 | 4.07 | 31.70 | 4.40 | 0.97 |
| Gestational time (weeks) | 39.02 | 0.84 | 39.04 | 0.94 | 0.88 |
| Maternal Cadmium (μg/g)** | 0.01 | 0.02 | 0.01 | 0.01 | 0.86 |
BW = birthweight; BMI = body mass index; SGA = small for gestational age; AGA = adequate for gestational age; LGA = large for gestational age.
Fisher’s Exact Test used to compare across samples due to low frequencies.
Wilcox Rank-Sum Test used to compare across samples due to skewed distribution.
3.2 Associations between maternal cadmium and fetal growth
All results herein with p-values < 0.05 were determined to be statistically significant. We tested whether maternal Cd was associated with indicators of fetal growth in the metals-sample (n=242) using robust linear regressions. Newborns that were smaller in length (p = 0.31), had smaller head circumference (p = 0.08), lower BW (p = 0.13), and lower BW percentiles (p = 0.28) tended to have mothers with higher log-Cd, though these associations were not statistically significant. However, maternal log-Cd was significantly associated with size for gestational age (p-value = 0.002), with higher log-Cd among SGA newborns than AGA (p-value = 0.001) or LGA (p-value = 0.003) newborns. In contrast, there was no difference in log-Cd between AGA and LGA (p-value = 0.96) newborns (Figure 1), so we grouped AGA and LGA together and used logistic regression to estimate the odds of SGA while adjusting for confounders. We found that increasing maternal log-Cd significantly increased the odds of SGA (OR = 2.44, 95% CI = 1.53 – 3.89), adjusted for infant sex, maternal BMI, maternal age, and gestational age. Of note, in this multivariable model, maternal log-Cd and maternal age (p-value = 0.037) were the only significant predictors of SGA.
Figure 1.
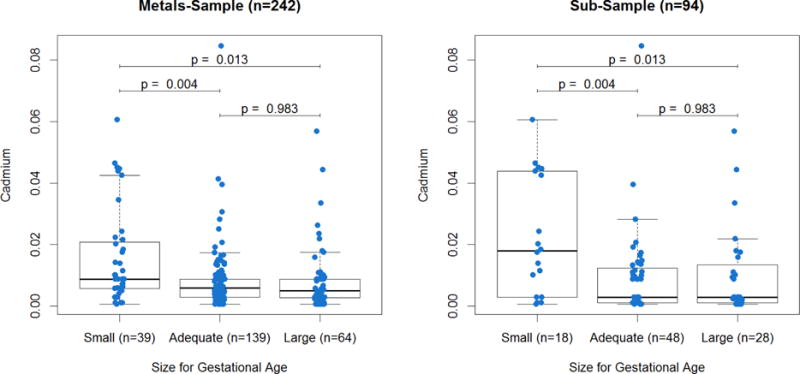
Distribution of maternal cadmium exposure by infant size for gestational age.
Cadmium (μg/g) distribution by size for gestational age (Small = ≤ 10th BW percentile, Adequate = between the 10th and 90th BW percentiles, Large: ≥ 90th BW percentile); T-tests were used for pairwise comparisons across groups.
We then tested whether we could reproduce the associations with SGA in the sub-sample (n=94) for which we had obtained PCDHAC1 expression. The associations between maternal Cd and SGA were robust (Figure 1), with increasing maternal log-Cd associated with increased odds of SGA (OR = 2.12, 95% CI = 1.24 – 3.64), adjusted for infant sex, maternal BMI, maternal age, and gestational age.
3.3 PCDHAC1 Expression analyses
PCDHAC1 expression was below the detection limit for one sample, ranged from 5.8 to 114.1 transcript counts, exhibited a right-skewed distribution with a median of 15.3, and appeared to be more highly expressed among placenta of mothers with lower Cd exposure (Supplemental Figure 2). We found that log-PCDHAC1 expression was inversely associated with log-Cd (βlog-Cd = −0.064; p-values = 0.0087) and positively associated with maternal BMI (βMatBMI = 0.015; p-values = 0.0032) in a multivariable linear regression model including both terms. PCDHAC1 expression was not associated with any of the other covariates (infant sex, gestational age, or maternal age) in this study.
We then investigated whether PCDHAC1 expression was associated with indicators of fetal development: infant head circumference, length, BW, BW percentiles, and odds of SGA. Log-PCDHAC1 expression was not a significant predictor of SGA (p-value=0.164); however, when grouped into tertiles, those within the highest tertile of PCDHAC1 expression had lower odds of SGA, compared to the lowest tertile (OR = 0.13, 95% CI = 0.018 – 0.89), adjusted for infant sex, maternal BMI, maternal age, and gestational time. Log-PCDHAC1 and tertiles of PCDHAC1 had significant linear associations with increased BW (βlog-PCDHAC1 = 250.01, p-value = 0.049; βHvL = 358.58, p-value = 0.038) and BW percentiles (βlog-PCDHAC1 = 15.70, p-value = 0.026; βHvL = 22.23, p-value = 0.026), while adjusting for infant sex, gestational time, maternal age, and maternal BMI. We also found that log-PCDHAC1 and tertiles of PCDHAC1 were associated with increased head circumference (βlog-PCDHAC1 = 0.623; p-values = 0.016; βMvL = 0.540, p-value = 0.0084; βHvL = 0.682, p-value = 0.0017), while adjusting for BW, infant sex, gestational time, maternal age, and maternal BMI. Neither log-PCDHAC1 nor tertiles of PCDHAC1 were associated with infant length.
3.4 Summarizing DNA-M across PCDHAC1
We had hypothesized that the association between Cd and PCDHAC1 expression may depend on DNA-M levels within PCDHAC1 regulatory regions, for which data were available at 37 CpG sites. We calculated the average DNA-M across all CpGs within 1500 bps of the transcription start site (TSS1500; 3 sites), 200 bps of the transcription start site (TSS200; 6 sites), the 1st exon (5 sites), the gene-body (22 sites), and the 3′-untranslated region (3′-UTR; 1 site). We then evaluated the representativeness of these regional averages with a pairwise correlation matrix of all 37 sites, as well as the correlations between individual sites and the average of the regulatory regions in which they reside (Figure 2). The CpGs within the TSS200 were highly correlated with each other, while those sites within the TSS1500 and TSS200 were highly correlated their regional averages: correlation coefficients ranged from 0.69 to 0.79 and 0.81 to 0.91, respectively, all with p-values < 0.001. Whereas CpGs within the 1st exon and gene body did not have strong correlation patterns and were not as well represented by their regional averages.
Figure 2.
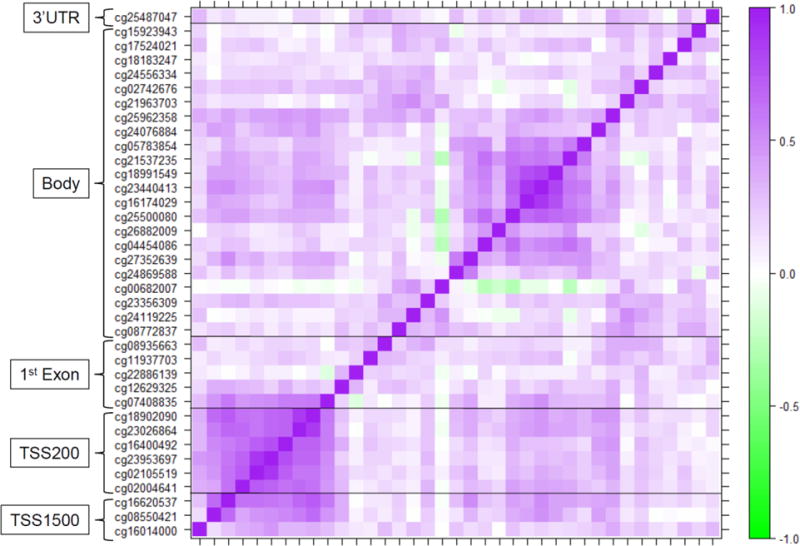
Correlation matrix of DNA-M levels for the PCDHAC1 gene.
Pairwise Pearson correlations between DNA-M levels at CpG sites within the regulatory regions of the PCDHAC1 gene; dark purple and dark green represent strong positive and negative correlations, whereas white represents no correlation.
3.5 DNA-M dependent associations
To test whether the effect of log-Cd on log-PCDHAC1 expression was dependent on regional DNA-M, we produced five linear regression models while including an interaction term between log-Cd and DNA-M at the TSS1500, the TSS200, the 1st exon, the gene body, and the 3′UTR, and adjusting for BMI (Table 2). The association with log-Cd appeared to be dependent on TSS1500 DNA-M (interaction p-value = 0.053) and TSS200 DNA-M (interaction p-value = 0.149). Thus we ran regression models, stratified by those with ‘high’ and ‘low’ DNA-M (median split), within the TSS1500 and the TSS200. In the stratified models, log-Cd was inversely associated with log-PCDHAC1 expression, but only among those with lower DNA-M within the TSS1500 and TSS200 (Table 3). We observed positive associations between maternal BMI and PCDHAC1 expression, but this association was independent of DNA-M strata.
Table 2.
Interactions between DNA-M and log-Cd on log-PCDHAC1 expression.
| log-Cd | DNA-M | Interaction Term | ||||
|---|---|---|---|---|---|---|
|
| ||||||
| PCDHAC1 Regional DNA-M | β1 | p-value | β2 | p-value | β1*2 | p-value |
| TSS1500 | −0.16 | 0.003 | 2.99 | 0.043 | 0.49 | 0.053 |
| TSS200 | −0.20 | 0.041 | 4.63 | 0.085 | 0.70 | 0.149 |
| 1st Exon | −0.33 | 0.240 | 2.56 | 0.259 | 0.50 | 0.341 |
| Gene Body | −0.30 | 0.140 | 2.91 | 0.268 | 0.59 | 0.246 |
| 3′UTR | −0.06 | 0.300 | 0.87 | 0.550 | 0.0034 | 0.990 |
DNA-M = DNA methylation; TSS1500 = within 1500 base pairs of the transcription start site; TSS200 = within 200 base pairs of the transcription start site, UTR = untranslated region.
Table 3.
Linear associations between Cd and log-PCDHAC1 expression, stratified by High and Low DNA-M at the TSS200 and the TSS1500; β1 may be interpreted as the change in log-PCDHAC1 expression associated with a one unit increase in exposure, log(Cd μg/g) or maternal BMI (kg/m2).
| Predictors |
PCDHAC1 DNA-M Strata |
TSS200 | TSS1500 | ||
|---|---|---|---|---|---|
|
| |||||
| β1 | p-value | β1 | p-value | ||
| Crude Models | |||||
|
| |||||
| log-Cd | Low DNA-M | −0.0901 | 0.0028 | −0.1029 | 0.0042 |
| High DNA-M | −0.0283 | 0.5245 | −0.0243 | 0.5133 | |
|
| |||||
| Multivariable Model | |||||
|
| |||||
| log-Cd | Low DNA-M | −0.0980 | 0.0005 | −0.1060 | 0.0026 |
| High DNA-M | −0.0188 | 0.6507 | −0.0248 | 0.4599 | |
|
| |||||
| Maternal BMI | Low DNA-M | 0.0136 | 0.0146 | 0.0139 | 0.0231 |
| High DNA-M | 0.0168 | 0.0399 | 0.0155 | 0.0633 | |
TSS200 = within 200 base pairs of the transcription start site; TSS1500 = within 1500 base pairs of the transcription start site; Cd = Cadmium.
Then we tested whether the associations of maternal Cd with odds of SGA and decreased head circumference were dependent on PCDHAC1 DNA-M strata. We found that higher log-Cd was significantly associated with increased odds of SGA and decreased head circumference among the low DNA-M strata, but not in the high DNA-M strata (Table 4). Interestingly, the associations of maternal Cd with SGA became stronger after adjustment for potential confounders, and exemplified the potential dependence on DNA-M. Among those with lower DNA-M within the TSS200 or TSS1500, a one unit increase in log-Cd was associated with 5.64 or 3.00 times increased odds of SGA, respectively. In the high DNA-M strata these odds ratios were much smaller, 1.28 and 1.87 for the TSS200 and TSS1500 respectively, and not statistically significant. Similarly, among those with lower DNA-M within the TSS200 or TSS1500, a one unit increase in log-Cd was associated with a 0.143cm or 0.191cm decrease in head circumference. These associations were substantially attenuated, decreases of 0.052cm or 0.038cm, among those with higher DNA-M at TSS200 and TSS1500, and were not statistically significant.
Table 4.
Logistic and linear regressions for the effects of log-Cd on SGA and head circumference, respectively, stratified by high and low DNA-M levels within the promoter region of PCDHAC1; β1 for linear models may be interpreted as the change in head circumference associated with a one unit increase in exposure, log(Cd μg/g); exponentiation of β1 for logistic models can be interpreted as the odds of SGA associated with a one unit increase in exposure, log(Cd μg/g).
| Predictor | Outcome |
PCDHAC1 DNA-M strata |
TSS200 | TSS1500 | ||
|---|---|---|---|---|---|---|
|
| ||||||
| β1 | p-value | β1 | p-value | |||
| Crude Models | ||||||
|
| ||||||
| log-Cd | SGA | Low DNA-M | 0.756 | 0.022 | 0.695 | 0.034 |
| High DNA-M | 0.584 | 0.118 | 0.807 | 0.068 | ||
|
| ||||||
| Head Circumference | Low DNA-M | −0.346 | 0.059 | −0.464 | 0.031 | |
| High DNA-M | −0.070 | 0.686 | −0.030 | 0.848 | ||
|
| ||||||
| Adjusted Models | ||||||
|
| ||||||
| log-Cd | SGA* | Low DNA-M | 1.732 | 0.017 | 1.110 | 0.024 |
| High DNA-M | 0.253 | 0.501 | 0.626 | 0.107 | ||
|
| ||||||
| Head Circumference** | Low DNA-M | −0.143 | 0.026 | −0.191 | 0.003 | |
| High DNA-M | 0.052 | 0.664 | 0.038 | 0.772 | ||
TSS200 = within 200 base pairs of the transcription start site; TSS1500 = within 200 base pairs of the transcription start site; Cd = Cadmium; SGA = Small for Gestational Age.
Adjusted for infant sex, gestational time (weeks), maternal BMI and maternal age.
Adjusted for birth weight, infant sex, gestational time (weeks), maternal BMI and maternal age.
3.6 Dichotomous Cd as the Exposure Variable
Because the sub-sample was selected based on mothers with the highest or lowest toenail Cd concentrations, we investigated whether the above associations were reproducible using dichotomous maternal Cd (median split) as the primary exposure in place of continuous maternal log-Cd. Mothers with the highest Cd levels were more likely to give birth to SGA offspring than mothers with the lowest Cd levels (OR = 4.70, 95% CI = 1.23 – 18.05). Similarly, high maternal Cd was associated with lower expression of PCDHAC1 (β = −0.16; p-values = 0.036). We were also able to reproduce the PCDHAC1 DNA-M dependent effects for almost all adjusted regression models (Supplemental Materials Table 4), only the association between dichotomized Cd and head circumference was no longer statistically significant within the low DNA-M strata of TSS200 (β1 = −0.353, p-value = 0.093).
3.7 Structural Equation Modeling (SEM)
If these associations represent causal relationships, which we cannot verify given the observational nature of these data, we wanted to explore whether some of the effect of maternal Cd on increased odds of SGA was mediated through the repression of PCDHAC1 expression using SEM. For these models we used dichotomized Cd (High vs. Low) as the primary exposure, lowest vs mid-and-highest PCDHAC1 tertiles as the mediator, and SGA vs. non-SGA as the outcome (Figure 3). The regression for the effects of Cd on PCDAHC1 was adjusted for maternal BMI, while the regressions for effects on SGA were also adjusted for maternal age, gestational time and infant sex. Only 10% of the effect of Cd on SGA appeared to work through the repression of PCDHAC1 as a mediator, and this indirect effect was not statistically significant. Whereas the total effect and direct effect of Cd on SGA remained robust and statistically significant (Total Effect p-value = 0.020; Direct Effect p-value = 0.032) in the SEM. We did attempt to fit the above SEMs stratified by DNA-M in the promoter of PCDHAC1; although we again observed stronger total effects of maternal Cd on SGA among those with lower DNA-M, none of the stratified direct and indirect effects were statistically significant (all p-values > 0.05).
Figure 3.
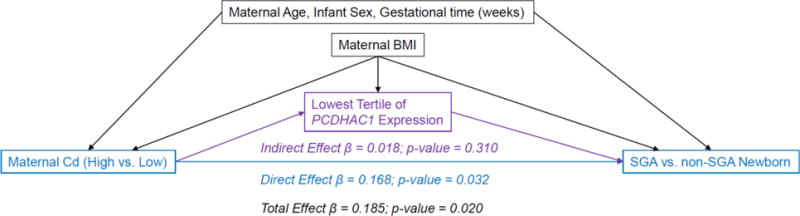
Assessment of whether expression of PCDHAC1 mediated the effects of maternal cadmium on infant size for gestational age.
Structural equation model assessing the potential mediation of maternal Cd on size for gestational age, through low placental PCDHAC1 expression, adjusted for confounders.
4. Discussion
This study adds to the increasing body of evidence that maternal Cd exposures can influence fetal development and suggests a possible role for PCDH genes in fetal growth. Currently, PCDH genes are primarily known for their functions in neurons and have been implicated in neurological disorders [43]. Five SNPs within the PCDH-α cluster have been associated with autism [44] and microdeletions at chromosomal region 5q31.3, where the PCDH gene clusters are located, cause developmental delay and other cerebral abnormalities [45]. Because PCDH-α gene activity has not been well-characterized in placental tissue, we explored two publicly available placenta gene-expression datasets from the Gene Expression Omnibus (GEO): GSE9984, which evaluated placental gene-expression at different time points throughout pregnancy [46] and GSE7434, which compared placental gene-expression between mothers that did and did not smoke [47]. Both of publically available datasets contain transformed counts produced via the Affymatrix Human Genome U133 Plus 2.0 Array. Many of the PCDH-α genes were expressed by the placenta at relatively consistent levels throughout pregnancy and at birth (Supplemental Table 5). Specifically, PCDHAC1 exhibited consistently mid-level expression in trimester 1, trimester 2, and at term, where mid-level was defined as being within the middle tertile of average expression across the entire array. Furthermore, in our sample the placental expression of PCDHAC1 did not differ by gestational age (Kruskall-Wallis rank sum p-value = 0.36) at term. Placental expression of the PCDH-α genes also did not differ between mothers who smoked and mothers that did not smoke (Supplemental Table 6). We add further evidence that PCDHAC1 is expressed by placenta collected at term, and that it tends to be expressed in relatively low levels. Due to differences in placental sampling and expression assay technologies, we could not directly compare and determine whether expression levels in our samples were similar to those in the publicly available datasets.
We are the first to suggest that maternal Cd may be inversely associated with PCDHAC1 expression in the placenta, and that DNA-M patterns within PCDHAC1 may impart an epigenetic susceptibility for the associations between Cd and fetal development. We observed that those with lower DNA-M in the promoter region of PCDHAC1 may be more susceptible to Cd-associated repression of PCDHAC1, increased odds of SGA, and decreased head circumference. We are also the first to suggest that placental expression of PCDHAC1 may be positively associated with higher birth weight percentiles and larger newborn head circumferences. These findings were robust after adjustment for the potential confounding effects of infant sex, gestational age, maternal age, maternal BMI, and other measures of fetal growth when appropriate.
Despite being the first to associate maternal Cd concentrations in toenail to SGA and smaller head circumference, our findings are consistent with other research showing restricted fetal growth with increasing levels of Cd in maternal urine [14], maternal blood [13,16,17], and placental tissue [15]. Toenails provide a unique source for biomonitoring, as they are simple and non-invasive to collect, and may be more representative of long-term chronic exposures to trace elements compared to other tissues [48]. In our sample, maternal and child toenail Cd concentrations were modestly but significantly correlated with each other. We considered the possibility that maternal toenail Cd may merely have acted as a marker of direct fetal exposure to Cd, and that the direct fetal exposure may instead be causing the observed effects on restricted growth. To address this, we ran a sensitivity analysis in which we re-modeled our previous regressions for odds of SGA, BW percentiles, and head circumference but used newborn toenail log-Cd levels instead of maternal toenail log-Cd levels, as the primary exposure. None of these outcomes were significantly associated with newborn Cd in crude models or after adjustment for the same covariates that were used for the maternal-Cd models. Thus, the associations we observed were not driven by fetal toenail Cd, a potential biomarker of fetal exposure to Cd in utero, but were consistently related to maternal exposure.
Other investigators have proposed that the effect of maternal or placental Cd on fetal growth could be due to impaired zinc-transfer to the fetus [49], or through endocrine disruption via the repression of 11β-hydroxysteroid dehydrogenase type 2 gene (HSD11B2) in human trophoblasts [50], which is important for its role in protecting against high levels of maternal glucocorticoids which can inhibit fetal growth [51]. We present another possible mechanism, epigenetic susceptibility within and repression of PCDHAC1, through which maternal Cd may alter placental functions and restrict fetal growth. Due to the observational nature of this study, we could not experimentally verify whether Cd does in fact repress PCDHAC1 and whether that repression is dependent on promoter DNA-M patterns. Thus these findings should be validated in an independent cohort or studied further with an experimental design.
These findings should be interpreted within the limitations of the study. The majority of analyses were conducted with a relatively small sample (n=94) in which only those with the highest and lowest maternal Cd concentrations were included. Thus there is a possibility that selection bias could have contributed to our findings. However, we did show that our sub-sample was representative of the metals-sample across all variables used in the analyses of the sub-sample. Also, one of the most interesting findings was that DNA-M patterns in the promoter region of placental PCDHAC1 may confer an epigenetic susceptibility to Cd-related SGA and decreased head circumference. Although we only had PCDHAC1 expression data within our sub-sample, we did have a larger number of mother-infant pairs (n=176) for which placental DNA-M was available. Thus, as a sensitivity analysis, we reproduced the DNA-M dependent effects of log-Cd on head circumference and SGA using these data. In this larger sample, again, we observed stronger and statistically significant effects of Cd on odds of SGA and on head circumference in the low DNA-M strata compared to the high DNA-M strata (Supplemental Table 7). Thus it is unlikely that selection of our sub-sample biased our findings, and PCDHAC1 may indeed play a role in Cd-related effects on fetal growth.
Maternal smoking was considered a possible confounder of our observed associations between maternal-Cd and restricted growth, but due to very low frequency of smokers, we could not include this as an adjustment covariate in our robust regression analyses; only four (4%) and eighteen (8%) mothers smoked cigarettes during pregnancy in the sub-sample and metals-sample, respectively. Thus we re-ran our adjusted models for maternal log-Cd on the odds of SGA, with and without maternal smokers, and found that the parameter estimates and p-values were barely perturbed by excluding smokers. We therefore concluded that our observed effects of Cd on restricted fetal growth were independent of the effects of smoking.
Also, we did not observe statistically significant indirect effects of maternal log-Cd on SGA, mediated through repression of PCDHAC1 using SEM. However, our analyses involved a small sample size, which was likely underpowered to identify a mediated effect, particularly within separate DNA-M strata. The consistent results across the individual regression models combined with the successful sensitivity analyses for the DNA-M dependent effects of Cd restricted fetal growth, suggest that PCDHAC1 may still play some role in Cd-related restricted fetal growth and warrant follow-up in other studies with larger samples. Also, since Cd is known to cause a number of effects on the placenta, including inhibition of trophoblast invasion, decreased hormone production, and altered nutrient metal transport [2], we caution that our results may not represent a direct effect, but a sign of this wider response of placental trophoblasts to Cd exposure. Further studies would be needed, particularly those with controlled timing of exposures and molecular endpoint, to dissect the true causal pathway.
5. Conclusions
Higher levels of maternal Cd exposure are associated with increased odds of giving birth to an infant that is SGA or that has decreased head circumference, and these associations appear to be strongest among those with lower levels of DNA-M in the promoter of placental PCDHAC1. Also, maternal Cd was inversely associated with placental PCDHAC1, which in turn may be associated with birth weight percentiles, odds of SGA, and head circumference of newborns. Further epidemiologic research is necessary to determine whether similar associations can be observed in different populations and experimental studies are necessary to infer causality.
Supplementary Material
Highlights.
Maternal cadmium is associated with restricted fetal growth
Placental PCDHAC1 expression is inversely associated with maternal cadmium
Placental PCDHAC1 expression is positively associated with fetal growth
Associations were strongest for those with lower methylation in the PCDHAC1 promoter
Acknowledgments
This work was supported by the National Institutes of Health [NIH-NIMH R01MH094609, NIH-NIEHS R01ES022223, NIH-NIEHS P42ES0007373, and NIH-NIEHS P01 ES022832] and by the United States Environmental Protection Agency [US EPA grant RD83544201]. Its contents are solely the responsibility of the grantee and do not necessarily represent the official views of the US EPA. Further, the US EPA does not endorse the purchase of any commercial products or services mentioned in the presentation.
Abbreviations
- AGA
Adequate for gestational age
- bps
basepairs
- Cd
Cadmium
- CpG
cytosine-phosphate-guanine
- DNA-M
DNA methylation
- LGA
Large for gestational age
- PCDH
protocadherin
- RICHS
Rhode Island Child Health Study
- SGA
Small for gestational age
Footnotes
Publisher's Disclaimer: This is a PDF file of an unedited manuscript that has been accepted for publication. As a service to our customers we are providing this early version of the manuscript. The manuscript will undergo copyediting, typesetting, and review of the resulting proof before it is published in its final citable form. Please note that during the production process errors may be discovered which could affect the content, and all legal disclaimers that apply to the journal pertain.
Competing Financial Interests:
The authors have no competing financial interests to declare.
References
- 1.Järup L, Åkesson A. Current status of cadmium as an environmental health problem. Toxicol Appl Pharmacol. 2009;238:201–208. doi: 10.1016/j.taap.2009.04.020. [DOI] [PubMed] [Google Scholar]
- 2.Thompson J, Bannigan J. Cadmium: Toxic effects on the reproductive system and the embryo. Reprod Toxicol. 2008;25:304–315. doi: 10.1016/j.reprotox.2008.02.001. [DOI] [PubMed] [Google Scholar]
- 3.EFSA (European Food Safety Authority) Cadmium dietary exposure in the European population. EFSA J. 2012;10 doi: 10.2903/j.efsa.2012.2551. [DOI] [PMC free article] [PubMed] [Google Scholar]
- 4.Johri N, Jacquillet G, Unwin R. Heavy metal poisoning: the effects of cadmium on the kidney. Biometals. 2010;23:783–792. doi: 10.1007/s10534-010-9328-y. [DOI] [PubMed] [Google Scholar]
- 5.Inaba T, Kobayashi E, Suwazono Y, Uetani M, Oishi M, Nakagawa H, et al. Estimation of cumulative cadmium intake causing Itai–itai disease. Toxicol Lett. 2005;159:192–201. doi: 10.1016/j.toxlet.2005.05.011. [DOI] [PubMed] [Google Scholar]
- 6.IARC (International Agency for Research on Cancer) Cadmium and cadmium compounds. IARC Monogr Eval Carcinog Risks to Humans. 2012;100C:121–145. http://monographs.iarc.fr/ENG/Monographs/vol100C/mono100C-8.pdf. [Google Scholar]
- 7.Wang Z, Wang H, Xu ZM, Ji Y, Chen YH, Zhang ZH, et al. Cadmium-induced teratogenicity: Association with ROS-mediated endoplasmic reticulum stress in placenta. Toxicol Appl Pharmacol. 2012;259:236–247. doi: 10.1016/j.taap.2012.01.001. [DOI] [PubMed] [Google Scholar]
- 8.Ronco AM, Urrutia M, Montenegro M, Llanos MN. Cadmium exposure during pregnancy reduces birth weight and increases maternal and foetal glucocorticoids. Toxicol Lett. 2009;188:186–191. doi: 10.1016/j.toxlet.2009.04.008. [DOI] [PubMed] [Google Scholar]
- 9.Lee CK, Lee JT, Yu SJ, Kang SG, Moon CS, Choi YH, et al. Effects of cadmium on the expression of placental lactogens and Pit-1 genes in the rat placental trophoblast cells. Mol Cell Endocrinol. 2009;298:11–18. doi: 10.1016/j.mce.2008.09.028. [DOI] [PubMed] [Google Scholar]
- 10.Zhang X, Xu Z, Lin F, Wang F, Ye D, Huang Y. Increased Oxidative DNA Damage in Placenta Contributes to Cadmium-Induced Preeclamptic Conditions in Rat. Biol Trace Elem Res. 2016;170:119–127. doi: 10.1007/s12011-015-0438-9. [DOI] [PubMed] [Google Scholar]
- 11.Nakamura Y, Ohba K, Ohta H. Participation of metal transporters in cadmium transport from mother rat to fetus. J Toxicol Sci. 2012;37:1035–1044. doi: 10.2131/jts.37.1035. [DOI] [PubMed] [Google Scholar]
- 12.Nakamura Y, Ohba K, Suzuki K, Ohta H. Health effects of low-level cadmium intake and the role of metallothionein on cadmium transport from mother rats to fetus. J Toxicol Sci. 2012;37:149–156. doi: 10.2131/jts.37.149. [DOI] [PubMed] [Google Scholar]
- 13.Johnston JE, Valentiner E, Maxson P, Miranda ML, Fry RC. Maternal Cadmium Levels during Pregnancy Associated with Lower Birth Weight in Infants in a North Carolina Cohort. PLoS One. 2014;9:e109661. doi: 10.1371/journal.pone.0109661. [DOI] [PMC free article] [PubMed] [Google Scholar]
- 14.Kippler M, Tofail F, Gardner R, Rahman A, Hamadani JD, Bottai M, et al. Maternal Cadmium Exposure during Pregnancy and Size at Birth: A prospective cohort study. Environ Health Perspect. 2012;120:284–289. doi: 10.1289/ehp.1103711. [DOI] [PMC free article] [PubMed] [Google Scholar]
- 15.Llanos MN, Ronco AM. Fetal growth restriction is related to placental levels of cadmium, lead and arsenic but not with antioxidant activities. Reprod Toxicol. 2009;27:88–92. doi: 10.1016/j.reprotox.2008.11.057. [DOI] [PubMed] [Google Scholar]
- 16.Menai M, Heude B, Slama R, Forhan A, Sahuquillo J, Charles MA, et al. Association between maternal blood cadmium during pregnancy and birth weight and the risk of fetal growth restriction: The EDEN mother–child cohort study. Reprod Toxicol. 2012;34:622–627. doi: 10.1016/j.reprotox.2012.09.002. [DOI] [PubMed] [Google Scholar]
- 17.Lin CM, Doyle P, Wang D, Hwang YH, Chen PC. Does prenatal cadmium exposure affect fetal and child growth? Occup Env Med. 2011;68:641–646. doi: 10.1136/oem.2010.059758. [DOI] [PubMed] [Google Scholar]
- 18.Kim Y, Ha EH, Park H, Ha M, Kim Y, Hong YC, et al. Prenatal lead and cadmium co-exposure and infant neurodevelopment at 6 months of age: The Mothers and Children’s Environmental Health (MOCEH) study. Neurotoxicology. 2013;35:15–22. doi: 10.1016/j.neuro.2012.11.006. [DOI] [PubMed] [Google Scholar]
- 19.Schoeters G, Hond EDEN, Zuurbier M, Hazel PVANDEN, Stilianakis N, Koppe JG. Cadmium and children: Exposure and health effects. Acta Paediatr. 2006;95:50–54. doi: 10.1080/08035320600886232. [DOI] [PubMed] [Google Scholar]
- 20.Yamada H, Koizumi S. DNA Microarray Analysis of Human Gene Expression Induced by a Non-lethal Dose of Cadmium. Ind Health. 2002;40:159–166. doi: 10.2486/indhealth.40.159. [DOI] [PubMed] [Google Scholar]
- 21.Yamada H, Uenishi R, Suzuki K, Koizumi S. Cadmium-induced alterations of gene expression in human cells. Environ Toxicol Pharmacol. 2009;28:61–69. doi: 10.1016/j.etap.2009.02.007. [DOI] [PubMed] [Google Scholar]
- 22.Vidal AC, Semenova V, Darrah T, Vengosh A, Huang Z, King K, et al. Maternal cadmium, iron and zinc levels, DNA methylation and birth weight. BMC Pharmacol Toxicol. 2015;16:1–9. doi: 10.1186/s40360-015-0020-2. [DOI] [PMC free article] [PubMed] [Google Scholar]
- 23.Kippler M, Engström K, Mlakar SJ, Bottai M, Ahmed S, Hossain MB, et al. Sex-specific effects of early life cadmium exposure on DNA methylation and implications for birth weight. Epigenetics. 2013;8:494–503. doi: 10.4161/epi.24401. [DOI] [PMC free article] [PubMed] [Google Scholar]
- 24.Hossain MB, Vahter M, Concha G, Broberg K. Low-Level Environmental Cadmium Exposure Is Associated with DNA Hypomethyla-tion in Argentinean Women. Environ Health Perspect. 2012;120:879–884. doi: 10.1289/ehp.1104600. [DOI] [PMC free article] [PubMed] [Google Scholar]
- 25.Vilahur N, Vahter M, Broberg K. The Epigenetic Effects of Prenatal Cadmium Exposure. Curr Envir Heal Rpt. 2015;2:195–203. doi: 10.1007/s40572-015-0049-9. [DOI] [PMC free article] [PubMed] [Google Scholar]
- 26.Kokkinos MI, Murthi P, Wafai R, Thompson EW, Newgreen DF. Cadherins in the human placenta – epithelial-mesenchymal transition (EMT) and placental development. Placenta. 2010;31:747–755. doi: 10.1016/j.placenta.2010.06.017. [DOI] [PubMed] [Google Scholar]
- 27.Cao X, Lin H, Muskhelishvili L, Latendresse J, Richter P, Heflich RH. Tight junction disruption by cadmium in an in vitro human airway tissue model. Respir Res. 2015;16 doi: 10.1186/s12931-015-0191-9. [DOI] [PMC free article] [PubMed] [Google Scholar]
- 28.Pearson CA, Lamar PC, Prozialeck WC. Effects of cadmium on E-cadherin and VE-cadherin in mouse lung. Life Sci. 2003;72:1303–1320. doi: 10.1016/s0024-3205(02)02379-2. [DOI] [PubMed] [Google Scholar]
- 29.Prozialeck WC, Lamar PC, Lynch SM. Cadmium alters the localization of N-cadherin, E-cadherin, and beta-catenin in the proximal tubule epithelium. Toxicol Appl Pharmacol. 2003;189:180–195. doi: 10.1016/S0041-008X(03)00130-3. [DOI] [PubMed] [Google Scholar]
- 30.Chen WV, Maniatis T. Clustered protocadherins. Development. 2013;3302:3297–3302. doi: 10.1242/dev.090621. [DOI] [PMC free article] [PubMed] [Google Scholar]
- 31.Kawaguchi M, Toyama T, Kaneko R, Hirayama T, Kawamura Y, Yagi T. Relationship between DNA Methylation States and Transcription of Individual Isoforms Encoded by the Protocadherin-alpha Gene Cluster. J Biol Chem. 2008;283:12064–12075. doi: 10.1074/jbc.M709648200. [DOI] [PubMed] [Google Scholar]
- 32.Severson PL, Tokar E, Vrba L, Waalkes M, Futscher B. Agglomerates of aberrant DNA methylation are associated with toxicant-induced malignant transformation. Epigenetics. 2012;7:1238–1248. doi: 10.4161/epi.22163. [DOI] [PMC free article] [PubMed] [Google Scholar]
- 33.Tasic B, Nabholz CE, Baldwin KK, Kim Y, Rueckert EH, Ribich SA, et al. Promoter choice determines splice site selection in Protocadherin alpha and gamma Pre-mRNA Splicing. Cell Press. 2002;10:21–33. doi: 10.1016/s1097-2765(02)00578-6. [DOI] [PubMed] [Google Scholar]
- 34.Katori S, Hamada S, Noguchi Y, Fukuda E, Yamamoto T, Yamamoto H, et al. Protocadherin-alpha Family Is Required for Serotonergic Projections to Appropriately Innervate Target Brain Areas. J Neurosci. 2009;22:9137–9147. doi: 10.1523/JNEUROSCI.5478-08.2009. [DOI] [PMC free article] [PubMed] [Google Scholar]
- 35.Fenton TR, Kim JH. A systematic review and meta-analysis to revise the Fenton growth chart for preterm infants. BMC Pediatr. 2013;13 doi: 10.1186/1471-2431-13-59. [DOI] [PMC free article] [PubMed] [Google Scholar]
- 36.Meller M, Vadachkoria S, Luthy DA, Williams MA. Evaluation of Housekeeping Genes in Placental Comparative Expression Studies. Placenta. 2005;26:601–607. doi: 10.1016/j.placenta.2004.09.009. [DOI] [PubMed] [Google Scholar]
- 37.Maccani JZJ, Koestler DC, Lester B, Houseman EA, Armstrong DA, Kelsey KT, et al. Placental DNA Methylation Related to Both Infant Toenail Mercury and Adverse Neurobehavioral Outcomes, Environ. Health Perspect. 2015;123:723–729. doi: 10.1289/ehp.1408561. [DOI] [PMC free article] [PubMed] [Google Scholar]
- 38.Chen Y, Lemire M, Choufani S, Butcher DT, Grafodatskaya D, Zanke BW, et al. Discovery of cross-reactive probes and polymorphic CpGs in the Illumina Infinium HumanMethylation450 microarray. Epigenetics. 2013;8:203–209. doi: 10.4161/epi.23470. [DOI] [PMC free article] [PubMed] [Google Scholar]
- 39.Johnson WE, Li C. Adjusting batch effects in microarray expression data using empirical Bayes methods. Biostatistics. 2007;8:118–127. doi: 10.1093/biostatistics/kxj037. [DOI] [PubMed] [Google Scholar]
- 40.Rousseeuw P, Croux C, Todorov V, Ruckstuhl A, Salibian-barrera M, Verbeke T, et al. robustbase: Basic Robust Statistics. R package version 0.92-5. 2015 http://cran.r-project.org/package=robustbase.
- 41.Rosseel Y. lavaan: An R Package for Structural Equation. J Stat Softw. 2012;48 [Google Scholar]
- 42.Punshon T, Li Z, Marsit CJ, Jackson BP, Baker ER, Karagas MR. Placental Metal Concentrations in Relation to Maternal and Infant Toenails in a U.S. Cohort. Environ Sci Technol. 2016;50:1587–1594. doi: 10.1021/acs.est.5b05316. [DOI] [PMC free article] [PubMed] [Google Scholar]
- 43.Hayashi S, Takeichi M. Emerging roles of protocadherins: from self-avoidance to enhancement of motility. J Cell Sci. 2015;128:1–10. doi: 10.1242/jcs.166306. [DOI] [PubMed] [Google Scholar]
- 44.Anitha A, Thanseem I, Nakamura K, Yamada K, Iwayama Y, Toyota T, et al. Protocadherin alpha (PCDHA) as a novel susceptibility gene for autism. J Psychiatry Neurosci. 2013;38:192–198. doi: 10.1503/jpn.120058. [DOI] [PMC free article] [PubMed] [Google Scholar]
- 45.Brown N, Burgess T, Forbes R, McGillivray G, Kornberg A, Mandelstam S, et al. 5q31.3 Microdeletion Syndrome: Clinical and Molecular Characterization of Two Further Cases. Am J Med Genet Part A. 2013;161A:2604–2608. doi: 10.1002/ajmg.a.36108. [DOI] [PubMed] [Google Scholar]
- 46.Mikheev AM, Nabekura T, Kaddoumi A, Bammler TK, Govindarajan R, Hebert MF, et al. Profiling Gene Expression in Human Placentae of Different Gestational Ages: An OPRU* Network and UW SCOR Study. Reprod Sci. 2008;15:866–877. doi: 10.1177/1933719108322425. [DOI] [PMC free article] [PubMed] [Google Scholar]
- 47.Huuskonen P, Storvik M, Reinisalo M, Honkakoski P, Rysa J, Hakkola J, et al. Microarray Analysis of the Global Alterations in the Gene Expression in the Placentas From Cigarette-smoking Mothers. Clin Pharmacol Ther. 2008;83:542–550. doi: 10.1038/sj.clp. [DOI] [PubMed] [Google Scholar]
- 48.He K. Trace elements in nails as biomarkers in clinical. Eur J Clin Invest. 2011;41:98–102. doi: 10.1111/j.1365-2362.2010.02373.x. [DOI] [PMC free article] [PubMed] [Google Scholar]
- 49.Kippler M, Hoque AMW, Raqib R, Öhrvik H, Ekström E, Vahter M. Accumulation of cadmium in human placenta interacts with the transport of micronutrients to the fetus. Toxicol Lett. 2010;192:162–168. doi: 10.1016/j.toxlet.2009.10.018. [DOI] [PubMed] [Google Scholar]
- 50.Yang K, Julan L, Rubio F, Sharma A, Guan H. Cadmium reduces 11 beta-hydroxysteroid dehydrogenase type 2 activity and expression in human placental trophoblast cells. Am J Physiol Endocrinol Metab. 2006;290:E135–E142. doi: 10.1152/ajpendo.00356.2005. [DOI] [PubMed] [Google Scholar]
- 51.Murphy VE, Smith R, Giles WB, Clifton VL. Endocrine Regulation of Human Fetal Growth: The Role of the Mother, Placenta, and Fetus. Endocr Rev. 2006;27:141–169. doi: 10.1210/er.2005-0011. [DOI] [PubMed] [Google Scholar]
Associated Data
This section collects any data citations, data availability statements, or supplementary materials included in this article.