Abstract
Longitudinal study of the heartbeat in small animals contributes to understanding structural and functional changes during heart development. Optical coherence microscopy (OCM) has been demonstrated to be capable of imaging small animal hearts with high spatial resolution and ultrahigh imaging speed. The high image contrast and noninvasive properties make OCM ideal for performing longitudinal studies without requiring tissue dissections or staining. Drosophila has been widely used as a model organism in cardiac developmental studies due to its high number of orthologous human disease genes, its similarity of molecular mechanisms and genetic pathways with vertebrates, its short life cycle, and its low culture cost. Here, the experimental protocols are described for the preparation of Drosophila and optical imaging of the heartbeat with a custom OCM system throughout the life cycle of the specimen. By following the steps provided in this report, transverse M-mode and 3D OCM images can be acquired to conduct longitudinal studies of the Drosophila cardiac morphology and function. The en face and axial sectional OCM images and the heart rate (HR) and cardiac activity period (CAP) histograms, were also shown to analyze the heart structural changes and to quantify the heart dynamics during Drosophila metamorphosis, combined with the videos constructed with M-mode images to trace cardiac activity intuitively. Due to the genetic similarity between Drosophila and vertebrates, longitudinal study of heart morphology and dynamics in fruit flies could help reveal the origins of human heart diseases. The protocol here would provide an effective method to perform a wide range of studies to understand the mechanisms of cardiac diseases in humans.
Keywords: Developmental Biology, Issue 118, Drosophila, optical coherence tomography, optical coherence microscopy, heart morphology, cardiac function, optical imaging, heart rate, cardiac activity period
Introduction
Longitudinal study of the heart in small animals contributes to understanding a variety of human related cardiovascular diseases, such as gene related congenital heart defects1,2. In the past decades, various animal models, such as mouse3,4, Xenopus5,6, zebrafish7,8, avian9, and Drosophila10-16, have been used to conduct the human heart-development related research. The mouse model has been widely used to study normal and abnormal cardiac development and cardiac defect phenotypes due to its similarities with the human heart3,4. The Xenopus embryo is especially useful in the study of heart development due to its easy handling and partial transparency5,6. The transparency of the embryo and early larva of the zebrafish model allows for easy optical observation of cardiac development7,8. The avian model is a common subject of developmental heart studies because the heart can be easily accessed after removing the eggshells and the morphological similarity of avian hearts to humans9. The Drosophila model has some unique features which make it ideal for performing longitudinal studies of the heart. First, the heart tube of Drosophila is ~ 200 µm below the dorsal surface, which provides convenience for optical access and observation of the heart. Additionally, many molecular mechanisms and genetic pathways are conserved between Drosophila and vertebrates. The orthologs of over 75% of human disease genes were found in Drosophila, which have made it widely used in transgenic studies11,13. Furthermore, it has a short life cycle and low maintenance costs, and has been commonly used as a specimen model for developmental biology research14-16.
Previous reports described the protocols for monitoring Drosophila cardiac functions such as the heartbeat. However, dissection procedures were required17,18. Optical imaging provides an effective way to visualize cardiac development in animals due to its non-invasive nature. Different optical imaging modalities have been applied in performing animal cardiac study, such as two-photon microscopy19, confocal microscopy20,21, light sheet microscopy22, and optical coherence tomography (OCT)16,23-26. Comparatively, OCT is capable of providing great imaging depth in small animal hearts without using contrast agents, while keeping a high resolution and an ultrahigh imaging speed, which are important for imaging live animals. Additionally, the low cost of developing an OCT system has popularized this technique for optical imaging of specimens. OCT has been successfully used for the longitudinal study of Drosophila. Using OCT, cardiac morphological and functional imaging has been performed to study the heart structures, the functional roles of genes, and the mechanisms of cardiovascular defects in mutant models during cardiac development. For example, age-dependent cardiac function decline was confirmed with down-regulated angiotensin-converting enzyme-related (ACER) gene in Drosophila with OCT27. Phenotyping of gene related cardiomyopathy was demonstrated in Drosophila using OCT28-33. Research using OCT also revealed the functional role of the human SOX5 gene in the heart of Drosophila34. Compared with OCT, OCM uses an objective with a higher numerical aperture to provide better transverse resolution. In the past, the heart dysfunction caused by silencing an ortholog human circadian gene dCry/dClock has been studied using a custom OCM system15,16, as well as the effect of high-fat-diet on cardiomyopathies in Drosophila to understand obesity induced human cardiac diseases.15
Here, the experimental protocol is summarized for longitudinal study of the cardiac morphological and functional changes in Drosophila at second instar (L2), third instar (L3), pupa day 1 (PD1), pupa day 2 (PD2), pupa day 3 (PD3), pupa day 4 (PD4), pupa day 5 (PD5), and adult (Figure 1) using OCM to facilitate study of human-related congenital cardiac diseases. Cardiac functional parameters, such as HR and CAP were quantitatively analyzed at different developmental stages to reveal the cardiac development features.
Protocol
1. Preparation of OCM System for Optical Imaging of Drosophila16
Select a spectrometer and a high-speed line scan camera that provides a frame rate of at least 80 frame/sec so the OCM system will be able to resolve the heartbeat of Drosophila.
Use a broadband light source to ensure the axial resolution of 2 µm to identify the heart structure of Drosophila.
Use a 10X objective to obtain a high transverse resolution.
Use a 45° rod mirror to reflect the reference arm light beam and to generate an annular sample arm light beam to extend the depth of focus in the specimens.
Develop a custom computer program to control the OCM system and perform measurements.
2. Drosophila Culture
- Standard Fly Food Preparation
- Put ~ 5 ml instant Drosophila formula into a polystyrene vial tube with the assistance of a paper chute.
- Pour ~ 8 ml water into the formula to properly saturate the food.
- Add different supplements to the standard fly food for different experiments. When preparing for all-trans-retinal (ATR) food for the optogenetic pacing experiment35, use a pipette to extract 100 mM ATR and dissolve into ~ 8 ml water to get the ATR concentration of 1 mM in food. After mixing the solution uniformly, pour the solution into the formula and stir it sufficiently.
- To prepare a high-fat-diet for studying obesity related heart dysfunctions in Drosophila,10,15 mix ~10 ml formula with 15 ml water in a cup and heat for 30 sec in a microwave oven. Put some organic extra virgin coconut oil in another cup and heat it for 90 sec in the microwave oven.
- Extract 7.5 ml coconut oil and mix with the prepared formula sufficiently to make the weight/volume ratio of coconut oil to food ~ 30/100, and then extract ~ 2 ml mixed food and put it to the bottom of a tube.
- Wait for 1 min until the medium is thoroughly saturated. Compact the food carefully with a flat surface to optimize the living conditions for the Drosophila. Add 6 - 8 grains of yeast to the prepared formula, and plug the tube with a cluster of cotton.
- Fruit Fly Crosses and Culture
- Take a tube with prepared standard fly food, and remove the plugged cotton. Carefully transfer the adult flies (male and female) to the tube, and plug the tube with cotton immediately. Check the cotton to make sure that there is no gap between the cotton and the tube wall to prevent flies from escaping from the tube.
- Keep the fruit flies in the incubator at 25 °C for cross breeding. Most of the genes are active and the cellular proteins are synthesized at 25 °C36-39.
- Take the tube out from the incubator after 8 hand transfer the adult flies out of the tube to obtain the eggs at similar age for experimental control.
- Continue culturing the eggs in the incubator at 25 °C, which is the standard temperature for Drosophila development with the development period of 8.5 days40,41. NOTE: Temperature influences the developmental period (egg to adult) and expression level of various genes.
3. Performing Optical Imaging with OCM
- Mount Fly Larva for Optical Imaging NOTE: The egg of Drosophila hatches in 22 - 24 hr at 25 °C to the first instar larva (L1). The second instar larva emerges after another 24 hr. The largest larval form is the third instar larva, which molts after about 24 hr. Structural characteristics in larva can be used to distinguish their different developmental stages. The size of the mouthparts between the first instar and the second instar is different. The mouth hooks of the first instar larva are very small and look like two pairs of tiny black spots, while the mouth hooks of the second instar larva are larger and the structure is clearer. The spiracles are usually used to identify the second instar and the third instar. The second instar larva has clubbed anterior spiracles, while, for the third instar, the anterior spiracles are branched. A dark orange ring will begin to appear at the tip of the posterior spiracles in the third instar larva.
- Apply a piece of double sided tape to a clean microscope glass slide. Expel the air bubbles under the tape to avoid the reflections caused by air bubbles during imaging.
- Take one of the tubes with the cultured flies out from the incubator at the larval stage.
- Identify the larva in the media, remove it from the media with a soft brush and place on a clean tissue. Remove any food stuck to the larva with a wet soft brush and dry it on the tissue.
- Move the cleaned fly to a tissue under the objective lens of a wide field microscope.
- Adjust the focus of the microscope to find a clear view of the fly. Identify the right developmental stage of the larva by its structural characteristics with the microscope.
- Position the fly using the soft brush. Ensure the body is straight with the dorsal side facing upward to prepare for mounting on the glass slide by the dorsal side. Perform this step under the microscope.
- Ensure the larva is completely dry before mounting on the tape. Otherwise, the larva will not adhere to the tape.
- Stick the dorsal side of the positioned fly to the double side tape on the glass slide with moderate pressure. Note that too much pressure may kill the fly and too little force will lead to fly movement during imaging.
- Optical Imaging of Drosophila at Larval Stages (L2 and L3) with OCM NOTE: A broad lumen of the heart tube can be found located in the segments between A5 to A8 at the larval stages (Figure 1). The transverse OCM M-mode images (2D + time) were acquired at the A7 segment of the heart tube for each larva to facilitate the systolic and diastolic analysis.
- Place the mounted larva on the adjustable sample stage of the OCM system along the y-transverse direction with the dorsal side facing upward below the objective lens. A small hole in the sample stage is necessary for placing the larva to avoid its contact with the stage plane.
- Adjust the sample stage to move the heart tube of the fruit fly to the focal plane of the imaging beam. To easily find the A7 segment, find the posterior region of the heart tube with the real time cross sectional OCM images in the image acquisition software. Then move the stage forward until the A7 segment is visible.
- Set parameters of the image acquisition software to 100 A-scans per B-scan (frame), 100 B-scans, and the scanner voltage to cover ~ 0.28 mm in the x-transverse direction, and 0 V in the y-transverse direction. Click the "start" button in the software to acquire the background noise data for background subtraction by blocking the sample beam path with a dark cloth. NOTE: 3 of the 100 frames can be used for the background subtraction.
- Set parameters of the data acquisition software to 128 A-scans per B-scan, 4096 B-scans, and the scanner voltage to cover ~ 0.28 mm in the x-transverse direction, and 0 V in the y-transverse direction. Click the "start" button in the software to acquire the transverse M-mode images across the A7 segment of the fly heart tube over a region covering 0.28 x 0.57 mm2 for about 30 sec.
- Block the imaging beam using a dark cloth during the data saving process to avoid lengthy exposure of the fly heart to the imaging light.
- Repeat the measurement for 5 times to get reliable measurement of the heart function.
- Set parameters of the image acquisition software to 400 A-scans per B-scan, 800 B-scans, and the scanner voltage to cover ~ 1.7 mm in the x-transverse direction, and ~ 4 mm in the y-transverse direction. Move the stage in both directions to ensure the entire fruit fly can be imaged. Click the "start" button in the software to acquire one dataset to obtain images of the fruit fly in 3 dimensions. Note: The 3D fly structure can be rendered using Amira 3D software
- Use a wet soft brush to moisten the measured fly and gently remove it from the glass slide. Move it into a separate tube for continuous development. Label the tube for longitudinal study through the next developmental stages.
- Image Drosophila at Pupal Stages NOTE: All the fruit flies were taken out for imaging from PD1 to PD5. As shown in the larva schematic in Figure 1b, a broad lumen remains in A5 to A8 segments of the heart tube until PD1. From PD2, a conical chamber starts to develop between A1 to A4 segments. To acquire consistent images and facilitate heart analysis, transverse M-mode images were obtained from the A7 segment at PD1, and from A1 segment after PD2, as marked in Figure 1b.
- Image Drosophila at PD1 NOTE: Drosophila will have a white puparium for a short time window (0 - 1 hr) during PD1. This time window is ideal for performing optical imaging of early pupa because the high transparency leads to higher light penetration for the OCM imaging.
- As the fruit flies are found on the tube wall when they become pupa, remove the pupa from individual tubes for imaging at PD1 with a wet soft brush, and clean the pupa with the brush if there is food stuck to the body.
- Mount the fruit fly on a small glass slide directly with the wet brush and keep the dorsal side facing upward (Figure 1a). Make sure the glass slide is small enough to fit back into the tube once imaging at this stage is complete.
- Remove excessive water from the side of the fly body.
- Put the glass slide on the sample stage of the OCM system, keeping the fruit fly on top. Find clear real-time image of the A7 segment of the fly heart utilizing the same strategy described in the larva measurement.
- Set the same parameters of the data acquisition software as in section 3.2, and image the heartbeats at the A7 segment to acquire transverse M-mode and 3D images.
- After imaging, use a tweezer to place the glass slide with pupa back into the tube for continuous culture.
- Image Drosophila at PD2 to PD5 Stages NOTE: Since the specimen becomes more and more opaque during the pupal stages, the penetration depth of the imaging system will be reduced.
- Use a tweezer to carefully remove the glass slide mounted with the fly at PD2 from the tube for imaging. At PD2, the specimen shell becomes yellowish and the body becomes less transparent compared to PD1 (Figure 1).
- Put the slide on the sample stage of the OCM system.
- Adjust the sample stage to move the fly into the focal plane of imaging beam of the OCM system. Find the anterior end of the heart tube with real-time cross-sectional OCM image. Move ~ 50 µm back in the posterior direction to find the A1 segment of the heart tube. NOTE: At this point of heart development (PD2), the conical chamber will be very small and may not be beating.
- Collect transverse M-mode datasets from the A1 segment as well as 3D data using the same method as previous developmental stages.
- Put the slide back to the tube carefully for continuous culture. NOTE: At PD3, the color of the specimen in the shell is darker than that at PD2 stage. At PD4 stage, black stripes can be observed inside the shell of the specimens. Some flies will develop into adult from this stage in the following day, while others will evolve into PD5. At PD5 stage, black stripes are even more obviously seen in the fruit flies. These flies will become adults in the following day.
- Image Drosophila at the Adult Stage NOTE: At the adult stage, female and male flies can be distinguished by the size of the body and the color of the lower abdomen. Female adults have larger size, while males are smaller and dark-colored in the lower abdomen.
- Take the tube out from the incubator when the fruit fly develops into an adult, and transfer the adult fly to a ~ 45 ml empty vial.
- Dip the absorbent end (~ 1 cm length, ~ 3 mm diameter) of a wand into the anesthesia, put the wand into the vial, and plug the tube with a cluster of cotton to keep the anesthetic end just below the plugged cotton and to anesthetize the fly for 3 min. The duration of anesthesia depends on the size of the fly, and may vary between 2.5 to 3.5 min (for example: male for 2.5 min, female for 3 or 3.5 min).
- Prepare a glass slide with a piece of double sided tape.
- Move the anesthetized fly onto the glass slide with dorsal side facing upward using the soft brush.
- Separate the wings using a tweezer and stick the wings on the tape under a microscope to fix the fly and expose the heart region for imaging.
- Image the fly from the A1 segment of the fly heart (Figure 1). At the end of the experiment, the fly may be sacrificed.
4. Imaging Analysis16
Develop Matlab programs to convert the 2D and 3D binary files collected with the image acquisition software to image files.
Use ImageJ to identify the heart tube region in the transverse M-mode images and a magic wand algorithm to create a mask of the heart region for each transverse M-mode image. Segment the masked region and use a peak-finding algorithm to identify the systolic and diastolic locations. Calculate the time dependent heart diameter changes from the transverse M-mode images.
Based on the acquired time dependent heart diameters, calculate the cardiac parameters such as HR, cardiac activity period (CAP),end diastole diameter (EDD), end systole diameter (ESD), end diastole area (EDA), and end systole area (ESA). Calculate the fractional shortening (FS) with

Use ImageJ to analyze the 3D OCM images to visualize the structural development of the fly heart.
Representative Results
The longitudinal cardiac imaging was conducted using the fruit flies with the 24B-GAL4/+ strain at room temperature with OCM. Measurements were performed at L2, L3, and at 8 hr intervals from PD1 to PD4, and adult day 1 (AD1) to track the metamorphosis process (Table 1). Larva, early pupa, late pupa and adult flies were mounted on the glass slides as seen in Figure 1A. The segment features of the heart for larval and adult flies were shown in the schematic representations in Figure 1B.
In this developmental study, 4,096 frames were acquired in 32 sec with our custom OCM system to trace the heartbeat of a fruit fly. To improve measurement accuracy, five repeated measurements were taken for each specimen at each developmental stage. 3D data can also be obtained to observe the heart structure changes during metamorphosis.
Transverse M-mode and 3D images were created with custom Matlab programs and ImageJ. En face images and axial sections were also constructed from the acquired data to visualize the remodeling process of the heart during Drosophila metamorphosis (Figure 2). To quantify the cardiac function of fruit flies, the heart region was automatically segmented using a custom Matlab program from all 4096 frames. The fly heart rate (HR) can be quantified from the transverse M-mode OCM images (Figure 3a). During pupal stages, the Drosophila heart stops beating occasionally16. We introduced a new cardiac functional parameter, cardiac activity period (CAP) to quantify the ratio of the period with a heartbeat to the total imaging time (Figure 3b). EDD, ESD, EDA, ESA, and FS were also used to quantify the heart chamber changes in both axial and transverse dimensions during Drosophila development.16
At larval stages, the heart tube begins at the posterior abdominal region A8 with a broader lumen (A5 - A8 in Figure 1B) and ends at the anterior dorsal segment A1 with a narrower diameter (T3/A1 - A5 in Figure 1B). The heart chamber was located medially and dorsally and grew bigger during L2 (Figure 2 a, b) and L3 (Figure 2 c, d). After entering PD1, the heart tube was observed running axially over the top of a moving air bubble (Figure 2 e, f). Around 10 - 13 hr later, the bubble disappeared after puparium formation and the broad lumen became everted. Since the anterior heart tube was ventrally located, the whole heart tube was invisible except the posterior region in the OCM images ~12 hr after puparium formation. Later during PD2, the heart chamber gradually aligned along the dorsal abdomen, and the posterior part (A6 - A8) of the heart was eliminated (Figure 2 g, h)42,43. A conical chamber started to develop ~ A1 - A4 segment during PD2 and grew in size until the adult stage (Figure 2 i - m).
Besides observing structural changes, many functional changes were found as well during cardiac remodeling. The M-mode images shown in Figure 3 demonstrate that the heartbeat slowed down significantly from the larval stage to the pupal stage, and then increased substantially from pupa to adult. Significant HR changes were observed during the lifecycle (Figure 4a). Furthermore, the cardiac activity period (CAP) was analyzed for all the specimens measured from L2 to AD1 (Figure 4b). As shown in Figure 4, HR holds at ~ 277 beats per min (bpm) for L2 and L3. Upon entering the early pupal stages there is a marked decrease in HR and CAP. HR is reduced to 86 ± 11 bpm at the beginning of PD1, and continues to decrease to 26 ± 8 bpm by the end of PD1 finally coming to a complete stop early in PD2. One interesting discovery is the extended period of cardiac inactivity observed around PD2 stage (~ 24 hr - 48 hr after puparium formation), referred to as cardiac developmental diastalsis16. At the end of PD2, slow intermittent beating resumes (HR 17 bpm ± 6 with CAP 5 ± 2). Throughout PD3 and PD4, HR and CAP increase until reaching 392 ± 32 bpm and 95 ± 3 % at the first day of the adult stage (5 days after beginning the pupal stage).
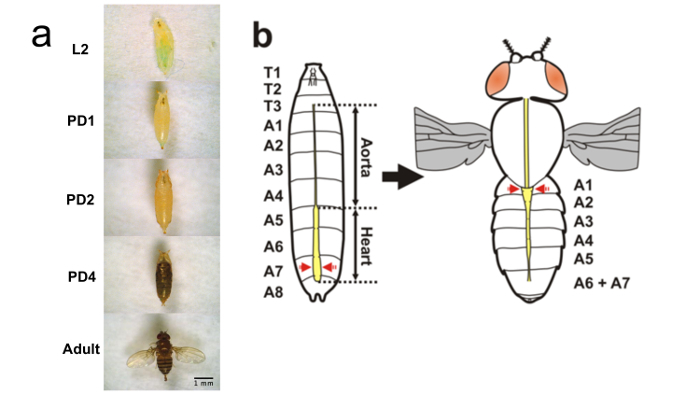 Figure 1. Mounting of Drosophila at Different Stages and Schematic Representation of Heart Metamorphosis. (a) Mounting of larval, pupal, and adult WT (24B-GAL4/+) flies on glass slides. (b) Schematic representation of heart metamorphosis. Red arrows on larva and adult schematic denote the OCM M-mode imaging locations until PD1 24 hr and for subsequent time points, respectively. Please click here to view a larger version of this figure.
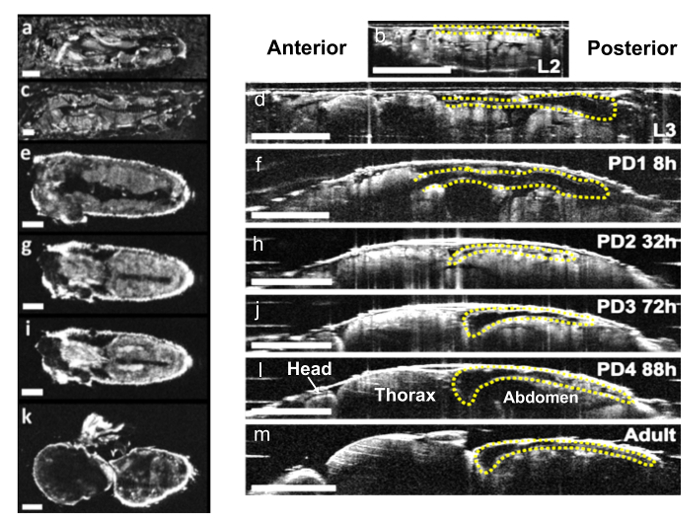 Figure 2.Drosophila Heart Morphological Changes. En face and axial sectional OCM images of a WT Drosophila obtained at (a, b) L2 (c, d) L3 (e, f) PD1 (g, h) PD2 (i, l) PD4 and (k, m) adult stages. M-mode images of the Drosophila heart were obtained from the A7 segment until PD1 and from A1 segment for later stages. The scale bars in en face and axial sectional images denote 200 µm and 500 µm, respectively.
Please click here to view a larger version of this figure.
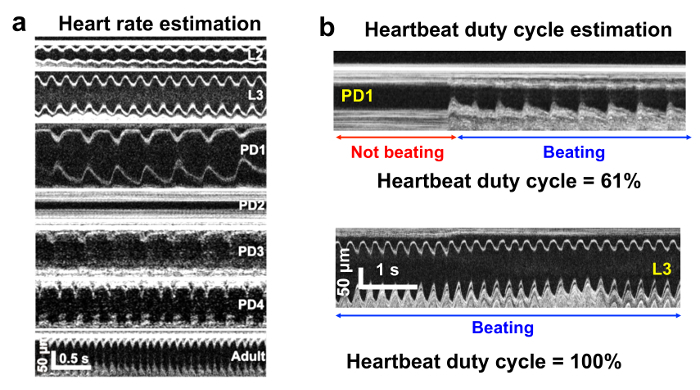 Figure 3.Drosophila Heart Functional Changes. (a) M-mode images at different developmental stages showing HR changes across lifecycle. (b) Examples demonstrating cardiac activity period (CAP) calculation.
Please click here to view a larger version of this figure.
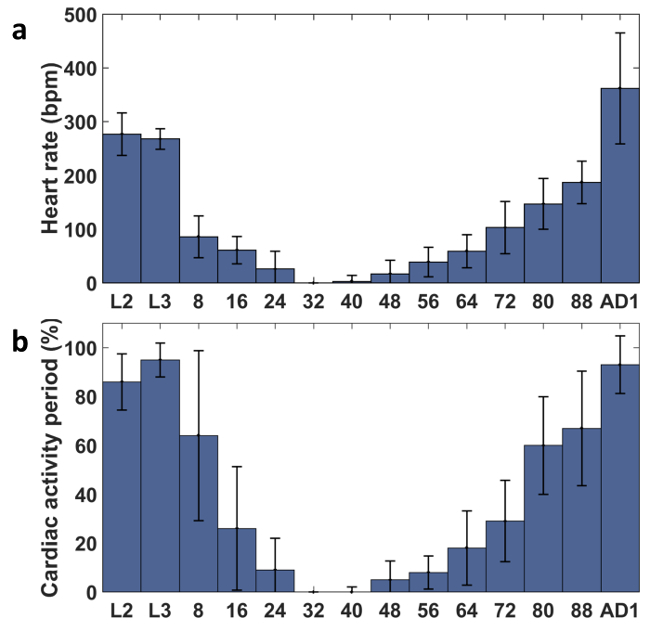 Figure 4. Quantitative Analysis of Functional Cardiac Parameters in WT Flies at Different Developmental Stages, including L2, L3, Pupal Stages at 8 hr intervals, and AD1. (a) HR. (b) CAP. The error bar of each group represents the standard deviation. Please click here to view a larger version of this figure.
| Developmental Stage | ||||||||||||||
| L2 | L3 | PD1 | PD2 | PD3 | PD4 | AD1 | ||||||||
| 8 hr | 16 hr | 24 hr | 32 hr | 40 hr | 48 hr | 56 hr | 64 hr | 72 hr | 80 hr | 88 hr | ||||
| Specimen Number | 21 | 17 | 13 | 19 | 19 | 19 | 19 | 19 | 19 | 18 | 17 | 18 | 9 | 25 |
Table 1. Number of WT Fruit Flies Measured at Various Developmental Stages in the Cardiac Developmental Study.
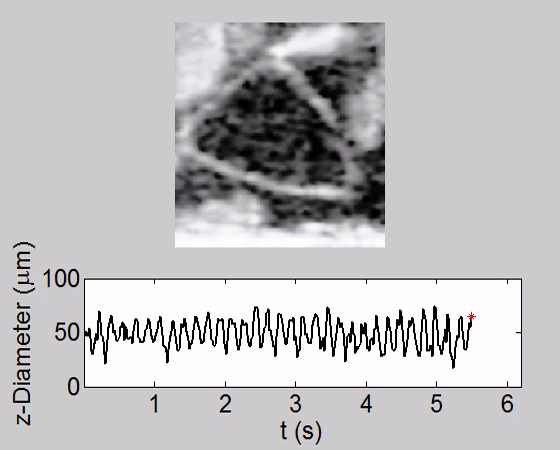 Video 1. Tracking of Heartbeat Along Temporal Dimension and Corresponding Heart Chamber Diameter Change along the z Direction (axial direction) in a WT fly at L2. The heart was beating relative fast at a steady rate. Please click here to view this video. (Right-click to download.)
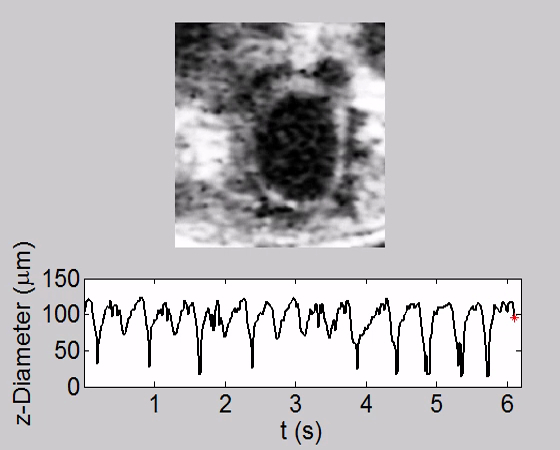 Video 2. Tracking of Heartbeat along Temporal Dimension and Corresponding Heart Chamber Diameter Change along the z Direction (axial direction) in a WT fly at PD1. The HR started to decrease. Please click here to view this video. (Right-click to download.)
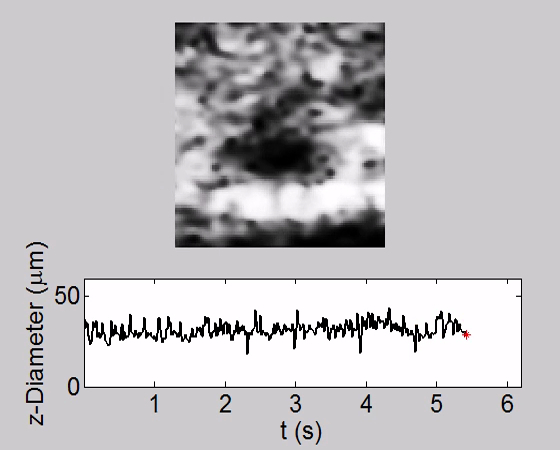 Video 3. Tracking of Heartbeat along Temporal Dimension and Corresponding Heart Chamber Diameter Change along the z Direction (Axial Direction) in a WT fly at PD2. The heart stopped beating completely during the time. The oscillation of plotted z-diameter was due to the imaging noise. Please click here to view this video. (Right-click to download.)
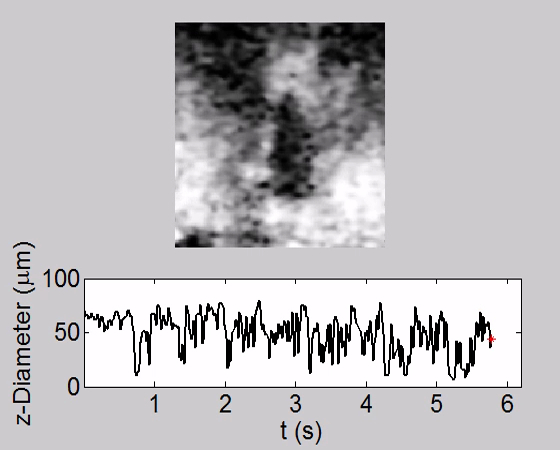 Video 4. Tracking of Heartbeat along Temporal Dimension and Corresponding Heart Chamber Diameter Change along the z Direction (Axial Direction) in a WT fly at PD4. After PD2, the HR and CAP started to increase. Please click here to view this video. (Right-click to download.)
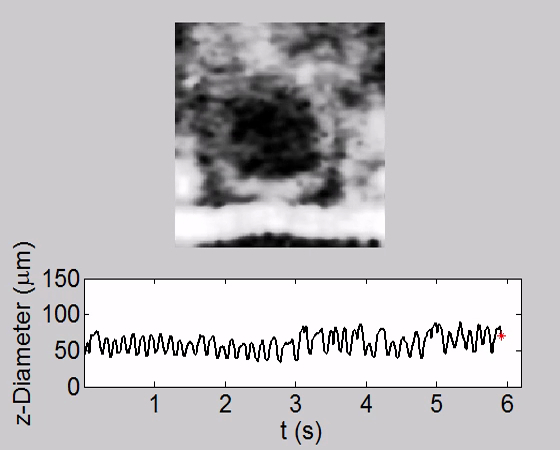 Video 5. Tracking of Heartbeat along Temporal Dimension and Corresponding Heart Chamber Diameter Change along the z Direction (Axial Direction) in a WT Fly at AD1. The HR was the highest among all stages and CAP was almost 100%. Please click here to view this video. (Right-click to download.)
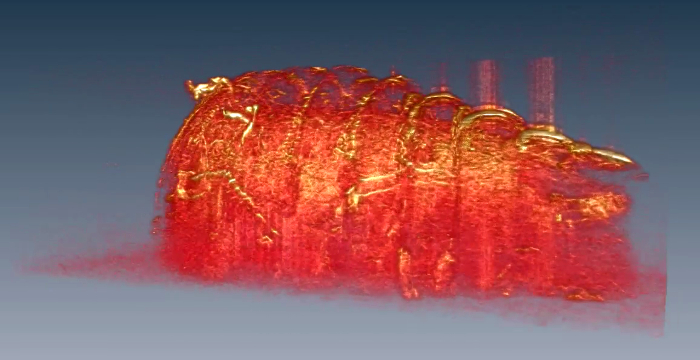 Video 6. 3D structural rendering of a larval fly. Please click here to view this video. (Right-click to download.)
Discussion
The rapid heartbeat of Drosophila, with a maximum HR around 400 bpm at larval and adult stages, requires high imaging speed to resolve the heart diastoles and systoles (no less than 80 frames/sec based on experiences). Due to the small heart chamber size and micron scale heart wall thickness (5 - 10 µm), a high spatial resolution (better than 2 µm) is required for resolving the heart tube structures. In this study, a high resolution and ultrahigh speed OCM system was developed, where a spectrometer with 600 lines/mm transmission grating and a 2,048 pixel line-scan camera were used. An A-scan rate of 20 kHz is provided by the line-scan camera. The frame rate of 128 frames/sec is fast enough to capture the Drosophila heartbeat at multiple developmental stages, including L2, L3, PD1, PD2, PD3, PD4, PD5, and adult. The light source was a broad bandwidth supercontinuum light source with a central wavelength and bandwidth of ~ 800 nm and ~ 220 nm respectively and obtained an axial resolution of ~ 1.3 µm in tissue. A 10X objective was used in the sample arm to realize a transverse resolution of ~3.9 µm. Since the heart tube of Drosophila is around 200 µm below the dorsal surface, an imaging depth of hundreds of micron meters is required. A 45° rod mirror can be utilized to generate an annular sample beam and extend the depth of focus in the specimen44. The sensitivity and 3 dB roll-off were determined to be 96 dB and 600 µm, respectively with the sample arm power of ~ 9 mW. A custom computer program was used to control the OCM system and conduct the measurements. The cardiac structural images and functional parameters obtained demonstrate the feasibility of using OCM to quantitatively characterize the heart morphology and function of Drosophila throughout its whole lifecycle.
Currently, several other techniques are also used to image a small animal's heart structure or function, such as computed tomography (CT), magnetic resonance imaging (MRI), and ultrasound. OCM provides higher spatial and temporal resolutions than these techniques, enabling visualization of fine structures and fast dynamics in animal hearts. Confocal microscopy is another widely used imaging technique, but its low imaging penetration and requisition of imaging contrast agents limit its applications in live animals. Comparatively, OCM enables high-speed and label-free imaging for visualizing fast cardiac dynamics non-invasively in small animals. However, there are still limitations of OCM. For example, the imaging depth provided by OCM is limited by light scattering from several hundred microns to about 1 mm in tissue while ultrasound has penetration depths of up to 10 cm. Compared to confocal microscopy, OCM has a higher speed and better imaging depth, but with lower resolution and poor molecular contrast. Furthermore, our current OCM system is based on spectral-domain detection systems. Higher imaging speed based on swept-source OCM45 may provide more distinct images of rapid dynamics like the heartbeat.
To perform longitudinal study of the heartbeat in Drosophila with OCM, there are several critical steps in the protocol. The flies must be handled very delicately at all stages of the experiment. Managing larva should be especially gentle since it is easy to damage the larva, which could affect heart structure and function in the following developmental stages. The flies must be positioned on the cover glass and the imaging stage very precisely. Poorly positioned flies will make it difficult to acquire quality images and may cause skewed structural and functional heart parameter values. Additionally, transferring adult flies from one tube to another and plugging the cotton ball should be very fast to prevent their escape from the tube.
Different studies on Drosophila heart development can be performed by modifying the protocol. The temperature at which the flies are cultured can be increased or decreased from 25 °C to alter the cardiac gene expression level and change the fly development period. By adding some ingredients such as coconut oil or ATR to the standard food, the heart development may be altered. Specific studies can be conducted in wild type or transgenic flies. When studying fruit fly heart development longitudinally, different time intervals can be used to perform the OCM measurements, for example, an 8 hr interval could be used during the pupal stages. Due to limited sensitivity of our OCM system, a lot of uniform speckle noise is found in the transverse M-mode images, which can make it difficult to correctly identify heart contraction signals with Matlab programs and decrease the efficiency of data analysis. Sensitivity can be increased by improving the alignment of the OCM system. Optimized filtering algorithms are recommended to remove a portion of the speckles.
The described protocol has been applied to study the silence of human circadian orthologs, dCry and dClock induced cardiac defects in Drosophila. Decreased HRs were observed at different developmental stages, including larva, pupa, and adult15,16. The role of circadian genes in heart development was revealed, which may explain the association between cardiovascular disorders and circadian rhythm related activity patterns. High-fat-diet (HFD) induced cardiac disorders were also studied by analyzing heart functional changes of fruit flies fed with HFD15. These studies demonstrated not only Drosophila as a powerful tool in the developmental study of heart structure and function, but also the significance of cardiac longitudinal study in understanding congenital and postnatal human diseases. The OCM platform will enable a wide range of future studies in gene related human cardiac disease.
Disclosures
The authors declare no conflicts of interests related to the current study.
Acknowledgments
This work was supported by the Lehigh University Start-Up Fund, the NIH (R00EB010071 to C.Z., R15EB019704 to C.Z. and A.L., R03AR063271 to A.L., and R01AG014713 and R01MH060009 to R.E.T.), the NSF (1455613 to C.Z. and A.L.), the Cure Alzheimer's Fund (to R.E.T.), and the Massachusetts General Hospital (Executive Committee on Research Award to A.L.). M.C. and Y.M. was supported by the National Key Basic Research Program of China (973 Program) under Grant No. 2014CB340404.
References
- Liberatore CM, Searcy-Schrick RD, Yutzey KE. Ventricular expression of tbx5 inhibits normal heart chamber development. Dev. Biol. 2000;223(1):169–180. doi: 10.1006/dbio.2000.9748. [DOI] [PubMed] [Google Scholar]
- Christoffels VM, et al. Chamber formation and morphogenesis in the developing mammalian heart. Dev. Biol. 2000;223(2):266–278. doi: 10.1006/dbio.2000.9753. [DOI] [PubMed] [Google Scholar]
- Wessels A, Sedmera D. Developmental anatomy of the heart: a tale of mice and man. Physiol. Genomics. 2003;15(3):165–176. doi: 10.1152/physiolgenomics.00033.2003. [DOI] [PubMed] [Google Scholar]
- Savolainen SM, Foley JF, Elmore SA. Histology atlas of the developing mouse heart with emphasis on E11.5 to E18.5. Toxicol. Pathol. 2009;37(4):395–414. doi: 10.1177/0192623309335060. [DOI] [PMC free article] [PubMed] [Google Scholar]
- Yang VXD, et al. High speed, wide velocity dynamic range Doppler optical coherence tomography (Part II): Imaging in vivo cardiac dynamics of Xenopus laevis. Opt. Express. 2003;11(14):1650–1658. doi: 10.1364/oe.11.001650. [DOI] [PubMed] [Google Scholar]
- Yelin R, et al. Multimodality optical imaging of embryonic heart microstructure. J. Biomed. Opt. 2007;12(6):064021. doi: 10.1117/1.2822904. [DOI] [PMC free article] [PubMed] [Google Scholar]
- Bakkers J. Zebrafish as a model to study cardiac development and human cardiac disease. Cardiovasc. Res. 2011;91(2):279–288. doi: 10.1093/cvr/cvr098. [DOI] [PMC free article] [PubMed] [Google Scholar]
- Staudt D, Stainier D. Uncovering the molecular and cellular mechanisms of heart development using the zebrafish. Annu. Rev. Genet. 2012;46:397–418. doi: 10.1146/annurev-genet-110711-155646. [DOI] [PMC free article] [PubMed] [Google Scholar]
- Drake VJ, Koprowski SL, Lough JW, Smith SM. Gastrulating chick embryo as a model for evaluating teratogenicity: a comparison of three approaches. Birth Defects Res. A. 2006;76(1):66–71. doi: 10.1002/bdra.20202. [DOI] [PubMed] [Google Scholar]
- Birse RT, et al. High-fat-diet-induced obesity and heart dysfunction are regulated by the TOR pathway in Drosophila. Cell Metab. 2010;12(5):533–544. doi: 10.1016/j.cmet.2010.09.014. [DOI] [PMC free article] [PubMed] [Google Scholar]
- Bodmer R. Heart development in Drosophila and its relationship to vertebrates. Trends in Cardiovas. Med. 1995;5(1):21–28. doi: 10.1016/1050-1738(94)00032-Q. [DOI] [PubMed] [Google Scholar]
- Harvey RP. Nk-2homeobox genes and heart development. Dev. Biol. 1996;178(2):203–216. doi: 10.1006/dbio.1996.0212. [DOI] [PubMed] [Google Scholar]
- Bodmer R, Venkatesh TV. Heart development in Drosophila and vertebrates: conservation of molecular mechanisms. Dev Genet. 1998;22(3):181–186. doi: 10.1002/(SICI)1520-6408(1998)22:3<181::AID-DVG1>3.0.CO;2-2. [DOI] [PubMed] [Google Scholar]
- Cripps RM, Olson EN. Control of cardiac development by an evolutionarily conserved transcriptional network. Dev. Biol. 2002;246(1):14–28. doi: 10.1006/dbio.2002.0666. [DOI] [PubMed] [Google Scholar]
- Men J, et al. Optical coherence tomography for brain imaging and developmental biology. J. Sel. Top. Quantum Electron. 2016;22(4):6803213. doi: 10.1109/JSTQE.2015.2513667. [DOI] [PMC free article] [PubMed] [Google Scholar]
- Alex A, et al. A circadian clock gene, Cry, affects heart morphogenesis and function in Drosophila as revealed by optical coherence microscopy. PloS one. 2015;10(9):e0137236. doi: 10.1371/journal.pone.0137236. [DOI] [PMC free article] [PubMed] [Google Scholar]
- Vogler G, Ocorr K. Visualizing the beating heart in Drosophila. J Vis Exp. 2009. p. e1425. [DOI] [PMC free article] [PubMed]
- Cooper AS, Rymond KE, Ward MA, Bocook EL, Cooper RL. Monitoring heart function in larval Drosophila melanogaster for physiological studies. J Vis Exp. 2009. p. e1425. [DOI] [PMC free article] [PubMed]
- Yalcin HC, et al. Two-photon microscopy-guided femtosecond-laser photoablation of avian cardiogenesis: noninvasive creation of localized heart defects. Am. J. Physiol. Heart C. 2010;299(5):H1728–H1735. doi: 10.1152/ajpheart.00495.2010. [DOI] [PubMed] [Google Scholar]
- Dolber PC, Spach MS. Conventional and confocal fluorescence microscopy of collagen fibers in the heart. J. Histochem. Cytochem. 1993;41(3):465–469. doi: 10.1177/41.3.7679127. [DOI] [PubMed] [Google Scholar]
- Mao H, Gribble M, Pertsov AM, Wang L, Shi P. Understanding embryonic heart morphogenesis through automatic segmentation and confocal imaging with optical clearing. ISBI. 2014. pp. 1303–1306.
- Bouchard MB, et al. Swept confocally-aligned planar excitation (SCAPE) microscopy for high-speed volumetric imaging of behaving organisms. Nat. Photonics. 2015;9(2):113–119. doi: 10.1038/nphoton.2014.323. [DOI] [PMC free article] [PubMed] [Google Scholar]
- Boppart SA, et al. Noninvasive assessment of the developing Xenopus cardiovascular system using optical coherence tomography. Proc. Natl. Acad. Sci. 1997;94(9):4256–4261. doi: 10.1073/pnas.94.9.4256. [DOI] [PMC free article] [PubMed] [Google Scholar]
- Kagemann L, et al. Repeated, noninvasive, high resolution spectral domain optical coherence tomography imaging of zebrafish embryos. Molecular Vision. 2008;14:2157–2170. [PMC free article] [PubMed] [Google Scholar]
- Jenkins MW, et al. Ultrahigh-speed optical coherence tomography imaging and visualization of the embryonic avian heart using a buffered Fourier Domain Mode Locked laser. Opt. Express. 2007;15(10):6251–6267. doi: 10.1364/oe.15.006251. [DOI] [PMC free article] [PubMed] [Google Scholar]
- Larin KV, Larina IV, Liebling M, Dickinson ME. Live imaging of early developmental processes in mammalian embryos with optical coherence tomography. J. Innov. Opt. Health Sci. 2009;2(03):253–259. doi: 10.1142/S1793545809000619. [DOI] [PMC free article] [PubMed] [Google Scholar]
- Liao F-T, Chang C-Y, Su M-T, Kuo W-C. Necessity of angiotensin-converting enzyme-related gene for cardiac functions and longevity of Drosophila melanogaster assessed by optical coherence tomography. J. Biomed. Opt. 2014;19(1):011014. doi: 10.1117/1.JBO.19.1.011014. [DOI] [PubMed] [Google Scholar]
- Wolf MJ, et al. Drosophila as a model for the identification of genes causing adult human heart disease. Proc. Natl. Acad. Sci. 2006;103(5):1394–1399. doi: 10.1073/pnas.0507359103. [DOI] [PMC free article] [PubMed] [Google Scholar]
- Choma MA, Izatt SD, Wessells RJ, Bodmer R, Izatt JA. In vivo imaging of the adult Drosophila melanogaster heart with real-time optical coherence tomography. Circulation. 2006;114(2):e35–e36. doi: 10.1161/CIRCULATIONAHA.105.593541. [DOI] [PubMed] [Google Scholar]
- Li A, et al. Changes in the expression of the Alzheimer's disease-associated presenilin gene in drosophila heart leads to cardiac dysfunction. Curr. Alzheimer Res. 2011;8(3):313. doi: 10.2174/156720511795563746. [DOI] [PMC free article] [PubMed] [Google Scholar]
- Choma MA, Suter MJ, Vakoc BJ, Bouma B, Tearney GJ. Heart wall velocimetry and exogenous contrast-based cardiac flow imaging in Drosophila melanogaster using Doppler optical coherence tomography. J. Biomed. Opt. 2010;15(5):056020. doi: 10.1117/1.3503418. [DOI] [PMC free article] [PubMed] [Google Scholar]
- Choma MA, Suter MJ, Vakoc BJ, Bouma BE, Tearney GJ. Physiological homology between Drosophila melanogaster and vertebrate cardiovascular systems. Dis. Model. Mech. 2011;4(3):411–420. doi: 10.1242/dmm.005231. [DOI] [PMC free article] [PubMed] [Google Scholar]
- Tsai MT, et al. Noninvasive imaging of heart chamber in Drosophila with dual-beam optical coherence tomography. J. Biophotonics. 2013;6(9):708–717. doi: 10.1002/jbio.201200164. [DOI] [PubMed] [Google Scholar]
- Li A, et al. Silencing of the Drosophila ortholog of SOX5 in heart leads to cardiac dysfunction as detected by optical coherence tomography. Hum. Mol. Genet. 2013;22(18):3798–3806. doi: 10.1093/hmg/ddt230. [DOI] [PMC free article] [PubMed] [Google Scholar]
- Alex A, Li A, Tanzi RE, Zhou C. Optogenetic pacing in Drosophila melanogaster. Sci. Adv. 2015;1(9):e1500639. doi: 10.1126/sciadv.1500639. [DOI] [PMC free article] [PubMed] [Google Scholar]
- Mirault ME, Goldschmidt-Clermont M, Moran L, Arrigo AP, Tissieres A. The effect of heat shock on gene expression in Drosophila melanogaster. IEEE T. Med. Imaging. 1978;42:819–827. doi: 10.1101/sqb.1978.042.01.082. [DOI] [PubMed] [Google Scholar]
- Boothroyd CE, Wijnen H, Naef F, Saez L, Young MW. Integration of Light and Temperature in the Regulation of Circadian Gene Expression in Drosophila. PLoS Genet. 2007;3(4) doi: 10.1371/journal.pgen.0030054. [DOI] [PMC free article] [PubMed] [Google Scholar]
- McGuire SE, Roman G, Davis RL. Gene expression systems in Drosophila: a synthesis of time and space. Trends Genet. 2004;20(8):384–391. doi: 10.1016/j.tig.2004.06.012. [DOI] [PubMed] [Google Scholar]
- Ashburner M, Bonner JJ. The induction of gene activity in drosophila by heat shock. Cell. 1979;17(2):241–254. doi: 10.1016/0092-8674(79)90150-8. [DOI] [PubMed] [Google Scholar]
- Ashburner M, Thompson JN., Jr . Laboratory culture of Drosophila. 2a. London: Academic Press; 1978. pp. 1–109. [Google Scholar]
- Ashburner M. Drosophila: a laboratory handbook. Cold Spring Harbor Laboratory Press; 1978. [Google Scholar]
- Molina MR, Ostia Cripps RM. the inflow tracts of the Drosophila heart, develop from a genetically distinct subset of cardial cells. Mech. Dev. 2001;109(1):51–59. doi: 10.1016/s0925-4773(01)00509-3. [DOI] [PubMed] [Google Scholar]
- Monier B, Astier M, Sémériva M, Perrin L. Steroid-dependent modification of Hox function drives myocyte reprogramming in the Drosophila heart. Development. 2005;132(23):5283–5293. doi: 10.1242/dev.02091. [DOI] [PubMed] [Google Scholar]
- Liu L, et al. Imaging the subcellular structure of human coronary atherosclerosis using micro-optical coherence tomography. Nat. Med. 2011;17(8):1010–1014. doi: 10.1038/nm.2409. [DOI] [PMC free article] [PubMed] [Google Scholar]
- Ahsen OO, et al. Swept source optical coherence microscopy using a 1310 nm VCSEL light source. Opt. Express. 2013;21(15):18021–18033. doi: 10.1364/OE.21.018021. [DOI] [PMC free article] [PubMed] [Google Scholar]


