Abstract
Myocardial infarction is defined as cardiomyocyte death due to prolonged ischemia; an inflammatory response and scar formation (fibrosis) follow the ischemic injury. Following the initial acute phase, chronic remodeling of the left ventricle (LV) modifies the structure and function of the heart. Permanent coronary ligation in small animals has been widely used as a reference model for a chronic model of MI. Thinning of the infarcted wall progressively develops to transmural fibrosis. Histological assessment of infarct size is commonly performed; nevertheless, a standardization of the methods for quantification is missing. Indeed, important methodological aspects, such as the number of sections analyzed and the sampling and quantification methods, are usually not described and therefore preclude comparison across investigations. Too often, quantification is performed on a single section obtained at the level of the papillary muscles. Because novel strategies aimed at reducing infarct expansion and remodeling are under investigation, there is an important need for the standardization of accurate heart sampling protocols. We describe an accurate method to quantify the infarct size using a systematic sampling of harvested rat heart and image analyses of trichromatic stained histological sections obtained from base to apex. We also provide evidence that calculating the expansion index (EI) allowed for infarct size assessment, taking into account changes of the left ventricle throughout the remodeling.
Keywords: Medicine, Issue 118, myocardial infarction, histology, Masson-Goldner trichroma staining, infarct expansion index, rat, systematic sampling
Introduction
Myocardial infarction (MI) is a leading cause of death and disability worldwide. Coronary heart disease is the main cause; MI results from ischemia consecutive to coronary events such as occlusion. When reperfusion is not performed within the first 6 hr, ischemia induces irreversible myocardial necrosis. In patients, the characterization of MI relies on different diagnostic tools, including clinical signs, electrocardiography, assessment of plasma levels of biomarkers, echocardiography, MRI imaging, and histological analyses1. Acute and chronic MI are classified as two different phases of injury according to the timing of the myocardial necrosis relative to the time of the coronary occlusion. The acute phase, occurring during the first 7 days, is associated with the loss of cardiomyocytes, extensive inflammation, and the recruitment of fibroblasts. The sub-acute phase, characterized by healing of the cardiac tissue and the formation of a scar, occurs between 1 and 4 - 6 weeks. Expansion of the infarct, ventricle wall thinning, and ventricle dilatation characterize the chronic phase. Extensive remodeling of the left ventricle progressively results in severe heart failure2.
MI induced by permanent left anterior descending artery (LAD) ligation represents the standard rodent model of chronic myocardial infarction. The coronary ligature mimics the coronary occlusion. The size of the infarct depends on the site of the ligature. Characterization of myocardial ischemic injury in a rodent model is classically performed using biomarker plasma levels, such as troponin I and T3, echocardiography, MRI, and histology4,5. Biomarker levels are correlated with the extent of cardiomyocyte death. Echocardiography evaluates the left ventricular function impairment resulting from regional wall motion abnormalities. In addition, non-invasive imaging techniques, such as MRI or high-resolution echocardiography, allow the assessment of the reduction in wall motion, the volume of the scar area with reduced perfusion and viable myocardium, and the wall thinning. LV dimensions permit the accurate evaluation of infarct size. Finally, the quantification of viable and dead myocardium can be performed postmortem using specific stains of histological sections of harvested hearts and allows verification of the infarct size (IS). Another important feature is the evaluation of the infarct expansion index (EI)6. The EI is associated with the transmural infarct and starts within the first 3 days. The EI is characterized by a progressive reduction in wall thickness, an increase in the LV cavity size, and consequent changes in LV shape.
In order to evaluate the therapeutic efficacy of novel treatments--in particular, the regenerative strategies based on cells, matrices, and gene delivery-accurate assessment of MI in rodents is of paramount importance. When measured on a single cross section obtained at the papillary muscle level, the IS size may be biased due to the large variability that exists in infarct development following LAD ligation; the apex infarct might be then occulted. Importantly, more accurate methodologies to determined MI size have been described for mice7-9 or rats10. Nevertheless, IS is insufficient to accurately quantify LV remodeling or therapeutically induced reductions (or preventions) of the remodeling. Indeed, IS is commonly expressed as a percentage of total LV volume assessed on cross sections of the heart. Although this method is valid for acute MI, the thinning of the LV wall occurring during remodeling remains under-evaluated11,12. A complete morphometric quantification of infarct size and structural changes should quantify several parameters, such as endocardial and epicardial lengths and diameters, as well as infarct and healthy areas. We describe a methodological approach to accurately assess MI and remodeling in a chronic rat model.
Protocol
All animals received humane care in compliance with the European Convention on Animal Care. Surgical procedures were performed in accordance with the Swiss Animal Protection Law after obtaining permission of the State Veterinary Office, Fribourg, approved by the Swiss Federal Veterinary Office, Switzerland.
1. Heart Harvesting
NOTE: All surgical interventions were performed under isoflurane anesthesia. Efforts were made to diminish animal suffering. In particular, all animals received a subcutaneous injection of 0.1 mg/kg buprenorphine pre-anesthesia. The surgical protocol for inducting myocardial infarction has been previously described elsewhere13.
- Perform a sternotomy on a myocardially infarcted animal under anesthesia (intubated animal, 2.5% isoflurane, proper anesthesia confirmed by paw pinch reflex).
- Open the animal by cutting the skin and then the muscles with surgical scissors. Cut the ribs on the left and right, and then remove the chest.
- Remove the adhesions remaining after the previous surgery (LAD ligation). Cut the aorta and remove the heart. Put the tissue in 1 M KCl (in PBS), and then wash it with PBS.
2. Tissue Preparation
Put the infarcted heart longitudinally in an acrylic rat heart matrix. Keep it at -20 °C for 1 hr.
Cut the heart directly in the matrix using a razor blade with a transversal. Ensure each slice is 2 mm thick. Cut approximately 5 - 7 slides for each heart (based on the remodeling level); this is called systematic sampling.
- At this step, performing the 2,3,5-triphenyltetrazolium chloride (TTC) staining is optional (keep the orientation of the heart slices base-to-apex).
- Incubate in 1% TTC in PBS for 50 min at 37 °C. Incubate it in 4% paraformaldehyde (PFA) for 20 min to 1 hr. Put the sections between two glass plates with 2-mm spacers and take pictures with a stereological microscope coupled with a camera at 15X magnification. CAUTION! Paraformaldehyde is toxic.
- Slide freezing (1st option)
- Put each slide in a plastic mold (10 x 10 x 5 mm) with mounting medium for cryotomy (optimal cutting temperature, OCT), maintain the orientation (place the apex-oriented side of the section down on the bottom of the mold). Freeze the blocks with 2-methylbutane vapors under liquid nitrogen cooling for 10 - 15 min. Finally, store the tissue at -80 °C.
- Paraffinization (2nd option)
- Place each slide in embedding cassettes (maintain the orientation by placing the apex-oriented side of the section down on the bottom of the cassette) and then in 4% PFA for 24 hr. Put it in a tissue processor machine overnight.
- Incubate it in ethanol 70% for 2 hr. Incubate it in ethanol 95% for 2 hr. Incubate it in ethanol 100% for 3 hr. Incubate it in xylol for 4 hr. Incubate it in paraffin (molten at 60 °C in an oven) for 5 hr. Finally, make blocks by embedding each heart slide in paraffin.
3. Masson-Goldner Trichrome Staining
Make tissue sections from paraffin blocks with a manual microtome (thickness: 5 µm) or from OCT blocks with a cryostat set to -18 °C (thickness: 7 µm).
- Stain one slide from each heart part for each rat (3 - 4 transversal sections per slide) with Masson-Goldner trichrome staining (see annex). NOTE: Start from this step for the paraffin sections.
- Melt the slides at 60 °C in an oven. Under a fume hood, deparaffinize them in xylol twice for 10 min each. Rehydrate them in 100% ethanol, 95% ethanol, 70% ethanol, and distilled water for 3 min each. NOTE: Start from this step for the cryosections.
- Fix them in Bouin solution overnight. Then, rinse them in running tap water for 10 - 15 min. Rinse them in distilled water. Incubate them in Mayer's hematoxylin for 3 min.
- Remove the slides and leave them in distilled water for 5 min. Then, incubate them in acid Fuchsin-Ponceau for 5 min. Rinse them in 1% acetic acid for 1 min.
- Next, incubate them in phosphomolybdic acid Orange G for 1 min. Rinse them in 1% acetic acid for 1 min, incubate them in light green dye for 10 min, and rinse them in 1% acetic acid for 1 min.
- Dehydrate them in 70% ethanol (30 sec), 95% ethanol (30 sec), and 100% ethanol (5 min). Put one drop of a resinous mounting medium on the tissue sections, cover them with coverslips, and let them dry.
4. Infarct Size Analysis
Acquire one image from each slide on a stereomicroscope (15X magnification) coupled with a camera. Photograph a ruler with the same settings.
- Use image analysis software to measure the scar thickness in the middle of the infarct, the septum thickness, the left ventricle (LV) cavity area, the infarct area, and the LV tissue area using.
- Set the scale with the ruler picture (Figure 1A).
- Click on Measurementsthen select Set Conversion Factor. Draw a line on the calibration bar. Right click on the picture and click on End calibration. Note the bar value, and then click OK.
- Select the LV from the stained heart picture (Figure 1B). Use the Multiple segment tool. Select the LV point-by-point, and then right clickCopy/Paste anywhere.
- Measure the scar and septum thickness using the single segment measurement tool (Figure 1C).
- Automatically detect the LV cavity, infarct, and LV areas using the automatic area measurement tool in RGB mode (Figure 1D).
- Click on the tool. Activate Only BordersandContiguous in RGB mode. Finally, click inside the area of interest to detect it. If necessary, use precision tools.
Calculate the infarct size as the ratio of the infarct area to the LV area.
Calculate the expansion index as follows: [LV cavity area / whole LV area] / [infarct thickness / septum thickness], with the whole LV area including both the LV cavity and LV tissue areas.
Finally, calculate an "average" for each heart as follows: [average of expansion index from the infarcted slides] * [Number of infarcted slides / Total number of slides].
Representative Results
Six weeks post-LAD ligation, hearts were harvested from Lewis rats. 2-mm tissue sections were obtained from apex to base. A TTC staining procedure was performed to visualize the infarct area, which appears in white, and the healthy myocardium, which appears in red (Figure 2). Depending on the site of ligation of the LAD, the infarct size varies. For large MI, transmural infarcts were observed from apex to base (Figure 2A). Smaller infarcts presented white infarcted tissue visible from the apex to the mid-section of the heart (Figure 2B). For small non-transmural infarcts, fibrotic tissue was observed on only one or two sections from the apex (Figure 2C).
Thin 5-µm sections from each heart slice were cut and stained with Masson-Goldner trichrome. Pictures of the whole cross section of the heart were acquired under a stereomicroscope (Figure 3). Healthy tissues appeared in red and the connective tissue in green. Discrimination between each color can be easily performed with an image analysis software.
The thicknesses of the infarct and the septum, the LV cavity area and the LV total area were measured and computed to calculate the EI (Table 1). The EI was calculated for each section. Depending on the heart size, the number of sections varied from 5 to 7. For each heart, the EI is an average of the EI from each section. The EI varied from 0 to 0.278 and revealed a wide range of myocardial infarcts, with a CV of 58%. In comparison, the average of the percentage of infarct to the LV varied from 0 to 0.241, with a CV of 54% (Table 1). The EI and the percentage of infarct were significantly correlated; a non-parametric Spearman analysis provided a correlation coefficient r-value of 0.491 (p = 0.005) (Figure 4A). For close EI values, such as 0.11 and 0.13, the percentage of infarct varied from 5.8 to 24.1%.
Heart function was assessed by high-resolution echocardiography at 6 weeks post-LAD ligation on anesthetized animals and was performed once prior to heart harvesting. The EI calculated from histological quantification correlated significantly with the EF. A non-parametric Spearman analysis provided an r-value of -0.709 (p = 0.005) (Figure 4B).
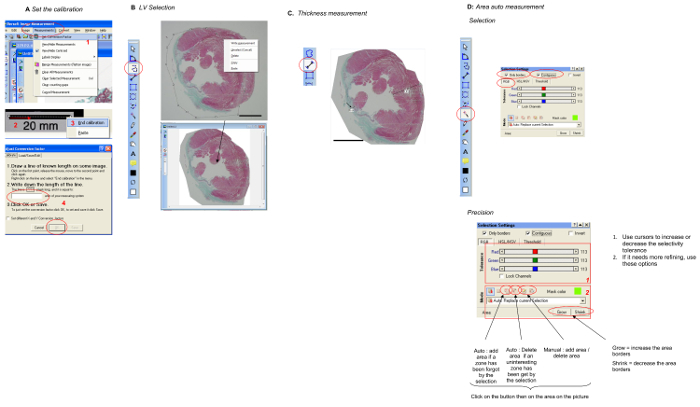 Figure 1.Step-by-step Illustration of the Use of theImage Analysis Software. Automatic color delimitation and length measurements included the several steps. A. Calibration: The scale of the image was set up. A picture of a ruler was taken in the same condition as the heart section. The length of the ruler was marked to define the scale conversion factor. Conversion from pixel to millimeters was performed. B. LV selection: The right ventricle was cut out of the picture using the selection tool of the software. C. LV wall and septum thickness measurement: The single measurement tool was used to quantify distances. The scale bars indicate 3 mm. D. Automatic area quantification: Automatic color delimitation was performed in RGB mode. Auto-selection was performed after selecting the auto-selection mode. Color-based selection can be modified; the investigator performed visual control of the selected green tissue and increased or decreased the selected region as necessary. The scale bars indicate 3 mm. Please click here to view a larger version of this figure.
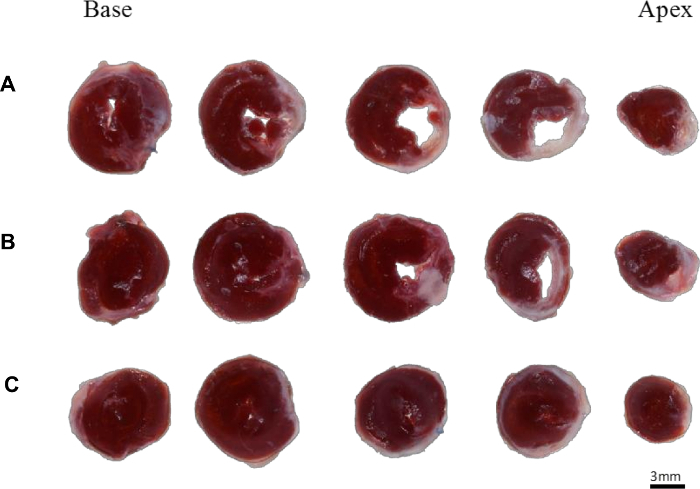 Figure 2. Heart Sections Stained with TTC. 2-mm sections of the full heart were stained with TTC. Healthy myocardium appeared in red and fibrotic tissues in white. Three hearts with different infarct sizes are presented. A: large transmural infarct, B: medium infarct, and C: small infarct. The scale bars indicate 3 mm. Please click here to view a larger version of this figure.
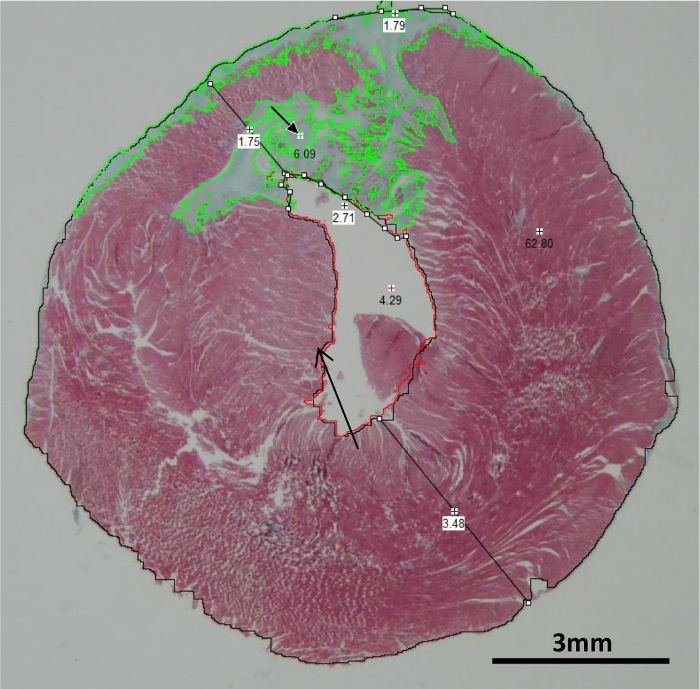 Figure 3. Heart Sections Stained with Masson-Goldner Trichrome. 5-µm sections were cut from each heart section obtained 6 weeks post-LAD ligation. Stained sections were placed under a stereomicroscope. Pictures of the full sections were obtained with 15X magnification. The representative picture, obtained at the level of the papillary muscles (back arrow), shows healthy myocardium in red and fibrotic tissues in green. The picture illustrates the automatic color delimitation with the image analysis software, as well as the site at which the infarct and septum thickness were measured (black lines). The scale bars indicate 3 mm. Please click here to view a larger version of this figure.
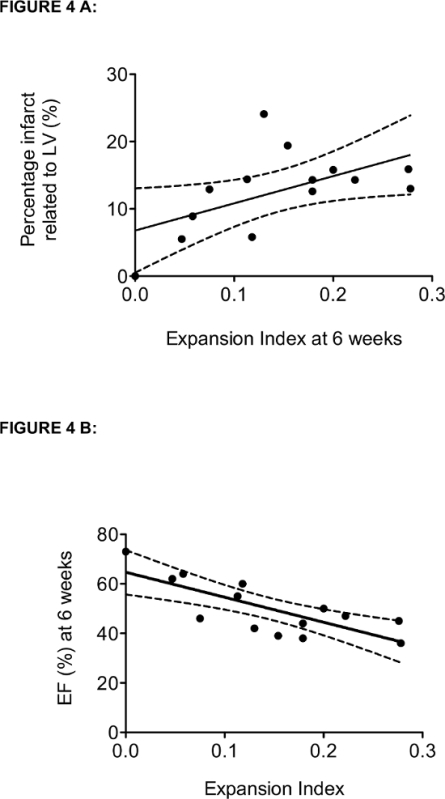 Figure 4.Correlation Between the Expansion Index (EI) and the Percentage of the Infarct Related to LV (A) or the Ejection Fraction (EF) (B). The linear regression (black line) and 95% confidence intervals (dotted lines) are represented. The non-parametric Spearman r-value is reported. A: The percentage of infarct and EI significantly correlated (r = 0.567; p = 0.003). The infarct expansion index (EI) was calculated as [LV cavity area/whole LV area]/[infarct thickness/septum thickness]. The whole LV area was measured as the combined LV cavity and LV tissue area. The percentage of the infarct was calculated as LV tissue area/infarct tissue area. B: The function assessed at 6 weeks post-LAD ligation using a high-resolution echocardiography significantly correlated with EI. Both parameters were significantly correlated (r = -0.709; p = 0.005). Please click here to view a larger version of this figure.
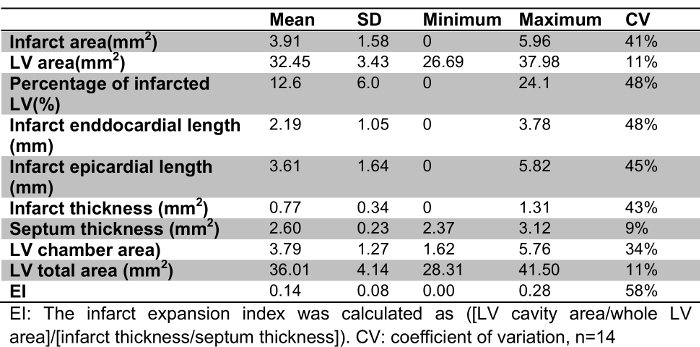 Table 1:
Parameters Measured on Masson Goldner-stained Heart Sections.
Discussion
Critical Steps within the Protocol
Fibrotic tissue can be accurately assessed in a chronic MI rat model using systematic sampling of the harvested heart and image analyses of trichromatic-stained histological sections obtained from base to apex. Two steps are particularly important for successful protocol implementation. First, the use of KCl for heart harvesting allows the cardiac muscle to be maintained in a relaxed state. This step is important for comparisons of infarct dimensions from different hearts. Second, the overnight fixation of the section in Bouin solution is critical to obtain bright trichrome staining.
Modifications and Troubleshooting
Absence of staining may be due to difficulties during the fixation of the section in Bouin solution, such as reduced incubation time or expired Bouin solutions. The TTC staining is optional and could be used to visualize the infarct size in a rapid but non-quantitative way. It is important to note that TTC can be performed for the same heart prior to the inclusion in either OCT or paraffin.
Limitations of the Technique
The present approach permits one to choose between paraffin-embedded and cryo-preserved heart sections and can be used for immunostaining. Nevertheless, the full heart has to be sectioned, and the tissue cannot be used for further analysis, such as western blot or RT-PCR for protein and gene expression analyses.
Significance of the Technique with Respect to Existing/Alternative Methods
Because the quantification procedures and, in particular, the number of analyzed sections vary widely between investigations, defining the minimal number of sections necessary to obtain a reliable quantification is paramount. Takagawa et al.9 demonstrated that reliability is maximized with a minimal heart slice number of 6 - 8 sections of the whole heart of a mouse using 1-mm intervals. In the present protocol, 5 - 7 sections of the entire rat heart were obtained when performing 2-mm thick sectioning. Furthermore, 2-mm sections are a standard and frequently used size for TTC staining. In addition, the systemic sampling is simple to apply and presents a periodic aspect that allows characterization of the entire heart.
From each of the 2-mm slices, 5-µm sections were cut and stained. For each 5-µm section, quantification of the septum thickness, scar thickness and length, total scar area, total LV area, and LV cavity area were performed, and the average of each parameter was calculated per animal. We used Masson-Goldner staining of thin sections rather than TTC staining of 2-mm sections to improve the accuracy of both the automatic color detection and the assessment of lengths. Indeed, TTC staining is mostly interesting for early-phase or ischemic reperfusion models for the detection of the area at risk8,14, rather than for the chronic stage.
MI induced from LAD ligation may vary depending on the ligature site. In the presented chronic infarction model, the ligation size was intentionally modified for each animal, and results for various conditions of infarct size and remodeling were present after 6 weeks. Accordingly, the calculated EI revealed a wide range of myocardial infarcts and supported the difference observed in heart function correlated with EF. When extensive thinning of the infarcted segment occurred, the area of the infarct was greatly reduced in the case of transmural fibrosis. In this condition, defining the infarct size by calculating the area of the infarct tissue in relation to the entire LV (expressed as a percentage of the LV) would weakly evaluate the extent of the infarct. The lack of consideration for remodeling-induced LV dilation and extreme thinning of the infarct LV wall may underestimate the infarct size, while an infarct present in the absence of wall thinning would over-estimate the infarct size, as represented by the values outside of the 95% confidence interval. This shortcoming could be eliminated through the calculation of the EI.
It has been shown that the LV shape change is positively correlated with the EI and wall thinning15, 16. Although EI can be a predictor of LV function, it is important to emphasize that echocardiography and histological analyses are complementary methods to assess the myocardial infarct at the functional and tissue level, respectively. Echocardiography allows longitudinal study, and histological analyses provide fundamental end-point assays that allow additional quantification of LV morphology, such as wall thickness.
Future Applications or Directions after Mastering This Technique
The systemic sampling of the entire heart and the calculation of the EI are of particular interest when assessing chronic MI. In addition, this method will be suitable for the evaluation of treatment efficacy, in particular for novel treatments, such as cell- and matrix-based treatments that aim at reducing infarct size and remodeling. Reliable quantification of infarct expansion is of paramount importance for comparisons between non-treated and treated animals, as end-point histological analyses preclude the comparison of infarct size pre- and post-treatment.
Disclosures
The authors have nothing to disclose.
Acknowledgments
The study was supported by the Swiss National Foundation [SNF 310030-149986 to MNG], the University of Fribourg, and Fribourg Hospital.
References
- Amsterdam EA, et al. AHA/ACC Guideline for the Management of Patients with Non-ST-Elevation Acute Coronary Syndromes: a report of the American College of Cardiology/American Heart Association Task Force on Practice Guidelines. J Am Coll Cardiol. 2014;64:e139–e228. doi: 10.1016/j.jacc.2014.09.017. [DOI] [PubMed] [Google Scholar]
- Konstam MA, Kramer DG, Patel AR, Maron MS, Udelson JE. Left ventricular remodeling in heart failure: current concepts in clinical significance and assessment. JACC Cardiovasc Imaging. 2011;4:98–108. doi: 10.1016/j.jcmg.2010.10.008. [DOI] [PubMed] [Google Scholar]
- Frobert A, et al. Prognostic Value of Troponin I for Infarct Size to Improve Preclinical Myocardial Infarction Small Animal Models. Front Physiol. 2015;6:353. doi: 10.3389/fphys.2015.00353. [DOI] [PMC free article] [PubMed] [Google Scholar]
- Redfors B, Shao Y, Omerovic E. Myocardial infarct size and area at risk assessment in mice. Exp Clin Cardiol. 2012;17:268–272. [PMC free article] [PubMed] [Google Scholar]
- Guex AG, et al. Plasma-functionalized electrospun matrix for biograft development and cardiac function stabilization. Acta Biomater. 2014;10:2996–3006. doi: 10.1016/j.actbio.2014.01.006. [DOI] [PubMed] [Google Scholar]
- Landa N, et al. Effect of injectable alginate implant on cardiac remodeling and function after recent and old infarcts in rat. Circulation. 2008;117:1388–1396. doi: 10.1161/CIRCULATIONAHA.107.727420. [DOI] [PubMed] [Google Scholar]
- Valente M, et al. Optimized heart sampling and systematic evaluation of cardiac therapies inmouse models of ischemic injury: Assessment of cardiacremodeling and semi-automated quantification of myocardial infarctsize. Curr. Protoc. Mouse Biol. 2015;5:359–391. doi: 10.1002/9780470942390.mo140293. [DOI] [PubMed] [Google Scholar]
- Csonka C, et al. Measurement of myocardial infarct size in preclinical studies. J. Pharmacol. Toxicol. Methods. 2010;61:163–170. doi: 10.1016/j.vascn.2010.02.014. [DOI] [PubMed] [Google Scholar]
- Zornoff LA, Paiva SA, Minicucci MF, Spadaro J. Experimental myocardium infarction in rats: Analysis of the model. Arq. Bras Cardiol. 2009;93:434–440. doi: 10.1590/s0066-782x2009001000018. [DOI] [PubMed] [Google Scholar]
- Lichtenauer M, et al. Myocardial infarct size measurement using geometric angle calculation. Eur J Clin Invest. 2014;44:160–167. doi: 10.1111/eci.12202. [DOI] [PubMed] [Google Scholar]
- Lutgens E, et al. Chronic myocardial infarction in the mouse: cardiac structural and functional changes. Cardiovasc Res. 1999;41:586–593. doi: 10.1016/s0008-6363(98)00216-8. [DOI] [PubMed] [Google Scholar]
- Frobert A, Valentin J, Cook S, Lopes-Vicente L, Giraud MN. Cell-based therapy for heart failure in rat: double thoracotomy for myocardial infarction and epicardial implantation of cells and biomatrix. J Vis Exp. 2014. p. e51390. [DOI] [PMC free article] [PubMed]
- Takagawa J, et al. Myocardial infarct size measurement in the mouse chronic infarction model: comparison of area- and length-based approaches. J Appl Physiol (1985) 2007;102:2104–2111. doi: 10.1152/japplphysiol.00033.2007. [DOI] [PMC free article] [PubMed] [Google Scholar]
- Fishbein MC, et al. Early phase acute myocardial infarct size quantification: validation of the triphenyl tetrazolium chloride tissue enzyme staining technique. Am Heart J. 1981;101:593–600. doi: 10.1016/0002-8703(81)90226-x. [DOI] [PubMed] [Google Scholar]
- Weisman HF, Bush DE, Mannisi JA, Weisfeldt ML, Healy B. Cellular mechanisms of myocardial infarct expansion. Circulation. 1988;78:186–201. doi: 10.1161/01.cir.78.1.186. [DOI] [PubMed] [Google Scholar]
- Mannisi JA, Weisman HF, Bush DE, Dudeck P, Healy B. Steroid administration after myocardial infarction promotes early infarct expansion. A study in the rat. J Clin Invest. 1987;79:1431–1439. doi: 10.1172/JCI112971. [DOI] [PMC free article] [PubMed] [Google Scholar]


