Abstract
Tenascin-C is an extracellular matrix glycoprotein that is expressed by injured tissues and by various cancers. Recent publications showed that tenascin-C expression by cancer lesions predicts tumor growth, metastasis, and angiogenesis, suggesting tenascin-C as a potential therapeutic target. Currently there is no noninvasive method to determine tumoral tenascin-C expression in vivo. To address the need for an agent to image and quantify tenascin-C, we report the development of a radioactive PET tracer based on a tenascin-C–specific single-stranded DNA aptamer (tenascin-C aptamer).
Methods
Tenascin-C aptamer was radiolabeled with 18F and 64Cu. PET imaging studies for the evaluation of tumor uptake and pharmacokinetics of tenascin-C aptamer were performed in comparison to a nonspecific scrambled aptamer (Sc aptamer).
Results
The labeled tenascin-C aptamer provided clear visualization of tenascin-C–positive but not tenascin-C–negative tumors. The uptake of tenascin-C aptamer was significantly higher than that of Sc aptamer in tenascin-C–positive tumors. The labeled tenascin-C aptamer had fast clearance from the blood and other nonspecific organs through the kidneys, resulting in high tumor contrast.
Conclusion
Our data suggest that suitably labeled tenascin-C aptamer can be used as a PET tracer to image tumor expression of tenascin-C with a high tumor-to-background ratio and might provide insightful and personalized medical data that will help determine appropriate treatment and monitoring.
Keywords: DNA aptamer, tenascin-C, PET
Tenascin-C is an extracellular matrix glycoprotein that is minimally expressed in healthy adult tissue, transiently expressed during injury and tissue remodeling, and downregulated after tissue repair (1–6). During malignant transformations of various cancers, the regulation of tenascin-C expression is absent. The protein is highly expressed in neovasculature and tumor stroma, and the presence of tenascin-C was suggested to play a key role in tumor initiation and progression (3,7–9).
Tenascin-C expression was shown to contribute to the supportive tumor microenvironment by direct interactions with cells and growth factors and enhancing cell survival, migration, proliferation, and transdifferentiation of tumor cells (5). Its expression also affects the tumor tissue by increasing tumor growth, metastasis, angiogenesis, and inhibition of immune surveillance (4,8,10). The quantification of tenascin-C expression by various tumors has not been evaluated in human patients because of the lack of a method to quantify the protein noninvasively. Knowledge of tenascin-C concentration could be useful for cancer diagnosis and prediction of tumor responses to therapies (including experimental therapies targeting tenascin-C).
The tumor-supporting role of tenascin-C along with its high expression make tenascin-C a good therapeutic target, and several therapies targeting tenascin-C are being developed for clinical trials (11–14). One such example is a modified RNA aptamer (TTA1) that has entered clinical trials in Europe for tumor stromal tenascin-C expression (15,16).
Aptamers are short single-stranded oligonucleotides that display high affinity and selectivity for a given target. Aptamers contain unique features such as low immunogenicity, amenability to chemical modification and bioconjugation, and favorable pharmacokinetics, which include rapid blood clearance and tumor penetration (17,18). Aptamers are highly specific and selective to their targets and have superior target-to-noise ratios at early time points (19). We hypothesized that this characteristic of DNA aptamers is beneficial for imaging purposes, because any aptamer that does not bind to its target will be rapidly cleared.
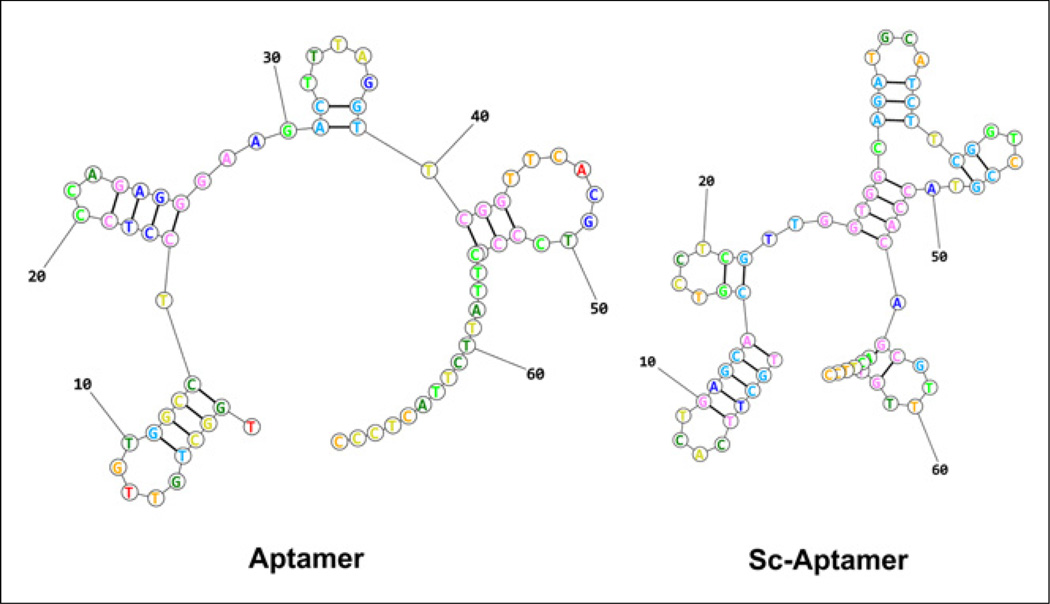
In this work, we radiolabeled a single-stranded DNA (ssDNA) aptamer, containing 70 nucleotides, that is identified by systematic evolution of ligands by exponential enrichment to target tenascin-C (20). Tenascin-C–specific aptamer (tenascin-C aptamer) was compared with a scrambled sequence aptamer (Sc aptamer) that was predicted to have a different secondary structure (Fig. 1) (21). The aptamer was labeled with 18F and 64Cu and evaluated for PET imaging of tumor tenascin-C expression.
FIGURE 1.
Prediction of aptamer secondary structures based on lowest free energy structure.
MATERIALS AND METHODS
General
S-2-(4-isothiocyanate benzyl)-1,4,7-triazacyclononane-1,4,7-triacetic acid (p-SCN-Bn-NOTA) was purchased from Macrocyclics. All other solvents and chemicals were purchased from Sigma-Aldrich. 18F-fluoride and 64Cu were obtained from the National Institutes of Health (NIH) Clinical Center cyclotron facility. Aptamers and fluorescein isothiocyanate (FITC) aptamers were purchased from Integrated DNA Technologies Inc. The tenascin-C aptamer sequence was 5AmMC6/TGGCTGTTGTGGCCTCCTCCCAGAGGGAAGACT-TTAGGTTCGGTTCACGTCCCGCTTATTCTTACTCCC, and the nonspecific Sc aptamer sequence was 5AmMC6/TGCTTCACTGAG-CACGTCCTCGTTGGTGGCAGATGCATCTTCGGTCCGTACCACAG CGTTTGTACTTCC. The secondary structure of each aptamer was calculated on the basis of the lowest free energy structure, using RNA structure web servers (21).
NAP-5 columns (GE Healthcare Life Sciences) were prewashed before use with 10 mL of water (18.2Ω; Millipore). The concentration of ssDNA aptamers was determined by measuring ultraviolet absorbance at 260 nm on a NanoDrop spectrophotometer (ND-1100; Grace Scientific). Radio–thin-layer chromatography (radio-TLC) was performed on an AR-2000 Bioscan scanner, using 2 systems: instant TLC plates (Agilent) and 0.1 M of citric acid as a developing solvent and reversed-phase C18 plates (KC18F, 6 nm [60 Å], 200 mm; Whatman) and 35% CH3CN:65% 0.1 M triethylamine acetate (pH 7) in water as a solvent. High-performance liquid chromatography (HPLC) was conducted on a system with a variable-wavelength detector operating at 260 nm and with a radioactivity detector containing a NaI crystal. A Phenomenex Luna C18 analytic column (5 µm, 4.6 × 250 mm) was used, and the flow was set at 1 mL/min using a slow gradient system, starting from 90% of solvent A (0.1 M triethylamine acetate in water) and 10% of solvent B (CH3CN) and changing to 70% solvent A and 30% solvent B at 35 min. The conjugation of aptamers with unlabeled N-succinimidyl 4-fluorobenzoate (SFB) and p-SCN-Bn-NOTA is described in the supplemental materials (available at http://jnm.snmjournals.org).
Mice were purchased from Harlan Laboratories. Female athymic nude mice were housed in an animal facility under pathogen-free conditions. In vivo studies were conducted under protocols approved by the NIH Clinical Center Animal Care and Use Committee and in accordance with the NIH Guide for the Care and Use of Laboratory Animals (22).
Radiochemistry
Radiosynthesis of 18F-Fluorobenzoyl (FB) Aptamer
The radiosynthesis of 18F-SFB was done as previously reported by us (23). 18F-SFB (1.48–2.22 GBq [40–60 mCi]) was redissolved in 20 µL of dimethylformamide. Aptamer (4–10 nmol) dissolved in 50 µL of water was added to the 18F-SFB tube, followed by 180 µL of Na2HPO4·7H2O (pH 8.5). The reaction was incubated at 37°C for 30 min. The formation of 18F-FB aptamer was monitored by HPLC. The crude solution of 18F-FB aptamer was loaded onto a NAP-5 column and eluted in 0.25-mL fractions of water. Fraction 4 was the most concentrated, containing 75%–80% of the DNA mass. Fraction 5 was the second most concentrated. Both fractions were used for the biologic studies. HPLC analysis of the 2 fractions showed a similar radiochemical purity of greater than 95%, with a retention time of 17.17 min for FB aptamer and 17.34 min for 18F-FB aptamer. The radiochemical yield of 18F-FB aptamer contained in fractions 4 and 5 was calculated on the basis of 18F-SFB conjugation and non–decay-corrected. The total synthetic procedure beginning with 18F-fluoride required about 2.5 h.
Radiosynthesis of 64Cu-NOTA Aptamer
64CuCl2 (10 µL) was added to 500 µL of 0.4 M ammonium acetate (pH 5.5) to obtain 64Cu-acetate solution. About 10 nmol of NOTA-conjugated aptamer in 20–30 µL of water were added to 100 µL of NH4OAc buffer. Then 370–444 MBq (10–12 mCi) of 64Cu-acetate (20 µL) were added to give a total volume of 150 µL. The reaction was stirred for 30 min at 37°C. Complexation of 64Cu with the conjugated aptamer was monitored by radio-TLC using system 1 (Rf for 64Cu-NOTA-tenascin-C aptamer = 0.1 and for free 64Cu = 0.9). The reaction was diluted with an additional 100 µL of water and loaded on a NAP-5 column. Labeled aptamer was eluted with water as described above. 64Cu-NOTA aptamers were achieved with a total radiosynthesis time of 50 min and a radiochemical purity greater than 95%.
Biology
64Cu-NOTA Aptamer Analysis In Vitro and In Vivo
Aptamers (1 µg/µL) were incubated in 100 µL of mouse serum (Sigma-Aldrich) or phosphate-buffered saline (PBS) for 1 h at 37°C. Serum has ultraviolet absorbance when loaded on agarose gel, hence the samples incubated in serum were diluted 1:1 in PBS, heated to 95°C for 5 min, and then centrifuged at 13,000g for 10 min. The supernatants and the samples in PBS were run on a 2.5% agarose gel (Fisher Scientific). Gel was imaged after staining with GelStar (Lonza) using a Fluorchem camera (α Innotech). 64Cu-NOTA aptamer (3.7–5.5 MBq [100–150 µCi]) was injected into each mouse. For blood analysis, at 30 min and 1 and 2 h after injection, the mice were sacrificed and blood was collected. Urine was collected at the same time points just before the mice were sacrificed. The collected whole blood was allowed to clot for 30–40 min at room temperature. The clot was removed by centrifuging at 3,500 rpm for 5 min to give the serum. An aliquot of each sample was loaded onto C-18 reversed-phase TLC plates using system 2. The plates were dried and exposed to a phosphor plate (Fuji) for visualization of radioactive bands. The plates were scanned using the Fuji BAS (510 version) scanner.
Cell Culture and Tumor Models
U87MG cells were grown in minimum essential medium (Invitrogen). H460 cells were grown in RPMI-1640 medium (Invitrogen). MDA-MB-435 cells were grown in L-15 medium (Invitrogen). All cell culture media were supplemented with 10% fetal bovine serum (Gibco), 1 mM sodium pyruvate, 2 mM l-glutamine, and nonessential amino acids (Gibco). All cells were grown at 37°C in a humidified atmosphere containing 5% CO2. Mice were inoculated subcutaneously with 5 × 10⁶ of either U87MG or H460 cells on the right shoulder. The MDA-MB-435 tumor model was generated by orthotopic injection of 5 × 10⁶ cells in the left mammary fat pad of each mouse. The tumors were allowed to develop for 3 wk before imaging studies. Tumor growth was monitored by caliper measurement.
Immunofluorescence Staining
Excised frozen tumor tissue slices (5 µm) were fixed with cold acetone for 20 min and air-dried for 30 min at room temperature. After being blocked with 2% bovine serum albumin for 30 min, the sections were incubated either with rat anti–tenascin-C (1:100; Abcam) for 1 h at room temperature and then visualized with dye-conjugated secondary antibodies (1:200; Jackson Immuno Research Laboratories) or with FITC-labeled tenascin-C aptamer (IDT). After being washed for 35 min with PBS, the whole slides were mounted with 4′,6-diamidino-2-phenylindole–containing mounting medium. Fluorescence images were acquired with an epifluorescence microscope (200×; Olympus, X81).
PET Studies
Tumor-bearing mice were anesthetized using isoflurane/O2 (1.5%–2% v/v) and injected with 2.96–3.7 MBq (80–100 µCi) of 18F-FB aptamer or 64Cu-NOTA aptamer, in a volume of 100 µL of PBS. PET scans were obtained using an Inveon DPET scanner (Siemens Medical Solutions) at 30 min and 1 and 2 h for 18F-FB aptamer and at 1, 2, 6, and 24 h for 64Cu-NOTA aptamer. PET images were reconstructed without correction for attenuation or scatter using a 3-dimensional ordered-subsets expectation maximization algorithm. ASI Pro VM software (Siemens) was used for image analysis. Regions of interest were drawn for each organ on the coronal images to calculate percentage injected dose per gram (%ID/g), assuming a density of 1 for all tissues.
Statistical Analysis
Results were presented as mean ± SD. Group comparisons were made using the Student t test for unpaired data. P values of less than 0.05 were considered statistically significant.
RESULTS
Synthesis and Labeling of Aptamers
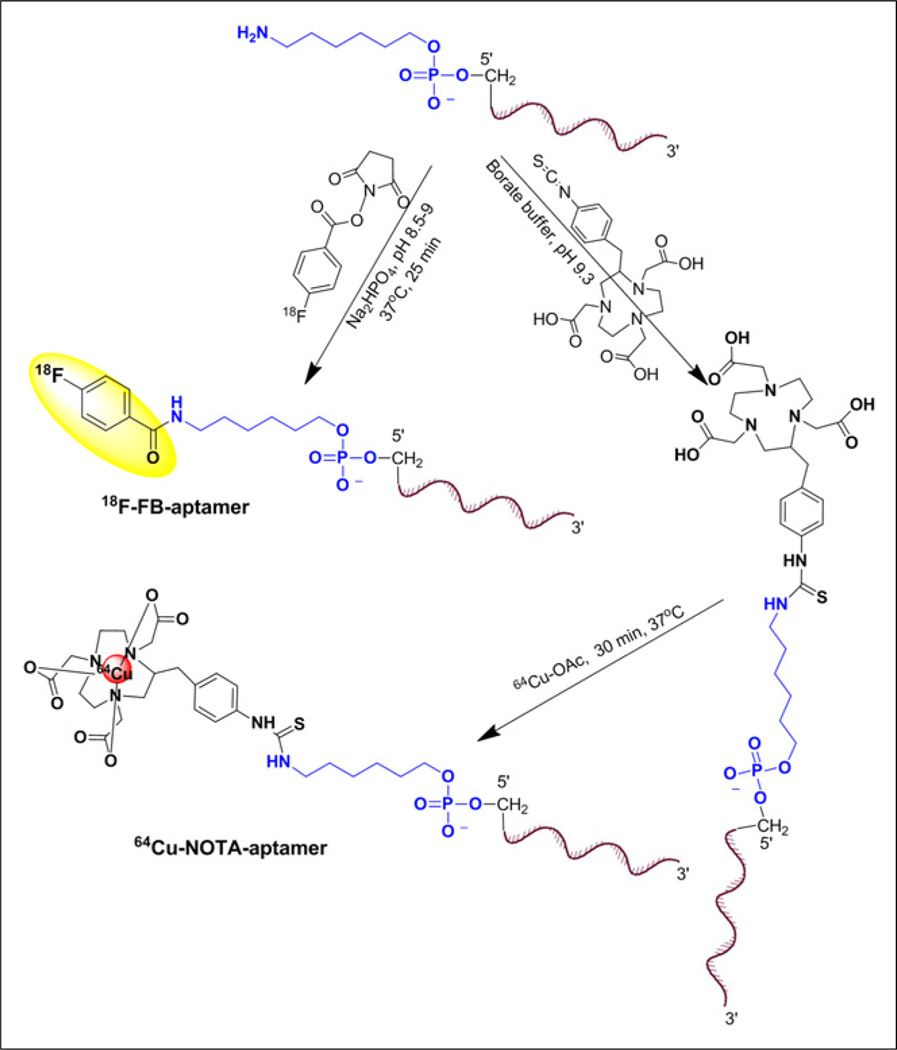
The aptamers, which have different folding structures based on minimal energy calculation (Fig. 1), were modified to have a 6-carbon chain and only 1 primary amine group at the 5′-position for conjugation purposes (Fig. 2). The conjugation of 18F-SFB to aptamer was conducted in basic sodium phosphate buffer (Fig. 2) and resulted in less than 2% conversion as detected by HPLC. The purification of 18F-FB aptamer was achieved using a NAP-5 column. Using this purification method, we obtained 18F-FB aptamer as a mixture with its nonlabeled form. The average radiochemical yield was 1.47% ± 0.16% (non–decay-corrected, n = 4), calculated from 18F-SFB, with a specific activity of 3.75–5.36 GBq/µmol (101.4–145 mCi/µmol). Similar to SFB conjugation, reaction of aptamer with p-SCN-Bn-NOTA resulted in a low conjugation yield, and most of the aptamer remained without chelator attached, as confirmed by liquid chromatography–mass spectrometric analysis. Labeling with 64Cu was more straightforward using 64Cu-acetate (Fig. 2) and resulted in higher radiochemical yields (32% ± 3%, non–decay-corrected, n = 4), calculated from the start of synthesis to the elution of the labeled aptamer from the NAP-5 column. The specific activities of 64Cu-NOTA aptamer were higher, with values ranging from 16.09 to 18.76 GBq/µmol (435–507.2 mCi/µmol).
FIGURE 2.
18F and 64Cu aptamer labeling routes.
Aptamer Stability In Vitro and In Vivo
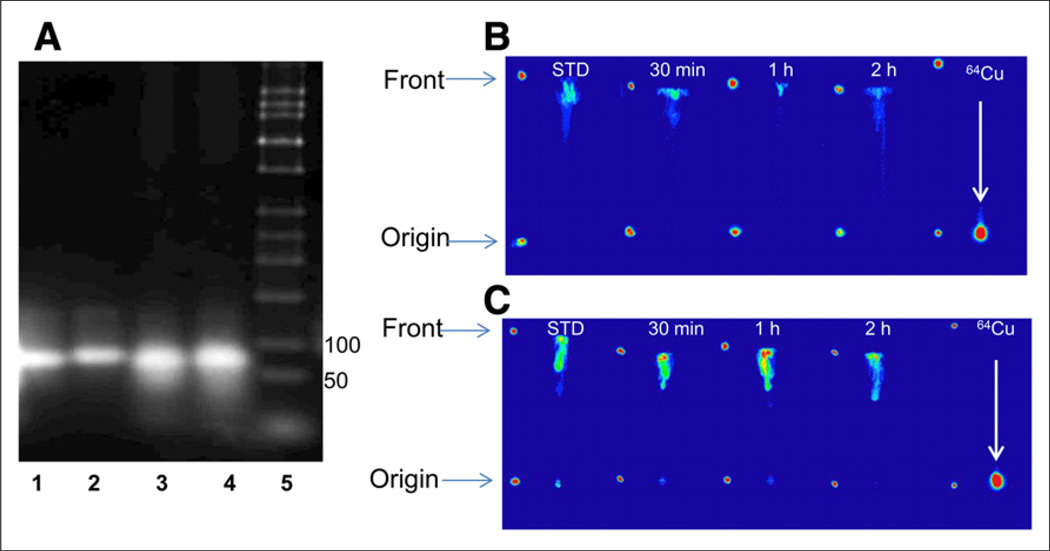
To evaluate the stability of the aptamers, they were incubated in mouse serum for 1 h at 37°C and thereafter loaded on agarose gel and compared with aptamers incubated in PBS. No significant degradation of the aptamers was observed (Fig. 3A). Possible demetallation of 64Cu-NOTA aptamers was first evaluated in vitro by incubation in PBS and then mouse serum for different time periods. A negligible amount of free copper was detected up to 24 h using radio-TLC (Supplemental Figs. 1 and 2). Demetallation of 64Cu-NOTA-tenascin-C aptamer was further evaluated in vivo in mouse blood and urine at several time points after intravenous injection (Figs. 3B and 3C). The blood and urine aliquots were compared against free 64Cu. The labeled aptamer had an Rf of 0.9, whereas free 64Cu stayed at the original spot (Figs. 3B and 3C). No free 64Cu was detected in the blood and urine at all the time points examined (Figs. 3B and 3C).
FIGURE 3.
(A) Representative agarose gel electrophoresis of tenascin-C aptamer in PBS (1) and postserum incubation (2), Sc aptamer in PBS (3), postserum incubation (4) and ladder (5). (B and C) Representative radio-TLC analysis (autoradiography detection) of 64Cu-NOTA-tenascin-C aptamer of extracts from blood (B) and urine (C) using TLC system 2. Rf for 64Cu-NOTA-tenascin-C aptamer was 0.9 and for free 64Cu it was 0.1 at 30 min and 1 and 2 h after injection of 64Cu-NOTA-tenascin-C aptamer into mice. Blood and urine aliquots were compared with free 64Cu solution loaded as reference (right).
Evaluation of Labeled Aptamer as Imaging Agent in Tumor Xenografts
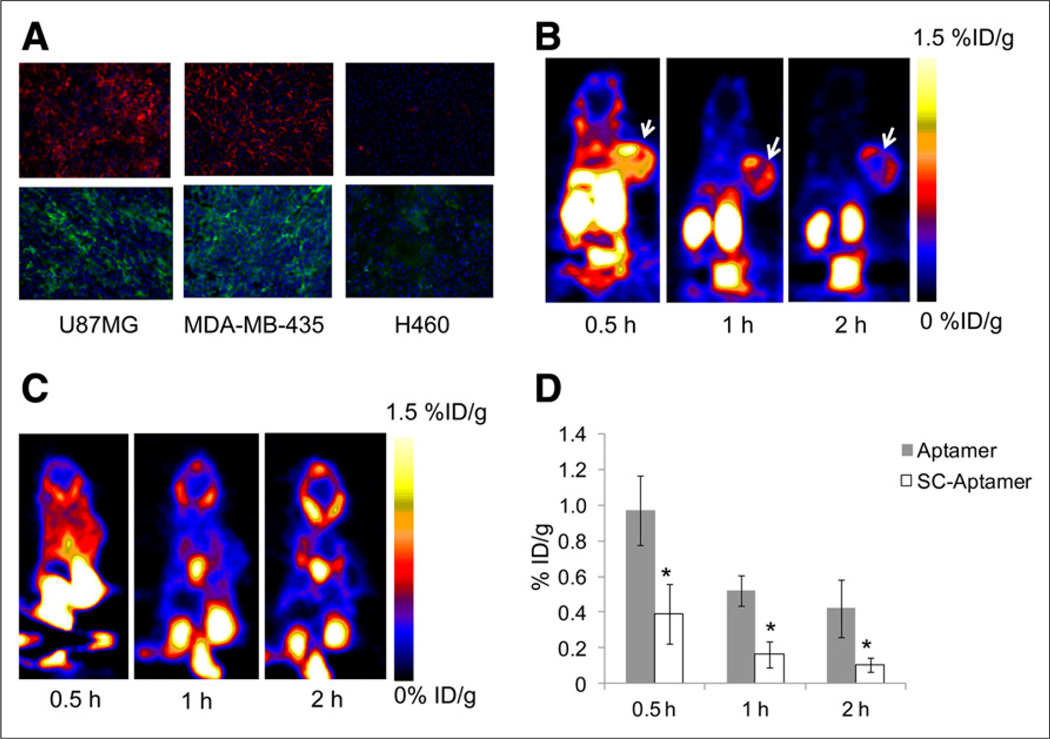
In vitro evaluation of tenascin-C expression by different tumor types was done by immunofluorescence staining of tumor sections. The sections were made from mouse xenografts, generated by subcutaneous injection of U87MG glioma cells and H460 lung cancer cells, and orthotopic injection of MDA-MB-435 breast cancer cells into the mammary gland. Staining with anti–tenascin-C antibody clearly showed that both U87MG and MDA-MB-435 tumors were positive and stained similarly for tenascin-C expression, whereas H460 tumor was negative. Additional staining was also done using FITC-labeled aptamer on frozen sections from the above-mentioned xenografts and showed results similar to those of the antibody (Fig. 4A).
FIGURE 4.
(A) Immunofluorescence staining of tenascin-C in frozen section slides of tenascin-C–positive xenografts U87MG and MDA-MB-435 and tenascin-C–negative xenograft H460 using anti–tenascin-C antibody (upper) and FITC-labeled tenascin-C aptamer (lower). Magnification, ×200. (B) Representative coronal PET images of mice bearing subcutaneous U87MG xenograft injected with 18F-FB-tenascin-C aptamer at indicated time points. White arrow indicates tumor. (C) Representative coronal PET images of mice bearing subcutaneous H460 xenograft injected with 18F-FB-tenascin-C aptamer at 30 min and 1 and 2 h after injection. White arrow indicates site of tumor. (D) Comparison between 18F-FB-tenascin-C aptamer and 18F-FB-Sc aptamer in tumor uptake at different time points (0.5, 1, and 2 h after injection) (n = 4/group). *Significance between aptamer and Sc aptamer tumor uptake.
The initial PET studies were performed with 18F-FB-tenascin-C aptamer using mice with U87MG (tenascin-C–positive) and H460 (tenascin-C–negative) tumors (Figs. 4B and 4C). 18F-FB-tenascin-C aptamer PET clearly visualized tenascin-C–positive tumors but not tenascin-C–negative tumors (Figs. 4B and 4C). At 30 min after injection, 18F-FB-tenascin-C aptamer had modest accumulation (0.97 ± 0.19 %ID/g, Table 1) in the positive tumor, with low tumor-to-blood (T/B) ratio (0.83 ± 0.23, Table 2) and moderate tumor-to-muscle (T/M) ratio (3.94 ± 1.43, Table 2). In addition, at 30 min after injection, 18F-FB-tenascin-C aptamer showed a high accumulation in the kidneys (49 ± 33.3 %ID/g, Table 1), moderate uptake in the liver (4.5 ± 0.87 %ID/g), and some uptake in the gallbladder (1.5 ± 0.46 %ID/g) and the blood (1.2 ± 0.24 %ID/g). At 1 h after injection, the uptake in the kidneys decreased to 3.84 ± 0.49 %ID/g along with further reduced uptake in the liver, gallbladder, and blood (Table 1), resulting in higher imaging contrast and T/B ratio (2.06 ± 0.03; Fig. 4B; Table 2). The uptake in these organs continued to decrease over time and at 2 h after injection was less than 50% of the initial uptake (Table 1). 18F-FB-tenascin-C aptamer uptake in the positive tumor decreased to 0.52 ± 0.1 %ID/g at 1 h after injection, which may be due to the clearance of the radiolabeled aptamer or its possible metabolites from the blood, and remained almost the same at the 2-h time point, at which the T/B and T/M ratios increased slightly (4.40 ± 0.81 and 5.17 ± 0.93, respectively, Table 2). The comparison of tumor uptake between 18F-FB-tenascin-C aptamer and 18F-FB-Sc aptamer showed significant differences at all the time points examined, with 18F-FB-tenascin-C aptamer having a much higher tumor uptake than 18F-FB-Sc aptamer (Fig. 4D). To verify the uptake in various organs and the specificity of the aptamer, biodistribution and blocking studies were performed. Biodistribution results correlated with PET images and showed uptake in the liver, kidneys, and tumor (Supplemental Fig. 3). No significant uptake was found in the long bones, suggesting that no defluorination occurred. Blocking studies with a 100-fold excess of specific aptamer eliminated the accumulation of the labeled aptamer in the tumor. These experiments also showed a more rapid clearance of the activity from the metabolic organs.
TABLE 1.
Biodistribution of 18F-FB-Tenascin-C Aptamer at 0.5, 1, and 2 Hours After Injection (%ID/g, n = 4)
| Organ | 0.5 h | 1 h | 2 h |
|---|---|---|---|
| Gallbladder | 1.53 ± 0.46 | 2.08 ± 0.85 | 1.17 ± 0.24 |
| Liver | 4.54 ± 0.87 | 0.62 ± 0.06 | 0.21 ± 0.04 |
| Kidneys | 48.98 ± 33.29 | 3.84 ± 0.48 | 1.12 ± 0.47 |
| Tumor | 0.97 ± 0.19 | 0.52 ± 0.08 | 0.42 ± 0.16 |
| Muscle | 0.31 ± 0.04 | 0.19 ± 0.01 | 0.08 ± 0.04 |
| Blood | 1.20 ± 0.24 | 0.3 ± 0.05 | 0.07 ± 0.01 |
TABLE 2.
T/B and T/M Ratios of 18F-FB-Tenascin-C Aptamer Over Time (n = 4)
| Ratio | 0.5 h | 1 h | 2 h |
|---|---|---|---|
| T/B | 0.83 ± 0.23 | 2.06 ± 0.03 | 4.40 ± 0.81 |
| T/M | 3.94 ± 1.43 | 3.05 ± 0.27 | 5.16 ± 0.93 |
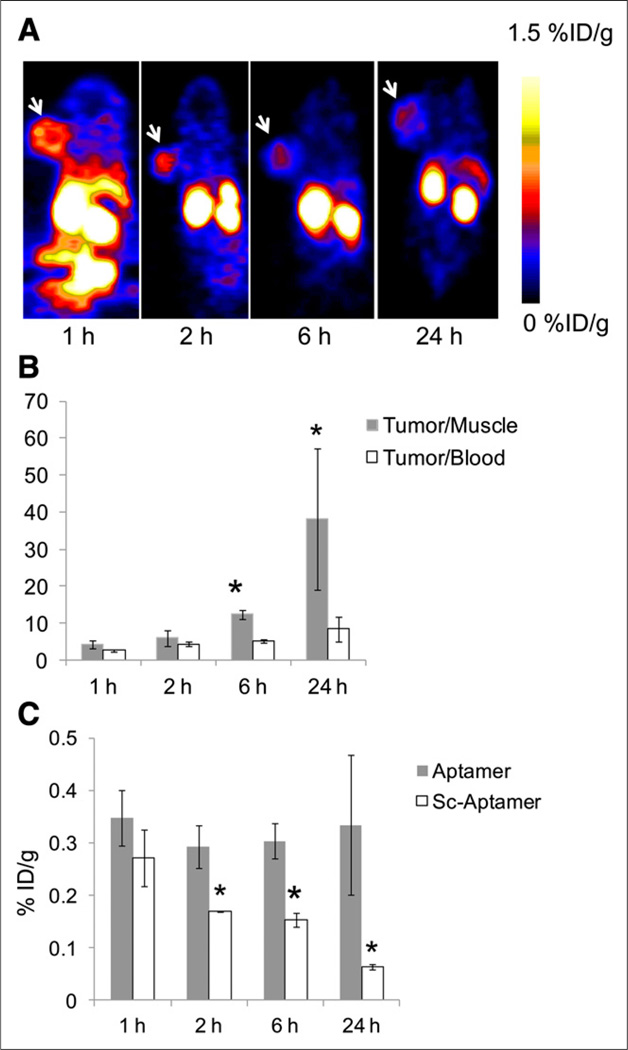
To image at later time points and increase the T/B and T/M ratios, tenascin-C aptamer and Sc aptamer were labeled with 64Cu, which has a half-life of 12.7 h. Similarly to 18F, 64Cu-NOTA-tenascin-C aptamer clearly visualized tenascin-C–positive U87MG tumors at all time points, up to 24 h after injection (Fig. 5A). T/M ratios increased significantly at 6 and 24 h after injection (Fig. 5B). T/B ratios were also elevated at later time points but not as drastically as the T/M ratios (Fig. 5B). Similarly to 18F-FB-tenascin-C aptamer, 64Cu-NOTA-tenascin-C aptamer had low accumulation in nonspecific organs, such as the kidneys and liver, at 1 h after injection (Supplemental Fig. 4). 64Cu-NOTA-Sc aptamer showed relatively faster clearance from the tumor and nonspecific specific organs than 64Cu-NOTA-tenascin-C aptamer (Fig. 5C; Supplemental Fig. 4).
FIGURE 5.
(A) Representative coronal PET images of mice at 1, 2, 6, and 24 h after injection of 64Cu-NOTA-tenascin-C aptamer. White arrow indicates tumor. (B) T/M and T/B ratios of 64Cu-NOTA-tenascin-C aptamer over time. Results are presented as average of 5 mice ± SD. *Significance between 6 and 24 h and 1 and 2 h. (C) Comparison of tumor uptake between 64Cu-NOTA-tenascin-C aptamer and 64Cu-NOTA-Sc aptamer (n = 5/group). *Significance between aptamer and Sc aptamer tumor uptake.
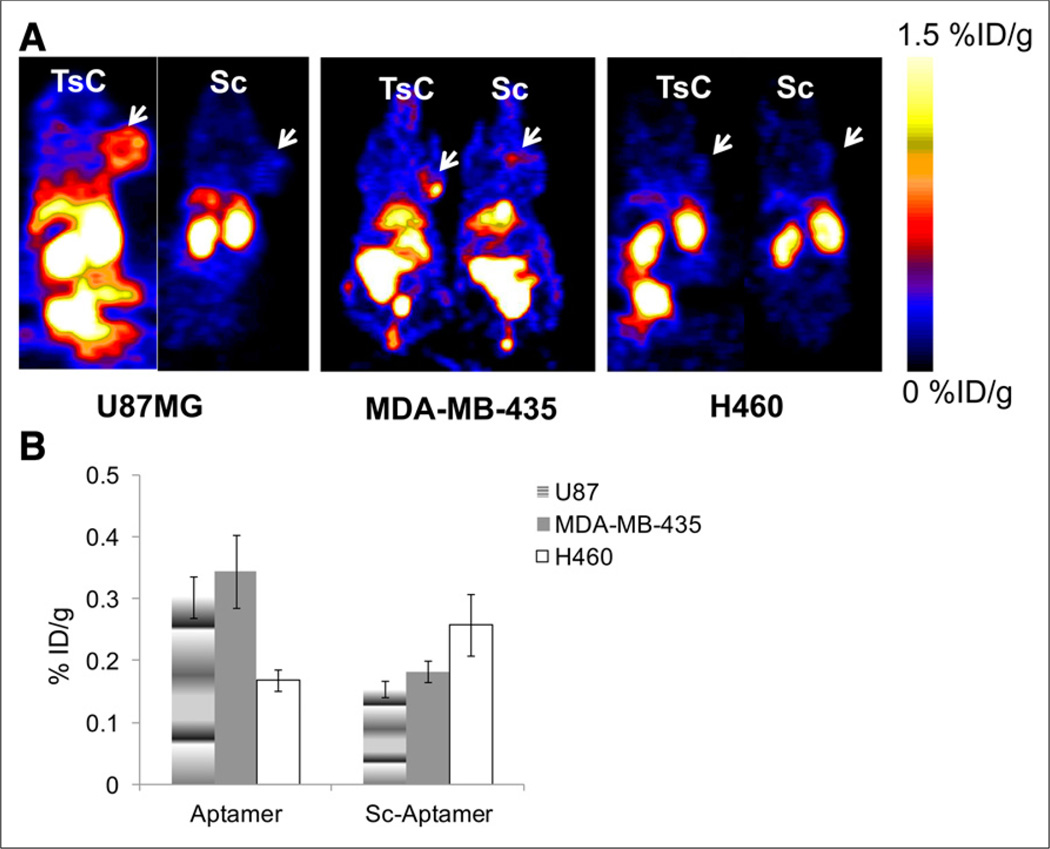
Further comparison between 64Cu-NOTA-tenascin-C aptamer and 64Cu-NOTA-Sc aptamer was done in tenascin-C–positive tumor (MDA-MB-435) and tenascin-C–negative tumor (H460, Figs. 6A and 6B). Although 64Cu-NOTA-Sc aptamer had similar uptake between tenascin-C–positive and –negative tumors (Fig. 6B), 64Cu-NOTA-tenascin-C aptamer had significantly higher uptake in tenascin-C–positive models than 64Cu-NOTA-Sc aptamer (Figs. 6A and 6B).
FIGURE 6.
(A) Representative coronal PET images of 64Cu-NOTA-tenascin-C aptamer and 64Cu-NOTA-Sc aptamer in different tumor models (tenascin-C–positive [U87MG and MDA-MB-435] and tenascin-C–negative [H460]) at 6 h after injection. White arrows represent tumor location. (B) Quantified results of tumor uptake of both tracers, calculated from PET images at 6 h after injection (n = 5/group). TsC = tenascin-C.
DISCUSSION
The extracellular matrix protein tenascin-C is transiently expressed in pathologies such as tissue injury and inflammation; however, in the tumor microenvironment tenascin-C is constantly expressed (6,7). The role of tenascin-C seems to be somewhat different with dependence on tumor type, perhaps because of its ability to bind and interact with multiple cytokines, integrins, and growth factors (5,8). Tenascin-C is expressed and secreted by stroma in most solid tumors, and it plays a role in multiple oncogenesis pathways including invasion, angiogenesis, enhancement of proliferation, and metastasis formation (6).
Few attempts to image tumor tenascin-C expression have been reported (16,24). Heuveling et al. described a phase 0 clinical trial of anti–tenascin-C minibody, labeled with 124I (24). At 30 min after injection, the tumor was detected only in 1 patient of 4. In addition, at 24 h after injection the amount of radioactivity in the blood pool (4–5 %ID/g) was similar to the amount in the tumor and resulted in low tumor-to-background signal (24). Another study described in vivo evaluation of an RNA aptamer (TTA1) labeled with SPECT isotope 99mTc (16). The tumor-to-background signal was low at early time points but significantly improved by 18 h after injection, a time point at which there was clear visualization of the tenascin-C–positive tumor (16). However, at that time point, the absolute uptake in the tumor was about 1 %ID/g, similar to that of 18F-FB-tenascin-C aptamer at 30 min after injection. Unfortunately, SPECT does not allow quantification of protein levels and gives only qualitative results. Together with the relatively low accumulation of the tracer in the tumor tissue, it might prove insufficient for differentiating tenascin-C–positive from tenascin-C–negative tumors in human patients.
In this study, we applied direct labeling of tenascin-C DNA aptamer with PET isotopes 18F and 64Cu. The conjugation to 18F-SFB prosthetic group or to NOTA chelator resulted in a low but usable yield. We hypothesized that the 3-dimensional structure of aptamers might have created steric interference for the single primary amine, and therefore the amine was not reactive enough for conjugation. Shortening the length of the aptamer for future labeling and imaging application may be essential. It has been recently shown that free 64Cu accumulates in xenograft tumors (25). We addressed this issue by labeling the aptamer with 64Cu and validating that there is no free copper in the blood and urine. Moreover, similar behavior of tenascin-C aptamer labeled with either 18F or 64Cu confirms negligible transchelation of 64Cu-labeled NOTA aptamer conjugate.
FITC-labeled tenascin-C aptamer was compared with an anti–tenascin-C antibody in vitro using tumor sections and showed similar staining (Fig. 4A). In vivo PET imaging studies showed that labeled tenascin-C aptamer can clearly visualize tenascin-C–positive but not –negative tumors (Fig. 6A). It seems that tenascin-C aptamer does not accumulate in the tumor after initial binding, probably because of its rapid clearance, hence labeling with short-half-lived isotopes such as 18F is sufficient for PET imaging application. The rapid clearance of the DNA tenascin-C aptamer can be one of the reasons that the absolute uptake of the aptamer in the tumor is relatively low. On the other hand, rapid clearance also makes the aptamer less probable to undergo degradation in vivo by DNase. Another possible reason for relatively low tumor uptake is that the target is extracellular and the probe is not internalized or trapped inside cells. Similarly, 64Cu cannot be trapped inside the cells by transchelation. The comparable tumor uptake of the aptamer labeled with either 18F or 64Cu supports this reasoning.
Another advantage of tenascin-C aptamer is its low accumulation in nonspecific organs (i.e., liver and kidneys) as early as 1 h after injection, leading to high tumor-to-background ratios. Of special importance is the liver, which is a target of many types of metastases and has relatively high nonspecific accumulation of different PET tracers (26,27). Tenascin-C aptamer has almost no accumulation in the liver, which makes it useful for imaging liver metastases. Relatively high accumulation of the tracer in the kidneys at early time points might be related to the negatively charged phosphodiester groups of the oligonucleotide.
CONCLUSION
Aptamers seem to be a promising platform for developing PET imaging agents. Tenascin-C aptamer, labeled with 18F or 64Cu, demonstrated appropriate properties of tumor contrast that suggest utility for clinical evaluation of tenascin-C expression. Nevertheless, 18F labeling requires better yield for clinical translation. The knowledge of tenascin-C expression may help clinicians select and monitor appropriate therapies, including future anti–tenascin-C therapies.
Supplementary Material
Acknowledgments
The costs of publication of this article were defrayed in part by the payment of page charges. Therefore, and solely to indicate this fact, this article is hereby marked “advertisement” in accordance with 18 USC section 1734. This work was supported by an intramural research program of the National Institute of Biomedical Imaging and Bioengineering (NIBIB), National Institutes of Health (NIH), National Basic Research Program of China (2014CB744503, 2013CB733802, 2015CB931800, and 2015CB931803); National Natural Science Foundation of China (81371596, 81130028, and 31210103913); Key Grant Project of Heilongjiang Province (GA12C302); PhD Programs Foundation of Ministry of Education of China (201123071100203); and the Key Laboratory of Molecular Imaging Foundation (College of Heilongjiang Province).
Footnotes
DISCLOSURE
No other potential conflict of interest relevant to this article was reported.
REFERENCES
- 1.Chiquet-Ehrismann R, Mackie EJ, Pearson CA, Sakakura T. Tenascin: an extracellular matrix protein involved in tissue interactions during fetal development and oncogenesis. Cell. 1986;47:131–139. doi: 10.1016/0092-8674(86)90374-0. [DOI] [PubMed] [Google Scholar]
- 2.Chiquet-Ehrismann R, Chiquet M. Tenascins: regulation and putative functions during pathological stress. J Pathol. 2003;200:488–499. doi: 10.1002/path.1415. [DOI] [PubMed] [Google Scholar]
- 3.Tanaka R, Seki Y, Saito Y, et al. Tenascin-C-derived peptide TNIIIA2 highly enhances cell survival and PDGF-dependent cell proliferation through potentiated and sustained activation of integrin α5β1. J Biol Chem. 2014;289:17699–17708. doi: 10.1074/jbc.M113.546622. [DOI] [PMC free article] [PubMed] [Google Scholar]
- 4.Tastekin D, Tas F, Karabulut S, et al. Clinical significance of serum tenascin-C levels in breast cancer. Tumour Biol. 2014;35:6619–6625. doi: 10.1007/s13277-014-1875-3. [DOI] [PubMed] [Google Scholar]
- 5.Midwood KS, Hussenet T, Langlois B, Orend G. Advances in tenascin-C biology. Cell Mol Life Sci. 2011;68:3175–3199. doi: 10.1007/s00018-011-0783-6. [DOI] [PMC free article] [PubMed] [Google Scholar]
- 6.Midwood KS, Orend G. The role of tenascin-C in tissue injury and tumorigenesis. J Cell Commun Signal. 2009;3:287–310. doi: 10.1007/s12079-009-0075-1. [DOI] [PMC free article] [PubMed] [Google Scholar]
- 7.Oskarsson T, Acharyya S, Zhang XH, et al. Breast cancer cells produce tenascin C as a metastatic niche component to colonize the lungs. Nat Med. 2011;17:867–874. doi: 10.1038/nm.2379. [DOI] [PMC free article] [PubMed] [Google Scholar]
- 8.Orend G, Chiquet-Ehrismann R. Tenascin-C induced signaling in cancer. Cancer Lett. 2006;244:143–163. doi: 10.1016/j.canlet.2006.02.017. [DOI] [PubMed] [Google Scholar]
- 9.Leins A, Riva P, Lindstedt R, Davidoff MS, Mehraein P, Weis S. Expression of tenascin-C in various human brain tumors and its relevance for survival in patients with astrocytoma. Cancer. 2003;98:2430–2439. doi: 10.1002/cncr.11796. [DOI] [PubMed] [Google Scholar]
- 10.Orend G. Potential oncogenic action of tenascin-C in tumorigenesis. Int J Biochem Cell Biol. 2005;37:1066–1083. doi: 10.1016/j.biocel.2004.12.002. [DOI] [PubMed] [Google Scholar]
- 11.Rolle K, Nowak S, Wyszko E, et al. Promising human brain tumors therapy with interference RNA intervention (iRNAi) Cancer Biol Ther. 2010;9:396–406. doi: 10.4161/cbt.9.5.10958. [DOI] [PubMed] [Google Scholar]
- 12.Zalutsky MR, Reardon DA, Akabani G, et al. Clinical experience with alpha-particle emitting 211At: treatment of recurrent brain tumor patients with 211At-labeled chimeric antitenascin monoclonal antibody 81C6. J Nucl Med. 2008;49:30–38. doi: 10.2967/jnumed.107.046938. [DOI] [PMC free article] [PubMed] [Google Scholar]
- 13.Reardon DA, Zalutsky MR, Akabani G, et al. A pilot study: 131I-antitenascin monoclonal antibody 81C6 to deliver a 44-Gy resection cavity boost. Neurooncol. 2008;10:182–189. doi: 10.1215/15228517-2007-053. [DOI] [PMC free article] [PubMed] [Google Scholar]
- 14.Aloj L, D’Ambrosio L, Aurilio M, et al. Radioimmunotherapy with Tenarad, a 131I-labelled antibody fragment targeting the extra-domain A1 of tenascin-C, in patients with refractory Hodgkin’s lymphoma. Eur J Nucl Med Mol Imaging. 2014;41:867–877. doi: 10.1007/s00259-013-2658-6. [DOI] [PubMed] [Google Scholar]
- 15.Schmidt KS, Borkowski S, Kurreck J, et al. Application of locked nucleic acids to improve aptamer in vivo stability and targeting function. Nucleic Acids Res. 2004;32:5757–5765. doi: 10.1093/nar/gkh862. [DOI] [PMC free article] [PubMed] [Google Scholar]
- 16.Hicke BJ, Stephens AW, Gould T, et al. Tumor targeting by an aptamer. J Nucl Med. 2006;47:668–678. [PubMed] [Google Scholar]
- 17.Ni X, Castanares M, Mukherjee A, Lupold SE. Nucleic acid aptamers: clinical applications and promising new horizons. Curr Med Chem. 2011;18:4206–4214. doi: 10.2174/092986711797189600. [DOI] [PMC free article] [PubMed] [Google Scholar]
- 18.Tan W, Donovan MJ, Jiang J. Aptamers from cell-based selection for bioanalytical applications. Chem Rev. 2013;113:2842–2862. doi: 10.1021/cr300468w. [DOI] [PMC free article] [PubMed] [Google Scholar]
- 19.Huang YF, Shangguan D, Liu H, et al. Molecular assembly of an aptamer-drug conjugate for targeted drug delivery to tumor cells. ChemBioChem. 2009;10:862–868. doi: 10.1002/cbic.200800805. [DOI] [PMC free article] [PubMed] [Google Scholar]
- 20.Daniels DA, Chen H, Hicke BJ, Swiderek KM, Gold L. A tenascin-C aptamer identified by tumor cell SELEX: systematic evolution of ligands by exponential enrichment. Proc Natl Acad Sci USA. 2003;100:15416–15421. doi: 10.1073/pnas.2136683100. [DOI] [PMC free article] [PubMed] [Google Scholar]
- 21.Reuter JS, Mathews DH. RNA structure: software for RNA secondary structure prediction and analysis. BMC Bioinformatics. 2010;11:129–138. doi: 10.1186/1471-2105-11-129. [DOI] [PMC free article] [PubMed] [Google Scholar]
- 22.Guide for the Care and Use of Laboratory Animals. Washington, DC: National Academy Press; 1996. [Google Scholar]
- 23.Jacobson O, Weiss ID, Kiesewetter DO, Farber JM, Chen X. PET of tumor CXCR4 expression with 4-18F-T140. J Nucl Med. 2010;51:1796–1804. doi: 10.2967/jnumed.110.079418. [DOI] [PMC free article] [PubMed] [Google Scholar]
- 24.Heuveling DA, de Bree R, Vugts DJ, et al. Phase 0 microdosing PET study using the human mini antibody F16SIP in head and neck cancer patients. J Nucl Med. 2013;54:397–401. doi: 10.2967/jnumed.112.111310. [DOI] [PubMed] [Google Scholar]
- 25.Kim KI, Jang SJ, Park JH, et al. Detection of increased 64Cu uptake by human copper transporter 1 gene overexpression using PET with 64CuCl2 in human breast cancer xenograft model. J Nucl Med. 2014;55:1692–1698. doi: 10.2967/jnumed.114.141127. [DOI] [PubMed] [Google Scholar]
- 26.Muralidharan V, Nguyen L, Banting J, Christophi C. The prognostic significance of lymphatics in colorectal liver metastases. HPB Surg. 2014;2014:954604. doi: 10.1155/2014/954604. [DOI] [PMC free article] [PubMed] [Google Scholar]
- 27.Akgül Ö, Cetinkaya E, Ersoz S, Tez M. Role of surgery in colorectal cancer liver metastases. World J Gastroenterol. 2014;20:6113–6122. doi: 10.3748/wjg.v20.i20.6113. [DOI] [PMC free article] [PubMed] [Google Scholar]
Associated Data
This section collects any data citations, data availability statements, or supplementary materials included in this article.


