Abstract
We report the investigation of the self-assembly mechanism of nanofibers, using a small peptide amphiphile (NapFFKYp) as a model. Combining experimental and simulation methods, we identify the self-assembly pathways in the solution and on the substrates, respectively. In the solution, peptide amphiphiles undergo the nucleation process to grow into nanofibers. The nanofibers can further twist into high-ordered nanofibers with aging. On the substrates, peptide amphiphiles form nanofibers and nanosheet structures simultaneously. This surface-induced nanosheet consists of rod-like structures, and its thickness is substrate-dependent. Most intriguingly, water can transform the nanosheet into the nanofiber. Molecular dynamic simulation suggests that hydrophobic and ion–ion interactions are dominant forces during the self-assembly process.
Introduction
Protein assemblies naturally exist and play important roles in living organisms.1,2 For instance, amyloid fibrils, an aggregation of a small number of proteins, with filament assemblies constituting the end-point of protein aggregation, have been recognized as the main cause of progressive human neurodegenerative diseases, such as Alzheimer’s disease (AD)3–5 and Parkinson’s disease (PD).6–8 Common nanofibers, actin filaments and microtubules constitute a cellular cytoskeleton which is related to the cell cycle, cell movement, intracellular traffic and membrane deformation, and are among the most important cancer therapy targets.9–11 Inspired by these natural nanofibers, self-assemblies of various peptide have been designed for wide applications.12,13 For example, peptide hydrogels are fibrous network structures, which are specially suitable for biological applications such as drug delivery and tissue engineering due to the high water content and biocompatibility.14–16 Therefore, fundamental understanding of the self-assembly mechanism may be helpful to understand diseases and design nanoscale materials.
The self-assembly process of peptide nanofibers not only involves various driving forces (e.g., hydrophobic interactions, electrostatic force, hydrogen bonding, π–π interactions, van der Waals force, etc.),17,18 but also can be affected by different conditions such as pH, ionic strength, and assembling rate.19–21 Besides, multiple nanostructures such as twisted ribbons, helical ribbons, and nanotubes can coexist and transform with time.22,23 Molecular dynamics simulations have been utilized to investigate the effects of complex conditions at the nanoscale.24–26 However, experimental methods encounter different limitations for clarifying the self-assembly mechanism within the current instrumentations. For example, fluorescence- based microscopy can provide the dynamic process of self-assembly, but lacks high resolution to resolve nanostructures under 10 nm.27,28 High-resolution imaging techniques such as transmission electron microscopy (TEM) and atomic force microscopy (AFM) have been used to study the self-assembly of nanostructures.3–5,8 However, the samples must be supported by certain substrates in these techniques, and recent studies indicate that the surface effect is rather influential during the self-assembly process.29,30 The morphologies of nanostructures can be affected by the local surface concentration, and different drying methods can also induce different morphologies and growth rates.31 There is evidently an urgent demand for a systematic approach to distinguish self-assembly pathways in the solution and on the substrates.
This work aims to understand the fundamental self-assembly mechanism of nanofibers from peptide amphiphiles using a small peptide amphiphile (Nap-Phe-Phe-Lys-pTyr, NapFFKYp) as a model.32,33 We revealed specific differences in the formation mechanisms of nanofibers in solutions and on different substrates. By combining experimental and molecular dynamics simulation methods, we carefully investigated the self-assembly pathways in broader conditions that encompass those of tissue/tumors for anticancer theranostics.
Results and discussion
Concentration effect on nanofiber growth
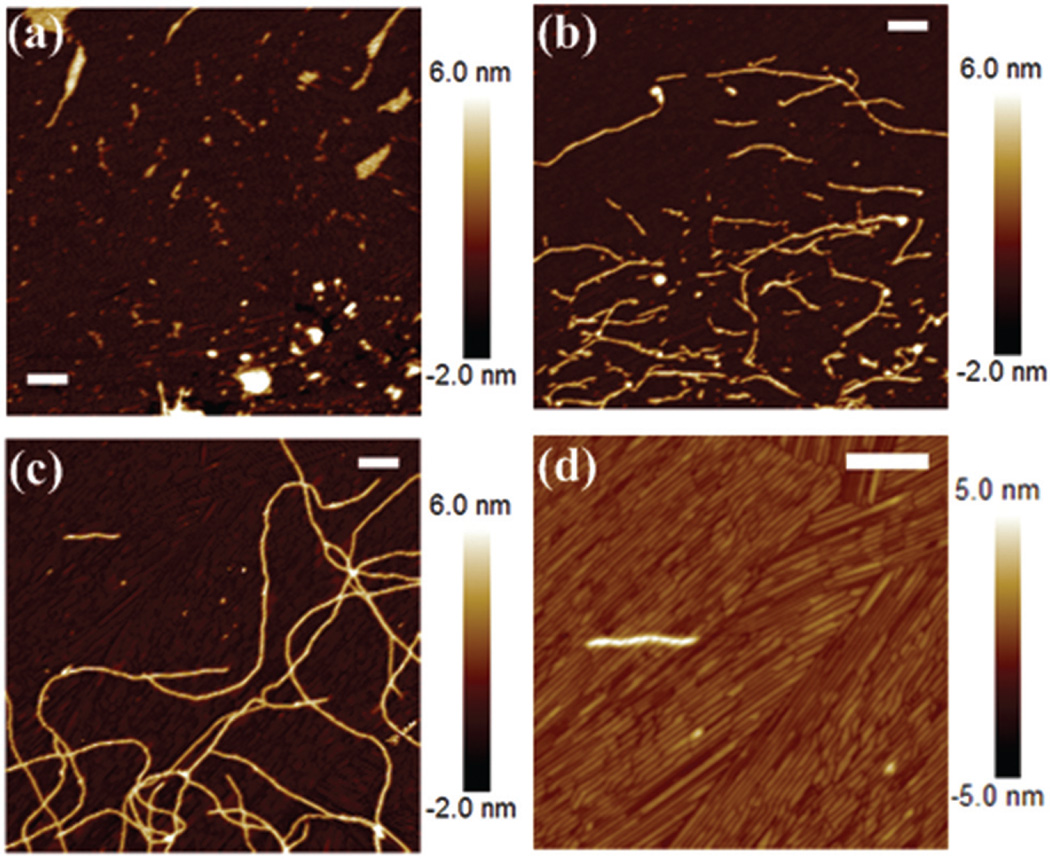
By adding alkaline phosphatase (ALP), the tyrosine phosphate ester of peptide amphiphile (NapFFKYp) was cleaved through the dephosphorylation reaction. The hydrogelators with different concentrations were incubated for another 30 min to self-assemble into nanofibers. Fig. 1(a), (b), and (c) show the AFM images at different peptide concentrations of 0.1, 0.5, and 1 mg mL−1, respectively. From low to high concentrations of the peptide amphiphile, there is a clear trend from the initial aggregate to the long nanofiber network. At a low concentration of 0.1 mg mL−1, peptides aggregated into small particles and assembled into short nanofibers of 4 nm height (Fig. 1(a)). Then, the nanofibers further grew at a higher concentration of 0.5 mg mL−1, and their lengths were mostly less than 1 µm (Fig. 1(b)). At the highest concentration of 1 mg mL−1, much longer nanofibers were observed, and associated into a fiber network (Fig. 1(c)). As a result, high concentration accelerated the growth rate of the nanofiber. Interestingly, at the highest concentration, we also found abundant rod-like structures (Fig. 1(d)), which aligned into nanosheet structures. This suggests that all the hydrogelators will be involved in the formation of nanofibers at low concentrations, while an excess amount of hydrogelators will form the nanosheet on the surface of mica at high concentration. These results show that multiple conformations can exist simultaneously, and different pathways may be involved in the whole self-assembly pathway.
Fig. 1.
AFM images of peptide amphiphile (NapFFKYp) assemblies on mica at different concentrations of (a) 0.1, (b) 0.5, and (c and d) 1 mg mL−1. Scale bar: 200 nm.
Substrate effect on the nanosheet structure
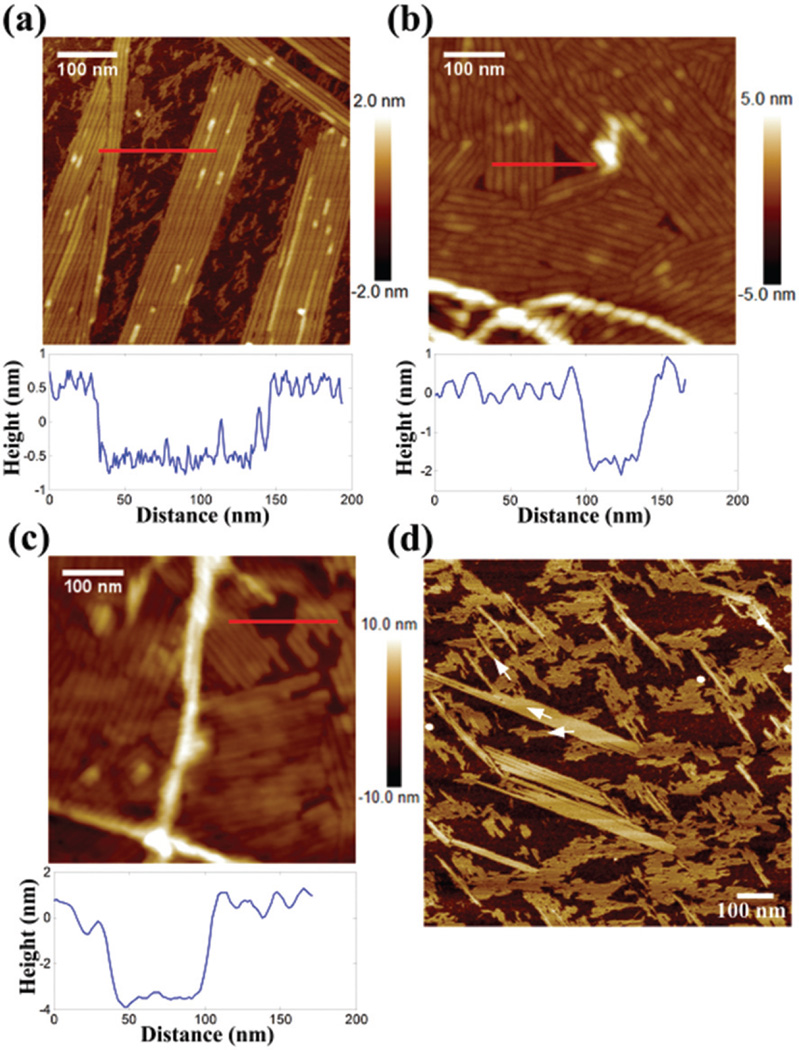
To clarify whether the presence of nanosheets is only induced on the hydrophilic mica surface, hydrogelators (1 mg mL−1) were also observed on different substrates. Fig. 2(a), (b), and (c) show nanosheets on the mica, highly oriented pyrolytic graphite (HOPG), and polystyrene (PS) film, respectively. The thickness of the nanosheets varied with the substrates as shown in the profiles indicated by the red lines. On the mica surface, the nanosheet had a thickness of 1 nm. The thickness of the nanosheets on HOPG and PS films was about 2 and 4 nm, respectively. The thickness difference may be due to the different local concentrations on the different surfaces. When a hydrogelator droplet is put on the extremely hydrophilic mica, the droplet will spread over the surface and cause a low local concentration per unit area. However, the droplet can remain as a dome shape on the HOPG and PS-film.34–36 It is no surprise that the higher local concentration could generate multi-layer nanosheets or thicker rod-like structures. Additionally, we found that the nanosheet tends to grow along certain orientations. As shown in Fig. 2(d), the nanosheets assembled in three different directions on the mica. The angular differences between each direction are multiples of ~30°, which may contribute to the lattice structure of mica. These results suggest that both the high concentration of hydrogelators and surface support favor the nanosheet formation.
Fig. 2.
AFM images and profiles of nanosheets on (a and d) mica, (b) HOPG, and (c) PS film. The white arrows in (d) indicate the growth directions of the nanosheet.
Water effect on the nanosheet structure
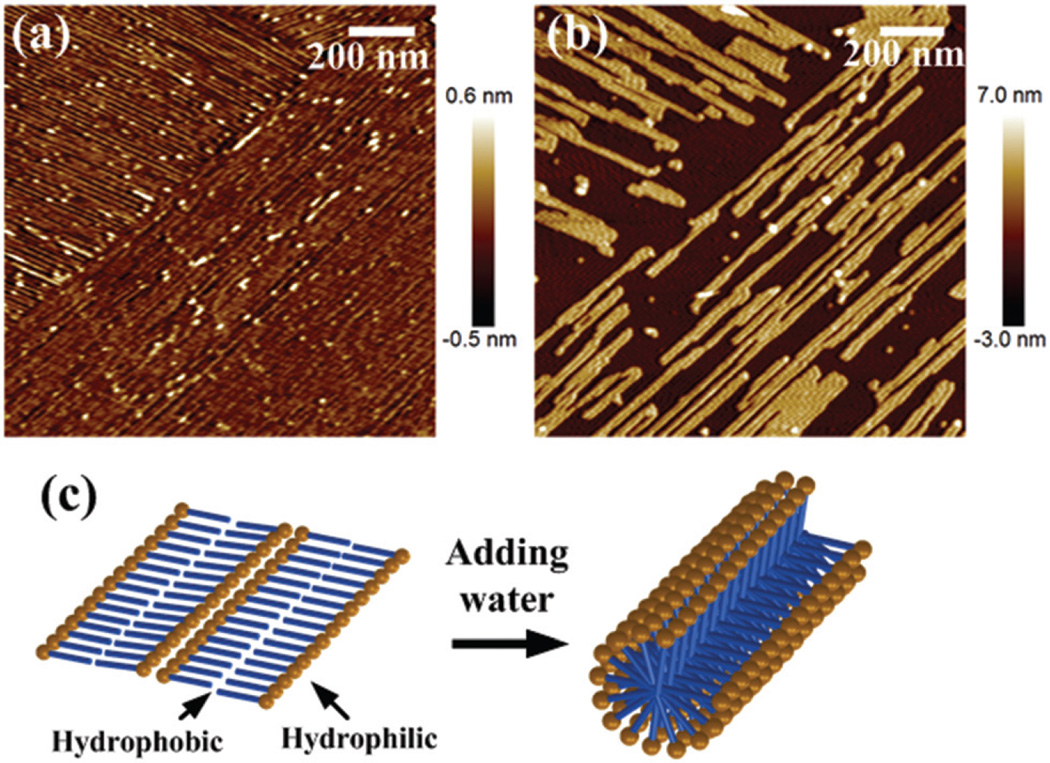
To explore the effect of water on nanosheet formation, we performed another experiment to show that the nanosheets are intermediate products enhanced by the substrate support effect. First, the nanosheet structure on the mica was imaged (Fig. 3(a)). Then, a drop of pure water was added on the nanosheets and the same area was imaged after the surface was dried in air again. As shown in Fig. 3(b), this process transformed the nanosheet into a thicker nanofiber structure of 4 nm height. The orientations of the nanofibers remained the same as the row-like structures. This phenomenon could be explained by the amphiphilic peptide structure, which consists of both hydrophilic and hydrophobic ends. As illustrated in Fig. 3(c), amphiphilic peptides can form highly ordered β-sheet layers on the mica surface.37–39 When water is added, the hydrophilic end tends to be surrounded by water, and finally form the nanofiber.40,41 As a result, this nanosheet structure is not stable in bulk water. The nanosheet structure is likely generated under the drying process on a surface.39
Fig. 3.
AFM images on mica (a) before and (b) after adding water. (c) Illustration of the speculated conformational change.
Peptide self-assembly on substrates
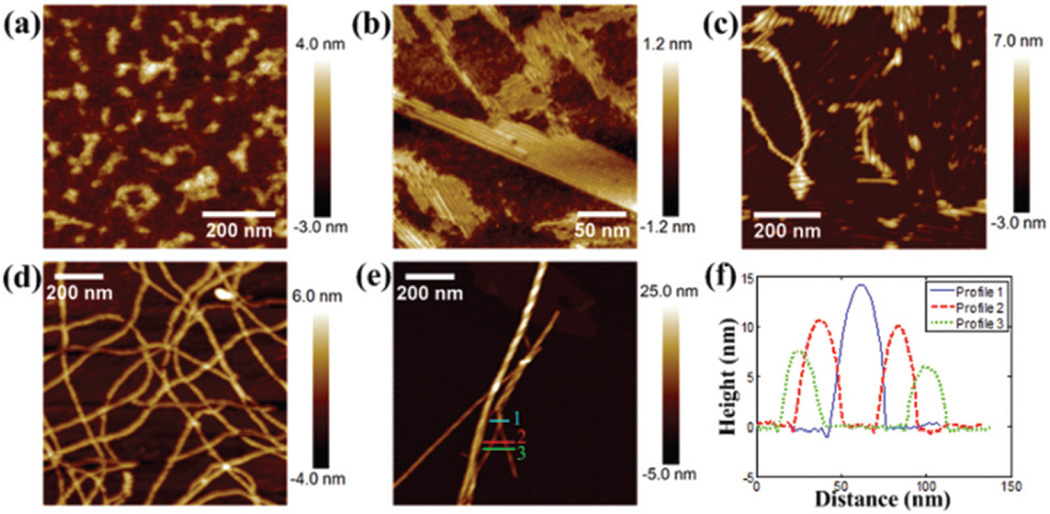
To further understand the assembly process, hydrogelators (1 mg mL−1) were prepared with different incubation times. Fig. 4(a) shows the AFM image of NapFFKYp without ALP. At this stage, peptide molecules aggregated without forming ordered structures. After incubation with ALP for 30 min, different conformations were observed as shown in Fig. 4(b)–(d). During this period, multiple structures were observed simultaneously, possibly because the local peptide concentration across the substrate surface was not uniform during the drying process. Fig. 4(b) shows that the aggregates associated with rod-like structures in different orientations to form the nanosheet. On the nanosheet, peptides further accumulated to form the nanofibers (Fig. 4(c)), and associated with the nanofiber network (Fig. 4(d)). After a long incubation time of 1 day, high-ordered nanofibers with twisted structures were observed as shown in Fig. 4(e) and S1,† and their heights were over 8 nm as shown in the profiles in Fig. 4(f).
Fig. 4.
AFM images (a) without alkaline phosphatase (ALP) and with ALP trigger after (b–d) 30 min and (e) 1 day. (f) Line profile.
Secondary conformation of peptide amphiphiles and nanofibers
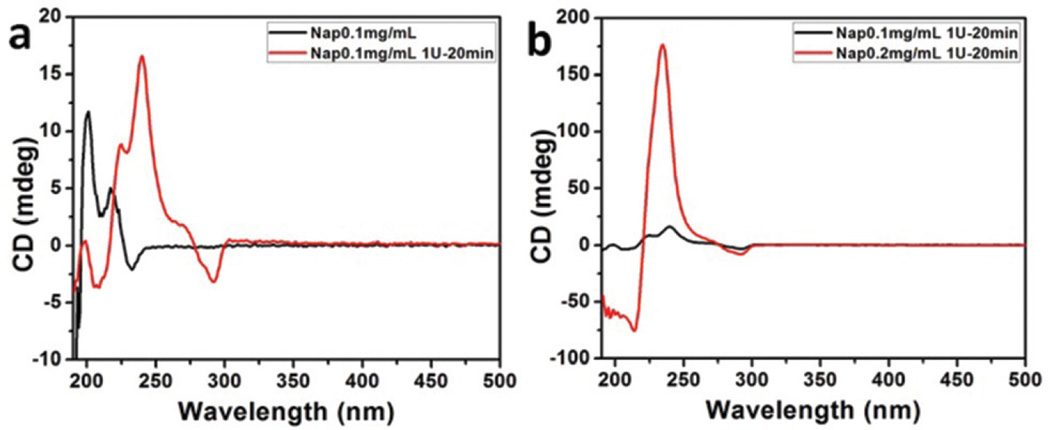
We employed a circular dichroism (CD) spectropolarimeter to investigate the conformation change from peptide amphiphiles to nanofibers (Fig. 5). Peptide amphiphiles had a negative peak near 190 nm and two positive peaks around 200 and 217 nm (Fig. 5(a)), which suggests the absence of regular secondary structures in the peptide amphiphile solution. Nanofibers had a negative peak around 208 nm and two positive peaks around 224 and 240 nm, indicating the adoption of traditional antiparallel arrangements in a β-sheet like secondary structure during the self-assembly of peptide amphiphiles. With the increased concentration of peptide amphiphiles, the nanofibers had a negative peak around 214 nm and one positive peak around 234 nm. The intensity of the positive peak at 234 nm was significantly increased (Fig. 5(b)).
Fig. 5.
(a) CD spectra of peptide amphiphiles (0.1 mg mL−1 NapFFKYp) and nanofiber (0.1 mg mL−1 NapFFKYp). (b) CD spectra of nanofibers (0.1 and 0.2 mg mL−1 NapFFKYp).
Coarse-grained molecular dynamics simulation for nanofiber formation
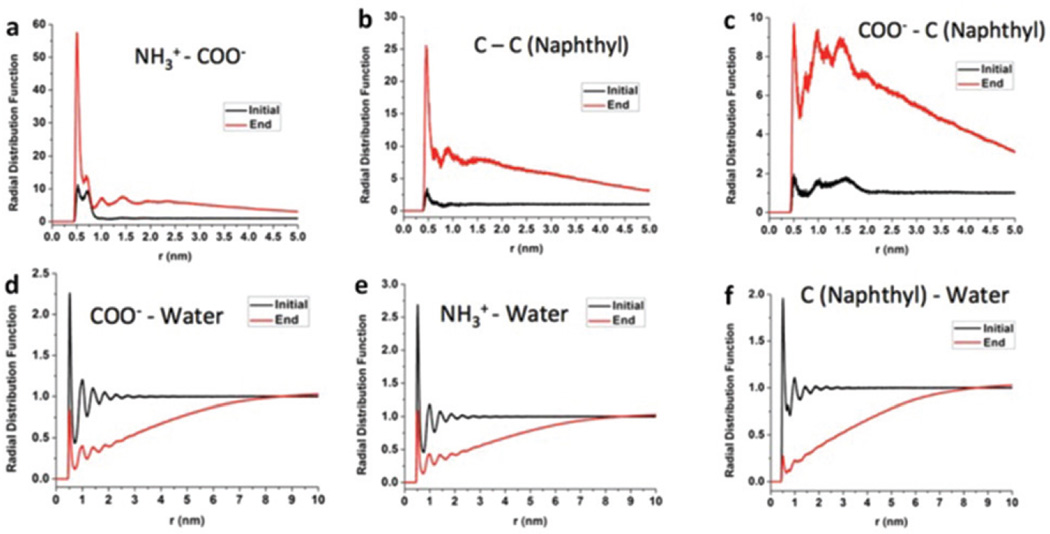
We simulated the radial distribution function g(r) between different pairs of the nanofiber formation process42,43 (Fig. S2† and Fig. 6). The NH4+–COO− radial distribution function showed that there was close contact (ion–ion interaction) between positively charged amino groups and negatively charged carboxylic groups after nanofiber formation (Fig. 6(a)). The C (naphthyl)–C (naphthyl) radial distribution function displayed a hydrophobic interaction between naphthyl groups after nanofiber formation (Fig. 6(b)). The COO−–C (naphthyl) radial distribution function showed that the number density of COO− at a distance of 1.5 nm from carbon in the naphthyl group after nanofiber formation was much higher than that in the initial structure (Fig. 6(c)). COO−–water, NH4+–water and C (naphthyl)–water radial distribution functions formed certain organized structures at the end of the simulation process (Fig. 6(d)–(f)).
Fig. 6.
Radial distribution functions g(r) for different pairs of interest at the beginning (black) and end (red) of the nanofiber formation process. The function g(r) shows how density changes as a function of distance from a reference particle and the local density can be calculated as ρg(r) where ρ is the average particle number density.
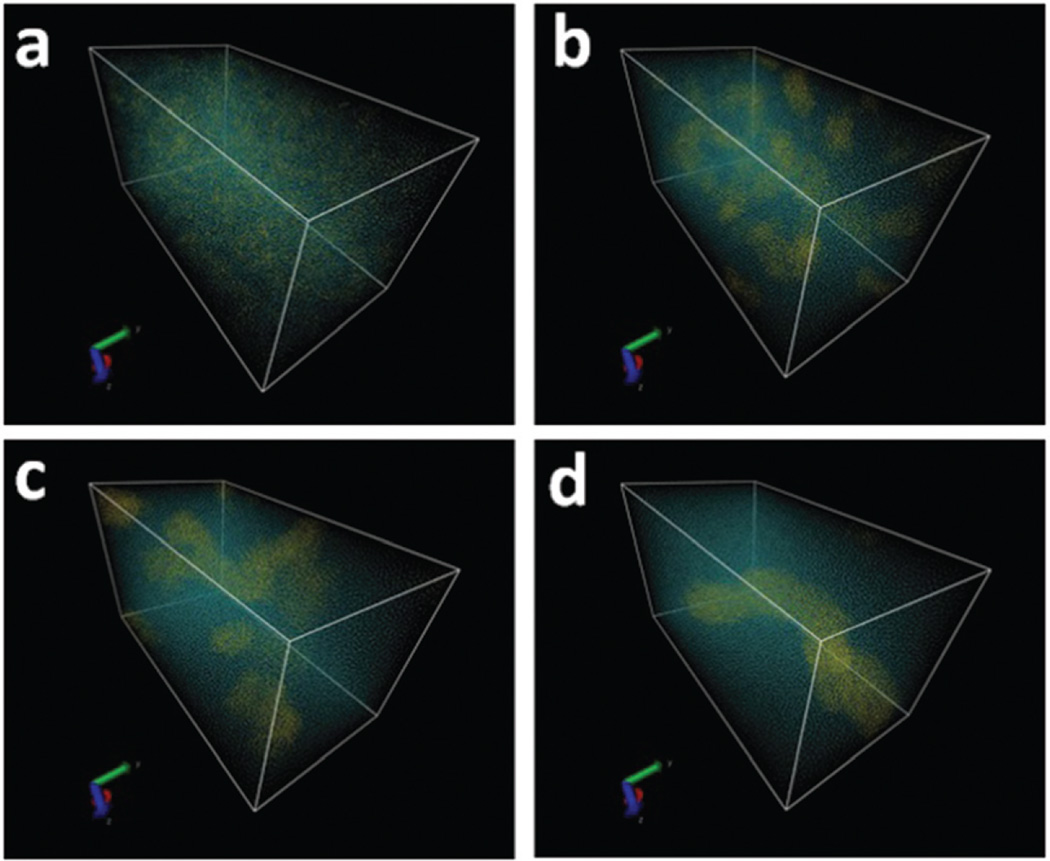
As shown in Fig. 7, peptide amphiphiles formed the aggregates at the early nucleation process (Fig. 7(a) and (b)). With time, the aggregates acted as nuclei to initiate the growth of nanofibers via ion–ion and hydrophobic interactions (Fig. 7(c)). The nuclei then gradually grew into long nanofibers (Fig. 7(d)). These results are in agreement with AFM observations.
Fig. 7.
Structure of the simulation system at various time points: 0, 40, 300 and 1200 ns. Small clusters were found during the nanofiber formation process. A nanofiber (8 nm in diameter) formed at the end of the simulation. There are 31 peptides per nanometer of fiber on average.
Self-assembly pathways
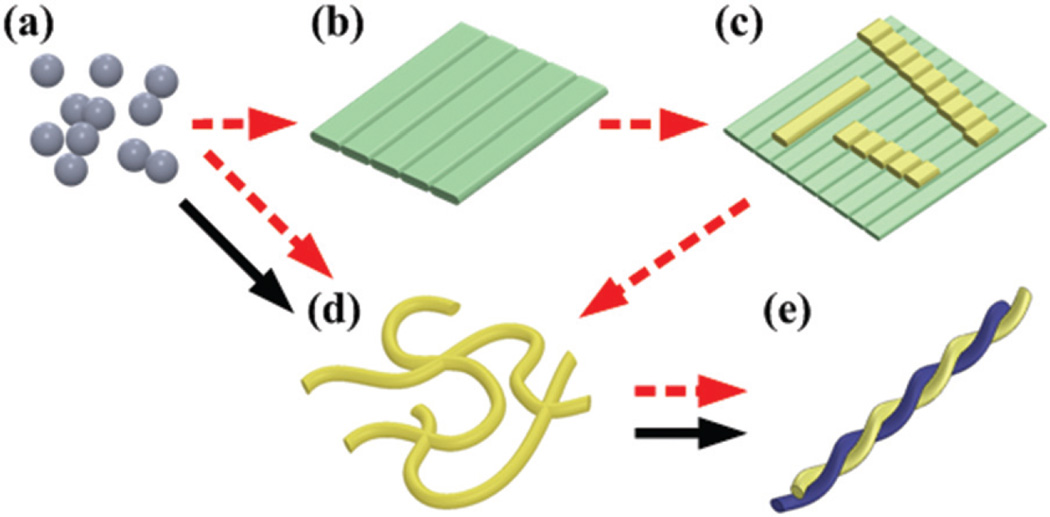
We propose two different self-assembly pathways depending on the substrates. The black solid arrows in Fig. 8 indicate the pathway in the solution, which is straightforward because no substrate support effect is involved. Both AFM (Fig. 1(a)) and simulation (Fig. 7(a) and (b)) results show that the peptide aggregates initiate the self-assembly as nuclei (Fig. 8(a)). Because the water effect experiment verifies that the nanosheet is not stable in bulk water (Fig. 3), the nanosheet structure can be bypassed. Then, both AFM images (Fig. 1) and CD spectra (Fig. 6) reveal that the nanofibers of 4 nm height start to grow and associate with the nanofiber network (Fig. 8(d)). This process can be accelerated significantly by increasing the peptide concentration (Fig. 1 and 5). After a longer period of incubation, the nanofibers can further twist into high-ordered nanofibers with a diameter larger than 8 nm (Fig. 8(e)). Interestingly, another reported self-assembly pathway showed that the twisted ribbons form first, and then elongate with time,22 and the presence of phenylalanine residues dominates the formation of the twisted ribbon structure. In our experiment, however, we found that the initial self-assembly is determined by both the hydrophobicity of the nanostructure and the environmental conditions. We also observed the nanosheet structure in the self-assembly process on different substrates, and multiple pathways may co-exist. When the sample is dropped on the substrate, nanofibers keep growing in the liquid. Simultaneously, the nanosheet forms on the substrate during the drying process. The exact timing for the nanosheet formation is unknown, but the AFM images showed that the nanofibers stack on the nanosheet (Fig. 4(c) and (d)). Therefore, we conclude that the nanosheet forms on the substrate first. Then, the nanofibers can either grow along the rod-like structure or just fall on the nanosheet.
Fig. 8.
Schematic diagram of self-assembly pathways between conformations of (a) aggregate, (b) nanosheet, (c) nanofiber on nanosheet, (d) nanofibers, and (e) high-ordered nanofibers. Red dashed arrows represent the pathways on the substrate. Black solid arrows represent the pathway in solution.
Force measurements of nanostructures
It is expected that the mechanical properties of the nanofiber may provide insights about the intrinsic structure and the dominant interaction force during the self-assembly process. To measure the mechanical stiffness, the nanofibers were squeezed by the AFM tip on the mica. The morphology and Young’s modulus of the nanofibers were measured simultaneously as shown in Fig. 9(a) and (b), respectively. Fig. 9(c) shows the Young’s modulus of 105 individual nanofibers. The average value was 3.1 ± 0.8 GPa (mean ± s.d.), which is very close to the Young’s modulus of amyloid fibrils Aβ(1–42) (3.2 ± 0.8 GPa).44 We found no significant difference in the Young’s modulus between the nanofiber and the twisted nanofiber. This result suggests that the twisting process doesn’t affect the intrinsic structure of the individual nanofiber. The Young’s modulus of nanosheets cannot be measured, because the nanosheets are too thin so that the AFM tip cannot generate enough deformation.
Fig. 9.
(a) AFM height image, (b) Young’s modulus mapping, and (c) histogram of Young’s modulus.
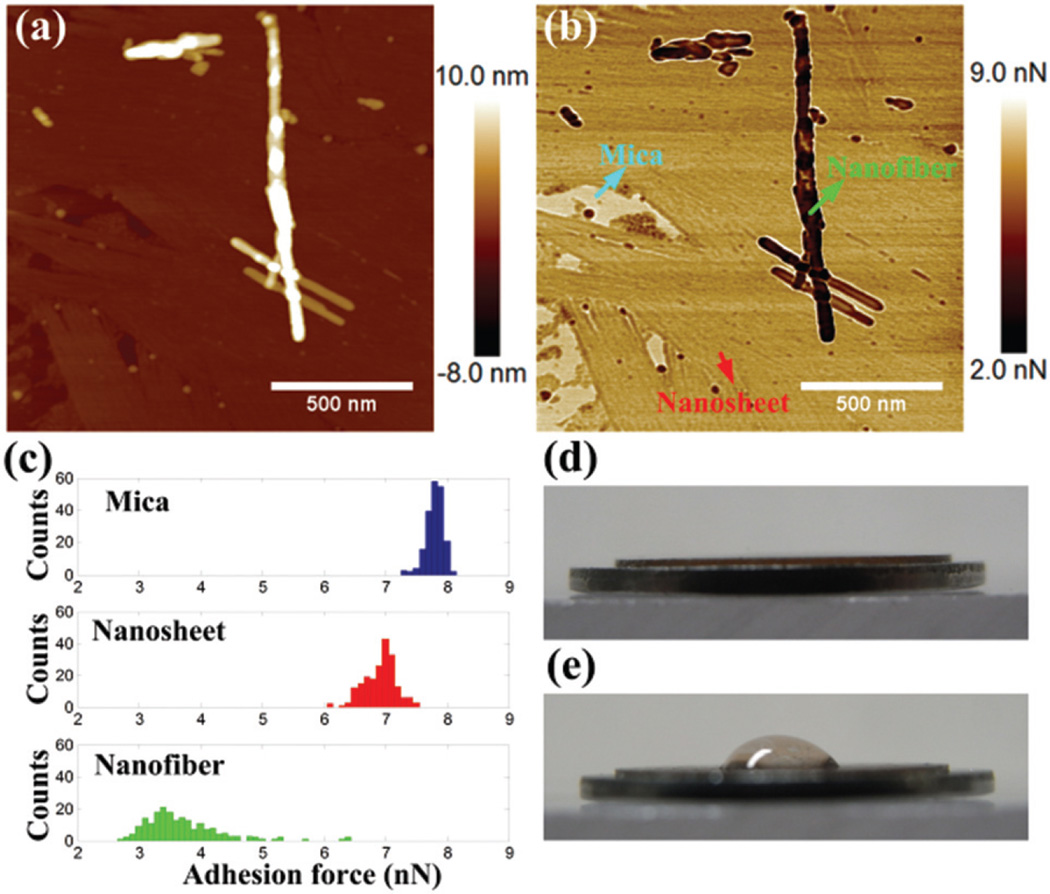
Besides the mechanical stiffness, the adhesion force can be extracted from the maximum attractive force when the tip is lifted up from the sample. The height and adhesion force images are shown in Fig. 10(a) and (b), respectively. On each surface, 200 data points were counted, and the histograms of the adhesion force are shown in Fig. 10(c). The adhesion forces on the bare mica, nanosheet, and nanofiber were 7.8 ± 0.1, 6.9 ± 0.3, and 3.7 ± 0.6 nN, respectively. The relative humidity was 75%, and the thin water layer on the surface could determine the adhesion force in the ambient environment. Therefore, the thicker water layer on the extremely hydrophilic mica causes the highest adhesion force. Compared with the mica surface, the hydrophilicity of the nanofiber and nanosheet is lower, which is in agreement with the contact angle test (Fig. 10(d) and (e)). Interestingly, the hydrophilicity of the nanofiber is much lower than the nanosheet. This phenomenon could be explained by the arrangement of β-sheet layers. A cofacial bilayer with hydrophilic side-chains outside can be more hydrophilic than the nanofiber surface.45 The flat sheet-like surface could be more favorable to accumulate the water film. As we know, the adhesion forces of the nanofiber and the high-ordered nanofiber are similar, which also supports the conclusion that their intrinsic structures are the same before or after twisting.
Fig. 10.
(a) AFM height image, (b) adhesion force mapping, (c) histograms of adhesion force on different regions, water droplets on (d) clean mica and (e) mica coated with peptide amphiphile assembly.
Experimental section
Sample preparation
NapFFKYp peptide (0.1–1 mg mL−1) was dissolved in PBS (pH 7–8). Alkaline phosphatase (ALP) (1 U) was then added to start the formation of nanofiber.
Atomic force microscopy
The peptide samples were diluted with water to different concentrations (1–0.1 mg ml−1). The self-assembly was triggered by alkaline phosphatase (ALP) (1 U). After incubation (30 min–1 day), the samples were dropped on the freshly peeled mica surface, highly oriented pyrolytic graphite (HOPG), and polystyrene (PS) film. Then the samples were dried in air and imaged by a Multimode AFM (Bruker, CA) consisting of a Nanoscope V controller and a type E scanner head. TESP-SS and OTESPA (Brucker, CA) cantilevers were used in the tapping mode, and SCANASYST-FLUID+ and OTESPA (Brucker, CA) cantilevers were used in the peak force quantitative nanomechanical (PF-QNM) mode.
In determining the mechanical properties, the PF-QNM mode was utilized. The OTESPA cantilevers were used for the Young’s modulus measurement. The tip radius was calibrated by measuring a polystyrene sample (PSFILM, Brucker) with a known Young’s modulus of 2.7 GPa, and the nanofibers were measured under a similar deformation. The force curves on the nanofibers were recorded, and the Young’s modulus was derived from the Hertz model. The silicon nitride MSCT-F (Brucker, CA) cantilevers were used for the adhesion force measurement. The relative humidity of the environment was about 75%.
Molecular dynamic simulation
The molecular dynamic simulation was performed with GROMACS 4.5.3 software and a MARTINI coarse-grained (CG) force field. The simulation time step is 10 femtosecond and total simulation time is 1.2 microseconds. 1250 peptides and 120 000 CG water molecules were randomly distributed in a 20 nm × 20 nm × 40 nm simulation box. The NPT (constant particle number, pressure and temperature) simulation was performed at 310 K temperature, 1 atm pressure for 1.2 microseconds with a 10 femtosecond time step.
Conclusions
In this study, we have shown that the specific self-assemblies of a small peptide amphiphile (NapFFKYp), and their product morphologies can be affected by the peptide concentration, incubation time and substrates. We have proposed two different pathways in the solution and on the substrate, respectively. In the solution, the self-assembly pathway starts from the peptide aggregates to the nanofibers, and the nanofibers twist to form high-ordered nanofibers eventually. The peptide molecules assemble into the nanofiber and form a nanosheet structure on the substrate simultaneously. Importantly, this result highlights the need to verify the substrate effect with high-resolution imaging techniques such as AFM and TEM. A method of adding water for the stability test is proposed here, demonstrating that water can transform the nanosheet into the nanofiber. This result implies a strong hydrophobic interaction in the nanofiber. Besides, the molecular dynamics simulation further illustrates that the self-assembly is dominated by hydrophobic and ion–ion interactions. Moreover, the force measurement reveals that the mechanical property of the nanofiber is similar to the amyloid fibrils, and the twisting process does not change the intrinsic stiffness of the nanofiber. The adhesion force measurement suggests that the hydrophilicities of the nanofiber and the nanosheet are significantly different. This information could be helpful to derive the arrangements of the peptide amphiphile assembly. The hydrophobicity has been identified as one of the dominant properties to form a nanofiber.24,25 These findings may provide more insight into understanding and controlling the self-assembly process.
On discerning nanofiber-based disease mechanisms and developing theranostics,33,46 the interactions between nanostructures and complex surfaces like the plasma membrane and extracellular matrix (ECM) could play important roles for cellular toxicity in AD and PD and for tumor targeting and delivery of multifunctional therapeutics. Therefore, understanding the interactions between nanostructures and surfaces is crucial, fundamental, and far-reaching. Furthermore, AFM has been demonstrated for the dynamic imaging of self-assembly and the force measurement of the individual nanofiber.44,47 A potential future study would be to understand self-assembly on the plasma membrane through dynamic imaging, and the interactions between nanostructures and the membrane through force measurement.
Supplementary Material
Acknowledgments
This work was supported by the startup fund from the Shenzhen University, the National Natural Science Foundation of China (81401465, 51573096), and the Intramural Research Program (IRP) of the NIBIB/NIH.
Footnotes
Electronic supplementary information (ESI) available. See DOI: 10.1039/c6nr04672j
Notes and references
- 1.Lippincott-Schwartz J, Snapp E, Kenworthy A. Nat. Rev. Mol. Cell Biol. 2001;2:444–456. doi: 10.1038/35073068. [DOI] [PubMed] [Google Scholar]
- 2.Pollard TD. Nature. 2003;422:741–745. doi: 10.1038/nature01598. [DOI] [PubMed] [Google Scholar]
- 3.Goldsbury C, Frey P, Olivieri V, Aebi U, Muller SA. J. Mol. Biol. 2005;352:282–298. doi: 10.1016/j.jmb.2005.07.029. [DOI] [PubMed] [Google Scholar]
- 4.Petkova AT, Leapman RD, Guo Z, Yau WM, Mattson MP, Tycko R. Science. 2005;307:262–265. doi: 10.1126/science.1105850. [DOI] [PubMed] [Google Scholar]
- 5.Norlin N, Hellberg M, Filippov A, Sousa AA, Grobner G, Leapman RD, Almqvist N, Antzutkin ON. J. Struct. Biol. 2012;180:174–189. doi: 10.1016/j.jsb.2012.06.010. [DOI] [PMC free article] [PubMed] [Google Scholar]
- 6.Spillantini MG, Crowther RA, Jakes R, Hasegawa M, Goedert M. Proc. Natl. Acad. Sci. U. S. A. 1998;95:6469–6473. doi: 10.1073/pnas.95.11.6469. [DOI] [PMC free article] [PubMed] [Google Scholar]
- 7.Conway KA, Harper JD, Lansbury PT. Nat. Med. 1998;4:1318–1320. doi: 10.1038/3311. [DOI] [PubMed] [Google Scholar]
- 8.Sweers KK, van der Werf KO, Bennink ML, Subramaniam V. ACS Nano. 2012;6:5952–5960. doi: 10.1021/nn300863n. [DOI] [PubMed] [Google Scholar]
- 9.Kirschner M, Mitchison T. Cell. 1986;45:329–342. doi: 10.1016/0092-8674(86)90318-1. [DOI] [PubMed] [Google Scholar]
- 10.Pollard TD, Borisy GG. Cell. 2003;112:453–465. doi: 10.1016/s0092-8674(03)00120-x. [DOI] [PubMed] [Google Scholar]
- 11.Jordan MA, Wilson L. Nat. Rev. Cancer. 2004;4:253–265. doi: 10.1038/nrc1317. [DOI] [PubMed] [Google Scholar]
- 12.Adams DJ, Topham PD. Soft Matter. 2010;6:3707–3721. [Google Scholar]
- 13.Gazit E. Chem. Soc. Rev. 2007;36:1263–1269. doi: 10.1039/b605536m. [DOI] [PubMed] [Google Scholar]
- 14.Tian YF, Devgun JM, Collier JH. Soft Matter. 2011;7:6005–6011. doi: 10.1039/C1SM05504F. [DOI] [PMC free article] [PubMed] [Google Scholar]
- 15.Sharma PP, Rathi B, Rodrigues J, Gorobets NY. Curr. Top. Med. Chem. 2015;15:1268–1289. doi: 10.2174/1568026615666150408105711. [DOI] [PubMed] [Google Scholar]
- 16.Altunbas A, Lee SJ, Rajasekaran SA, Schneider JP, Pochan DJ. Biomaterials. 2011;32:5906–5914. doi: 10.1016/j.biomaterials.2011.04.069. [DOI] [PMC free article] [PubMed] [Google Scholar]
- 17.Fleming S, Ulijn RV. Chem. Soc. Rev. 2014;43:8150–8177. doi: 10.1039/c4cs00247d. [DOI] [PubMed] [Google Scholar]
- 18.Tsutsumi H, Mihara H. Mol. BioSyst. 2013;9:609–617. doi: 10.1039/c3mb25442a. [DOI] [PubMed] [Google Scholar]
- 19.Chen C, Gu Y, Deng L, Han S, Sun X, Chen Y, Lu JR, Xu H. ACS Appl. Mater. Interfaces. 2014;6:14360–14368. doi: 10.1021/am5036303. [DOI] [PubMed] [Google Scholar]
- 20.Li R, Horgan CC, Long B, Rodriguez AL, Mather L, Barrow CJ, Nisbet DR, Williams RJ. RSC Adv. 2015;5:301–307. [Google Scholar]
- 21.Korevaar PA, Newcomb CJ, Meijer EW, Stupp SI. J. Am. Chem. Soc. 2014;136:8540–8543. doi: 10.1021/ja503882s. [DOI] [PubMed] [Google Scholar]
- 22.Pashuck ET, Stupp SI. J. Am. Chem. Soc. 2010;132:8819–8821. doi: 10.1021/ja100613w. [DOI] [PMC free article] [PubMed] [Google Scholar]
- 23.Adamcik J, Castelletto V, Bolisetty S, Hamley IW, Mezzenga R. Angew. Chem., Int. Ed. 2011;50:5495–5498. doi: 10.1002/anie.201100807. [DOI] [PubMed] [Google Scholar]
- 24.Frederix PWJM, Scott GG, Abul-Haija YM, Kalafatovic D, Pappas CG, Javid N, Hunt NT, Ulijin RV, Tuttle T. Nat. Chem. 2015;7:30–37. doi: 10.1038/nchem.2122. [DOI] [PubMed] [Google Scholar]
- 25.Fu IW, Markegard CB, Chu BK, Nguyen HD. Langmuir. 2014;30:7745–7754. doi: 10.1021/la5012988. [DOI] [PubMed] [Google Scholar]
- 26.Cote Y, Fu IW, Dobson ET, Goldberger JE, Nguyen HD, Shen JK. J. Phys. Chem. C. 2014;118:16272–16278. doi: 10.1021/jp5048024. [DOI] [PMC free article] [PubMed] [Google Scholar]
- 27.Aspelmeier T, Egner A, Munk A. Annu. Rev. Stat. Appl. 2015;2:163–202. [Google Scholar]
- 28.Hell SW. Nat. Biotechnol. 2003;21:1347–1355. doi: 10.1038/nbt895. [DOI] [PubMed] [Google Scholar]
- 29.Shen L, Adachi T, Bout DV, Zhu XY. J. Am. Chem. Soc. 2012;134:14172–14178. doi: 10.1021/ja305398f. [DOI] [PubMed] [Google Scholar]
- 30.So CR, Hayamizu Y, Yazici H, Gresswell C, Khatayevich D, Tamerler C, Sarikaya M. ACS Nano. 2012;6:1648–1656. doi: 10.1021/nn204631x. [DOI] [PMC free article] [PubMed] [Google Scholar]
- 31.Lin YC, Petersson EJ, Fakhraai Z. ACS Nano. 2014;8:10178–10186. doi: 10.1021/nn5031669. [DOI] [PMC free article] [PubMed] [Google Scholar]
- 32.Gao Y, Shi J, Yuan D, Xu B. Nat. Commun. 2012;3:1033. doi: 10.1038/ncomms2040. [DOI] [PMC free article] [PubMed] [Google Scholar]
- 33.Huang P, Gao Y, Lin J, Hu H, Liao HS, Yan X, Tang Y, Jin A, Song J, Niu G, Zhang G, Horkay F, Chen X. ACS Nano. 2015;9:9517–9527. doi: 10.1021/acsnano.5b03874. [DOI] [PMC free article] [PubMed] [Google Scholar]
- 34.Taherian F, Marcon V, van der Vegt NFA, Leroy F. Langmuir. 2013;29:1457–1465. doi: 10.1021/la304645w. [DOI] [PubMed] [Google Scholar]
- 35.Jung YC, Bhushan B. Nanotechnology. 2006;17:4970–4980. [Google Scholar]
- 36.Yuan ZQ, Chen H, Tang JX, Gong HF, Liu YJ, Wang ZX, Shi P, Zhang JD, Chen X. J. Phys. D: Appl. Phys. 2007;40:3485–3489. [Google Scholar]
- 37.Powers ET, Yang SI, Lieber CM, Kelly JW. Angew. Chem., Int. Ed. 2002;41:127–130. doi: 10.1002/1521-3773(20020104)41:1<127::aid-anie127>3.0.co;2-f. [DOI] [PubMed] [Google Scholar]
- 38.Segman-Magidovich S, Lee MR, Vaiser V, Struth B, Gellman SH, Rapaport H. Chem. – Eur. J. 2011;17:14857–14866. doi: 10.1002/chem.201101775. [DOI] [PubMed] [Google Scholar]
- 39.Tanaka M, Abiko S, Himeiwa T, Kinoshita T. J. Colloid Interface Sci. 2015;442:82–88. doi: 10.1016/j.jcis.2014.11.021. [DOI] [PubMed] [Google Scholar]
- 40.Hartgerink JD, Beniash E, Stupp SI. Science. 2001;294:1684–1688. doi: 10.1126/science.1063187. [DOI] [PubMed] [Google Scholar]
- 41.Jiang HZ, Guler MO, Stupp SI. Soft Matter. 2007;3:454–462. doi: 10.1039/b614426h. [DOI] [PubMed] [Google Scholar]
- 42.Velichko YS, Stupp SI, de la Cruz MO. J. Phys. Chem. B. 2008;112:2326–2334. doi: 10.1021/jp074420n. [DOI] [PubMed] [Google Scholar]
- 43.Lee OS, Cho V, Schatz GC. Nano Lett. 2012;12:4907–4913. doi: 10.1021/nl302487m. [DOI] [PubMed] [Google Scholar]
- 44.Adamcik J, Lara C, Usov I, Jeong JS, Ruggeri FS, Dietler G, Lashuel HA, Hamley IW, Mezzenga R. Nanoscale. 2012;4:4426–4429. doi: 10.1039/c2nr30768e. [DOI] [PubMed] [Google Scholar]
- 45.Bowerman CJ, Ryan DM, Nissan DA, Nilsson BL. Mol. BioSyst. 2009;5:1058–1069. doi: 10.1039/b904439f. [DOI] [PubMed] [Google Scholar]
- 46.Chen Y, Liang G. Theranostics. 2012;2:139–147. doi: 10.7150/thno.3696. [DOI] [PMC free article] [PubMed] [Google Scholar]
- 47.Zhou XF, Liu JS, Li B, Pillai S, Lin DD, Liu JH, Zhang Y. Nanoscale. 2011;3:3049–3051. doi: 10.1039/c1nr10332f. [DOI] [PubMed] [Google Scholar]
Associated Data
This section collects any data citations, data availability statements, or supplementary materials included in this article.


