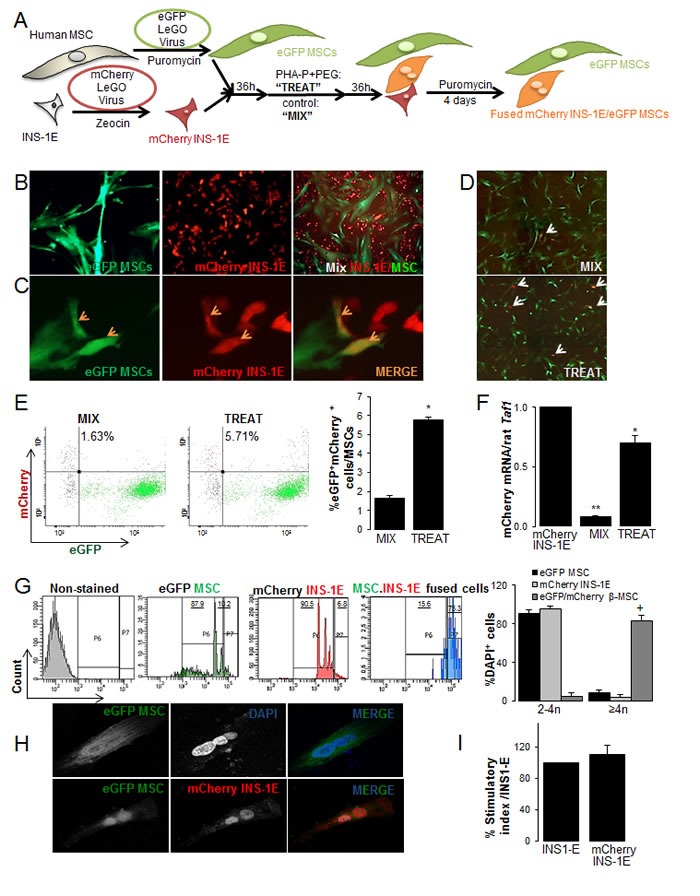
Figure 1. Generation of rat-human β-MSC heterokaryons.

(A) Schematic illustration of the strategy for generation of human stable eGFP+MSCs and rat mCherry+INS-1E cells that carry antibiotic-selectable markers. Cells were mixed (“MIX”) or fusion was induced by treatment with 100 μg/ml PHA-P and 50%W/V PEG (“TREAT”). Interspecies heterokaryons and human MSCs were selected by puromycin for 4 days. (B) Cultured eGFP+MSCs (left; 200X), mCherry+INS-1E (middle; 200X) and MIX (right: 100X) and (C) mCherry+INS-1E, eGFP+MSC and double positive β-MSC (orange arrows) in TREAT condition (400X). (D-H) TREAT cells after puromycin selection. (D) MIX (control) and TREAT conditions after 4 days puromycin selection, white arrows show eGFP+mCherry+ cells (40X). (E) Analysis and quantification (right) of mCherry+eGFP+ cells in MIX and TREAT conditions by FACS analysis. Gating was set up with single mCherry or single eGFP+ cells and conditions kept constant. (F) The relative mCherry mRNA expression normalized to INS-1E cells. RT-PCR was normalized to rat Taf1 (G) Polyploidy analysis by FACS of eGFP+MSCs, mCherry+INS-1E (controls) and eGFP+mCherry+ heterokaryons. Gating was set for control non-stained cells and kept constant. (H) An eGFP+ polyploid cell (upper panel) und an mCherry+eGFP+ polyploid heterokaryon from the eGFP+MSCs- mCherry+INS-1E fusion by CLSM (400X). (I) Insulin secretion of mCherry INS1-E in compare to INS-1E cells by glucose stimulation. All analyses were performed in at least three independent experiments from three MSC donors and show mean ± SEM. *P< 0.05 Treat compared to Mix. ** Mix compared to mCherry INS-1E alone. +P< 0.05 eGFP+mCherry+β-MSC compared to eGFP+MSC or to mCherry+INS-1E.
