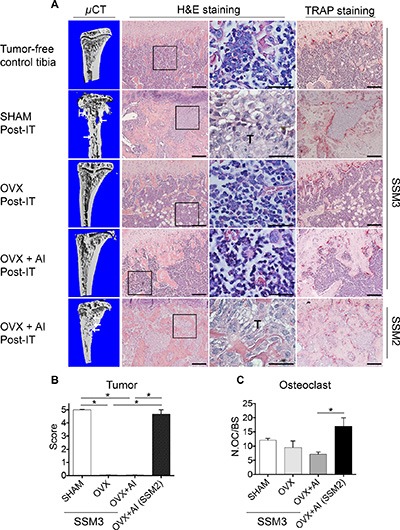
Figure 4. Established ERα+/PR+ SSM3 tumors are rejected following estrogen-deprivation.

(A) 105 SSM3 cells were injected into the right tibia of WT female mice (n = 3/group), 2 weeks before SHAM- or OVX- surgery. One group of mice injected with SSM3 received the aromatase inhibitor Letrozole (AI) for 4 weeks post-OVX surgery. As control of tumor growth, mice injected with SSM2 cells were also subjected to OVX + AI. Representative images of micro-CT, H&E and TRAP staining sections (original magnification, 10× for H&E and Trap staining, scale bar = 100 μm. 60× magnification for H&E, scale bar = 25 μm). Arrows pointing to osteolytic lesions. Presence of SSM2 or SSM3 tumor cells is indicated by T. Representative H&E and TRAP staining is shown on sections from tumor-free tibia as control. (B) Tumor grade score from 0 to 5 showing displacement of marrow by tumor, with 0 indicating no tumor and 5 100% tumor in the bone marrow. Data are represented as mean +/− sem for SHAM, OVX, and OVX + AI SSM3 groups, as well as OVX + AI SSM2 group. *p < 0.05. (C) Number of osteoclasts (OC) per bone surface is shown for SHAM, OVX and OVX + AI SSM3 groups, and OVX + AI SSM2 group. Data are represented as mean +/− sem. *p < 0.05.
