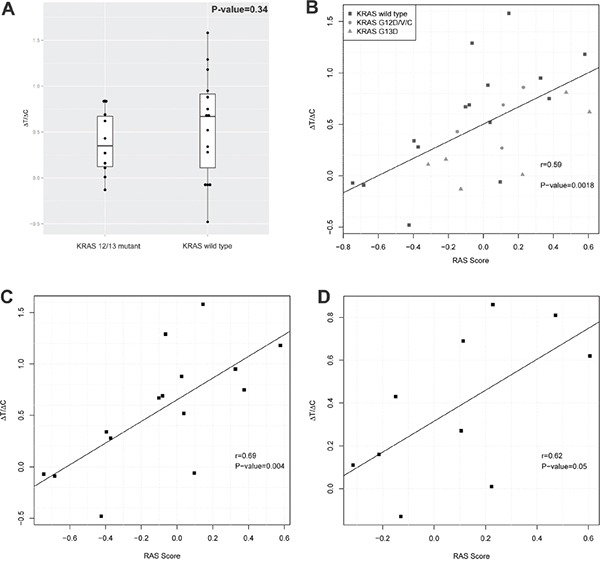
Figure 2. RAS pathway activity and cetuximab activity in a cohort of CRC-PDXs.

A. RAS signature score distribution in KRAS 12/13 mutants and KRAS 12/13 wild types. B-D. Correlation between RAS signature scores and tumor growth inhibition by cetuximab (ΔT/ΔC) in all 25 PDX models (B), in 15 KRAS 12/13 wild type PDX models (C), and in 10 KRAS 12/13 mutant PDX models (D).
