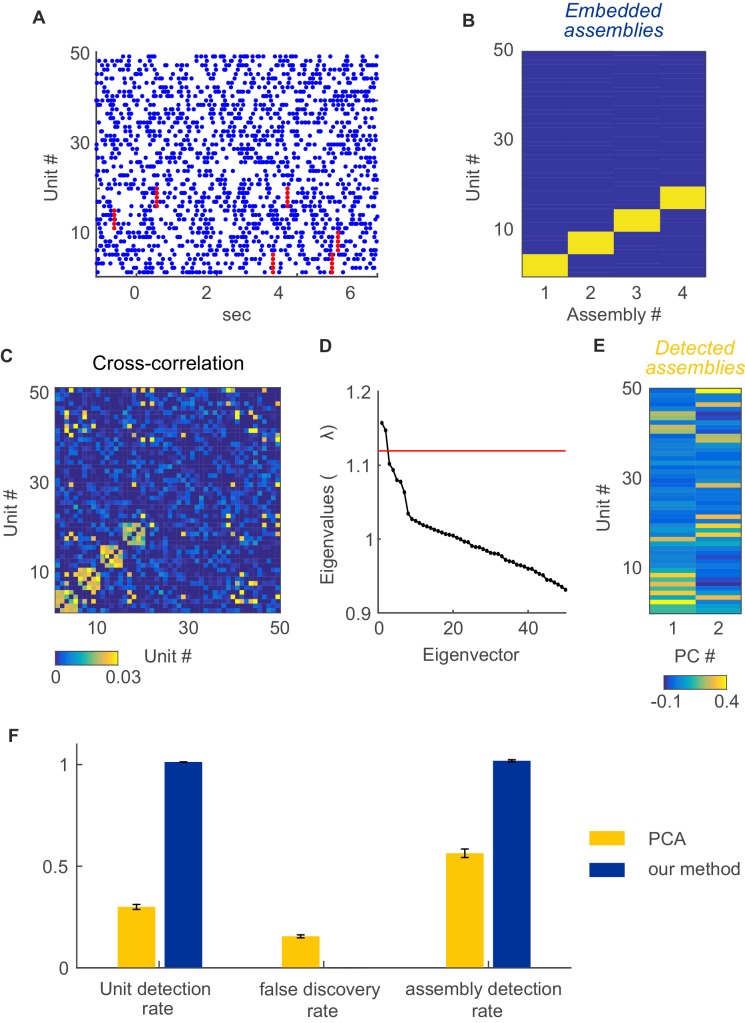
Appendix 1—figure 2. Assembly detection with PCA under non-stationarity.
For comparison with PCA-based assembly detection methods, simulations were performed with 50 non-stationary Poisson spike trains with four embedded, disjoint assemblies. Assemblies were defined as synchronous spike events (i.e., 'type I', cf. Figure 1A; 250 activations in total) occurring at random times within a set of five units. Non-stationary events were implemented as step-like changes shared among 4 groups of 5 units each, randomly chosen from the 50 units simulated, at random timings as described in sect. “Limitations of parametric testing under non-stationarity” (parameters used here were =0.02 s, =250, =1 s, =1950 s, baseline rate=5 Hz, up-state rate=10 Hz). For assembly detection by PCA, based on the cross-correlation matrix indicated in C, we followed the procedure described in Lopes-dos-Santos et al. (Lopes-dos-Santos et al., 2011) using code made publically available by the authors. (A) Examples of spike trains with assembly occurrences marked in red. (B) True unit-assembly assignment matrix. (C) Cross-correlation matrix with diagonal set to zero for better visualization. (D) Eigenvalue spectrum. Red line marks the upper limit of the Marčenko-Pastur distribution. (E) ‘Loadings’ of units on the two only significant principal components, indicating the assignment of units to the two assemblies detected this way. (F) Fraction of correctly detected assembly units (left), fraction of units falsely assigned to an assembly (center), and fraction of correctly detected assemblies (right) for PCA (yellow bars) and our method (blue bars). Error bars = SEM, based on 50 independent simulation runs.

