Abstract
Globally methane (CH4) emissions from ruminant livestock account for 29% of total CH4 emissions. Inherited variation about CH4 emissions of different animal species might provide new opportunity for manipulating CH4 production. Six rumen-simulating fermenters (Rusitec) were set up for this study lasting for 16 d. The diet consisted of forage to concentrate ratio of 50:50 with barley straw as the forage. Treated vessels were supplied with rumen fluid from yak or cattle (3 vessels per animal species). Microbial growth was measured using 15N as a marker. The microbial community structure from liquid- and solid-fraction of each vessel was determined based on the 16S rRNA genes targeting both bacteria and archaea with MiSeq platform. CH4 yield was lower when the inoculum used from yak than that from cattle (0.26 and 0.33 mmol CH4/g dry matter intake, respectively). Lower H2 production was observed in Rusitec fermenters with rumen fluid from yak compare with that from cattle (0.28 and 0.86 mmol/d, respectively). The apparent digestibility of neutral detergent fiber, the isovalerate percentage with respect to the total amount of volatile fatty acids, the hydrogen recovery, and the proportion of liquid-associated microbial nitrogen derived from ammonia-nitrogen were higher in Rusitec fermenters incubated with rumen fluid from cattle than that from yak. The relative abundances of methanogens were no difference between two animal species. We hypothesize that more H2 production contributes to the higher methane emissions in cattle compare with yak.
Introduction
Methane (CH4) accounts for 11% of total greenhouse gas (GHG) emissions in China. Almost 21% of CH4 emissions are due to enteric fermentation in ruminant livestock industry [1, 2]. The Global Warming Potential (GWP) of CH4 for a time horizon of 100 years is 28-fold that of CO2 [3]. Enteric CH4 emissions also represent a 2 to 12% loss of gross energy intake [4]. Many ways to manipulate enteric CH4 emissions have been developed, including 4 broad categories: feeds and feeding management, rumen modifiers, genetics and other management strategies [5]. Investigating animals that produce lower CH4 might lead to improving livestock systems through modifying rumen fermentation and reducing CH4 emissions from other livestock [6–8].
Yak produced 1.7 g of methane /kg W0.75 under grazing conditions, which was lower compared with published data about cattle (3.2~4.2 g of methane /kg W0.75) [9, 10]. Over 15 million yaks grazed in the Qinghai-Tibetan Plateau account for approximately 90% of the world's total number of yak [11]. Due to the harsh environment in the Qinghai-Tibetan Plateau, which is characterized by hypoxia, strong ultra-violet (UV) radiation, severe cold and deficiencies of forage resources, yak has evolved special abilities on the metabolism of certain nutrients, morphology, and genetics [12–14]. Therefore, yak shows great potential as a “low carbon” animal, which calls for systematic comparative studies of “low-CH4 emissions” from yak. However, in a previous study, they conducted an investigation regarding yak without a control group [9]. The level of intake, type and quality of feed, and environmental temperature might contribute to great variation in CH4 production [15]. Rumen-simulating fermenters, like the Rusitec fermenters, could be useful tools to evaluate methane emissions from different animals or under different additives treatment because major advantage of this system is the ability to remove fermentation liquid and maintain for relatively long periods of time [16, 17]. The information would be useful using this type of fermenter before conducting expensive and time-consuming in vivo study to confirm the difference of methane emissions between yak and cattle. Thus, we performed a comparative study using a Rusitec system to investigate the difference of CH4 emissions between yak and cattle under same conditions. The first aim of this study was to confirm if yak is lower CH4 producer than cattle under the same conditions. The second aim was to explore the possible link between CH4 production and liquid-/solid-associated microbes.
Materials and Methods
Animals and treatments
The experiment was conducted from February to April 2014 at the Wushaoling Yak Research Station (37°12.4′N, 102°51.7′E, and altitude 3154m) of Lanzhou University, China. Six castrated male animals (3 cattle; 3 yaks; body weight: 192±12kg) were donor animals of rumen fluid. The yaks (Tianzhu White yak) used in this study were chosen from a local farm at research station. The cattle (Chaidamu Cattle) were bought from Dulan county of Qinghai province, which was grazed all around a year under nature pasture with the Phragmites communis as the dominant grass. The use of animals, including their welfare, feeding, and rumen fluid collection, was approved by the Animal Ethics Committee of the Chinese Academy of Lanzhou University (permit number: SCXK Gan 20140215). The sample collection from the animals was handled in accordance with the requirements set forth by the Animal Ethics Procedures and Guidelines of the People's Republic of China. The animals were kept in the metabolism crates in the house with ad libitum access to water and fed 3 kg dry matter/d (approximately 1.5% of body weight), receiving half at 0900 h and the other half at 1800 h during the experiment period. Feed composition was listed in Table 1. Before starting the experiment, animals were familiarized with the environment as well as technical staff feeding to them for 30 days. The average indoor temperature was 6°C, and the relative humidity was 70%. The pens and metabolism crates were cleaned twice a day. The pens were maintained at a good air circulation during experimental study. During experiment period, all animals were kept in a health condition without any medicine treatment. After an adaptation period, the experiment lasted for 20 days, then rumen fluid was taken via the animal’s mouth using a stainless-steel stomach tube attached with a vacuum sampler before morning feeding on the 20th day. After rumen fluid collection, the animals were used for another experiment in our lab. The rumen fluid from three animals with same species was mixed well, maintained in an anaerobic environment using CO2, and used within 1 h for Rusitec study. The mixed rumen fluid from same species was diluted with artificial saliva (550 mL: 450 mL) before dividing 800 mL into each of three fermentation vessels. The pH was controlled between 6.5 and 7.1. Artificial saliva was continuously infused at a rate of 750 mL/d, approximating a dilution rate of 3.9%/h.
Table 1. Ingredients and chemical composition of the experimental diet.
| Item | Amount |
|---|---|
| Ingredient, % of DM | |
| Hulless barley straw | 50 |
| Corn | 30.5 |
| Wheat red dog | 5 |
| Corn starch powder | 12.5 |
| Cottonseed oil | 0.5 |
| Calcium hydrophosphate | 0.5 |
| Commercial premix | 0.5 |
| Sodium chloride | 0.5 |
| Chemical composition of diet % of DM | |
| CP | 6.45 |
| OM | 93.78 |
| Ash | 6.22 |
| NDF | 67.61 |
| ADF | 25.62 |
| metabolizable energy* (MJ/kg DM) | 8.35 |
*Estimated according to the NRC (1985)
DM-dry matter; NDF- neutral detergent fiber; OM-organic matter; ADF-acid detergent fiber.
One trial of 6 Rusitec fermenters was maintained for 16 days. Each fermenter unit had an 800-mL effective volume. The procedure for incubation and the daily operation was consistent with the detailed report by Martínez et al. [18]. All fermenters were filled daily at 0900 h with a 20 g mixture diet of 50: 50 barley straw to concentrate using nylon bags (100μm pore, 5*15 cm) (Table 1). The barley straw was chopped to approximately 3 mm pieces, and the concentrate was ground to pass a 3-mm screen. Before and after feeding, each flask was flushed daily with 1.5 L of gaseous nitrogen to collect the gasses produced from in vitro fermentation and to remove the air introduced during feeding, respectively.
The adaptation period of the Rusitec study was from 1 day to 6 day. Digestibility (measured as the substrate disappearance from the bag), pH before feeding, ammonia-N, and VFA were determined on days 7 to 15. The volume of effluent was measured daily, and a 4 mL sample (approximately total 20 mL) was directly frozen (-80°C) for the next analysis of ammonia-N. A 1 mL sample was collected for VFA analysis by diluting 1: 1 in a deproteinizing solution (10% metaphosphoric acid and 0.06% crotonic acid, wt/vol) and stored at -80°C.
Gas was collected from days 7–15 in Guangming gas sampling bags (Zhonghao Guangming Research & Design Institute of Chemical Industry Corporation, Dalian, China), and the volume of fermentation gasses was measured by water displacement. The concentration of CH4 was determined using gas chromatography [17]. Hydrogen recovery was calculated according to the equation described by Makkar and Vercoe [17].
On day 11, 15NH4Cl (99% enriched, Shanghai Engineering Research Centre of Stable Isotope, Shanghai, China) was added into each fermenter at a dose of 2.4 mg of 15N to label the NH3-N pool instantaneously. It was also necessary to add 15NH4Cl to the artificial saliva to reach a rate of 4.0 g of 15N/kg dietary N.
On days 15 and 16, instead of H2SO4 solution (20%, vol/vol), which could cause microbe lysis, 5 mL of saturated HgCl2 was added to each flask collected liquid effluent. Liquid-associated microbiome pellets (LAM) were obtained from approximately 480 mL effluent by differential centrifugation [19]. The remaining liquid was freeze-dried for analyses of N, non-ammonia nitrogen (NAN), NH3-15N, 15N, and NAN-15N enrichment. On days 15 and 16, one part of the nylon bag residues was used to isolate solid-associated microorganisms (SAM); meanwhile, one-fifth of the residue content from each nylon bag was frozen and lyophilized for determination of N, NAN, 15N, and NAN-15N enrichment. The contents of the nylon bags were treated with a saline solution of 0.1% methylcellulose (0.85% NaCl) at 38°C for 30 min with continuous shaking to elute any attached microorganisms [20]; the residue was re-suspended in a chilled saline solution (same as above) for 24 h after filtering through two layers of nylon cloth (40-μm pore size). The filtrate of the same day was mixed and used to obtain the SAM by centrifugation, as reported by Ranilla and Carro [21]. After treatment, the residue was freeze-dried for the determination of N, NAN, 15N, and NAN-15N enrichment. On day 16, 300 mg pellets of LAM and SAM were used to extract genome DNA for investigating bacterial and archaea compositions using next generation sequencing of the Miseq Platform. The LAM and SAM pellets were lyophilized and used to analyze the N and 15N enrichment. The substrate used in this study was also measured for 15N content, the value of which was used for background modifications.
Analytical procedures
Dry matter, ash, and nitrogen were measured as described by AOAC [22]. Neutral detergent fiber (NDF) was determined according to Van Soest et al. [23] without sodium sulfite and amylase, using VELP SCIENTIFICA FIWE6. The NH3-N and VFA concentrations were determined according to Carro and Miller [19]. CH4 was measured by GC with FID detector attached by a column of Porapak Q, the condition was same as described by Ding et al. [9]. Preparation of samples for 15N analysis was conducted as described by Carro and Miller [19], and 15N was analyzed using elementary analyzer-stable isotope ratio mass spectrometers (EA-IRMS, Thermo Delta V advantage and Flash EA 1112 HT).
DNA extraction and analysis
Genomic DNA was extracted from approximate 300mg (wet weight) LAM and SAM according to the QIAGEN stool kit protocol (51504, Qiagen, Hilden, Germany). DNA was quantified using Nanodrop2000 (Thermo Fisher Scientific Inc., Wilmington, USA) and run on 1.8% agarose gel to confirm DNA integrity. The V4 region of 16S rRNA gene was amplified by PCR using primers 515F-806R as previously described [24, 25]. Reaction conditions consisted of initial denaturation at 95°C for 2 min followed by 25 cycles of denaturation at 95°C for 30 s, annealing at 57°C for 30s, extension at 72°C for 45 s, and a final extension at 72°C for 10 min. Amplicons were quantified using the QubiT PicoGreen dsDNA assay kit (Invitrogen, Grand Island, USA) and mixed at equal masses for a final concentration of approximate 20 ng/μl. The correct size amplicons were recovered from 1.8% agarose gels and purified using QIAquick Gel Extraction Kit (28704, Qiagen, Hilden, Germany) according to the manufacturer’s instructions and quantified using the QubiT PicoGreen dsDNA assay kit (Invitrogen, Grand Island, USA). Purified amplicons were paired-end (2×250 bp) sequenced on an Illumina Miseq platform at Majorbio company (Shanghai, China).
Sequence analysis
Sequences were processed using the open-source QIIME package, version 1.8 [26]. Data including uncorrectable barcodes, ambiguous bases, and low-quality reads were removed. Operational taxonomic units (OTUs) were picked at 97% identity using Usearch V7.1 [27]. The taxonomic assignment of each OTU was performed against the Greengenes reference taxonomy (Greengenes 13.8). Chao1 and Shannon were used to estimate the community richness and diversity, respectively. Principal coordinate analysis (PCoA) was conducted on the UnWeighted Unifrac distance metric. PICRUSt was used to predict the molecular function of the samples based on 16S rRNA data [28]. The sequence data deposited in EMBL-EBI European Nucleotide Archive (ENA, https://www.ebi.ac.uk/ena/submit/sra) under accession number PRJEB11872.
Calculations and statistical analysis
The calculations of ammonia-N (mg/d), NAN (mg/d), microbial N flow (mg/d), and proportion of microbial N derived from ammonia-N (%) were performed according to Carro and Miller, [19]. The raw data were collected in Excel 2010. The significance under different fractions was analyzed using SPSS 17.0 with One-Way ANOVA model. The significance value was selected at a 0.05 level. The Tukey-Kramer test was used to evaluate differences between different mean times.
Results and Discussion
Average values of effluent volume, pH, and substrate digestibility were summarized in Table 2. Because our main aim was to investigate the difference between yak and cattle species, a similar pH under two treatments would maintain a stable environment (Table 2). No differences in effluent volume, apparent disappearance of dry matter (DM), organic matter (OM), and neutral detergent fiber (NDF) were found between the two species (P>0.05).
Table 2. Effect of animal species on the level of the pH and amount of apparent disappearance under same low nitrogen diet in Rusitec fermenters.
| Item | Cattle | Yak | SEM | P-value |
|---|---|---|---|---|
| Effluent, L/d | 0.775 | 0.781 | 00024 | 0.776 |
| pH before feeding | 6.84 | 6.82 | 0.02 | 0.383 |
| Apparent ruminal digestibility, % | ||||
| DM | 42.2 | 40.9 | 1.10 | 0.245 |
| NDF | 68.9 | 69.6 | 1.95 | 0.69 |
| OM | 41.9 | 40.4 | 1.09 | 0.192 |
DM-dry matter; NDF- neutral detergent fiber; OM-organic matter.
To our knowledge, this is the first study in which yak and cattle species were compared using Rusitec fermenters to investigate differences in methane production. The total amounts of gas and methane were higher in fermenters used rumen fluid from cattle, showing 27% and 32% increases in production, respectively (Table 3). However, the results were still lower than those of other studies in Rusitec fermenters [18, 29]. Under the same diet conditions, the donor animal was the main reason for the differences in gas and methane production [30].
Table 3. CH4 production and volatile fatty acids (VFA) in Rusitec fermenters (means for the whole experimental period).
| Item | Cattle | Yak | SEM | P-value |
|---|---|---|---|---|
| Total gas production, mmol/d | 50.6 | 39.7 | 3.990 | 0.010 |
| CH4, mmol/d | 6.2 | 4.7 | 0.602 | 0.023 |
| CH4 per g DM, mmol/g DM intake | 0.33 | 0.26 | 0.026 | 0.032 |
| CH4 per g OM intake, mmol/g OM intake | 0.35 | 0.27 | 0.026 | 0.034 |
| CH4 per g DM, mmol/g digestible DM | 1.11 | 0.84 | 0.109 | 0.019 |
| CH4 per g DM, mmol/g digestible OM | 0.85 | 0.68 | 0.082 | 0.049 |
| H2, mmol/d | 0.86 | 0.28 | 0.099 | 0.017 |
| Total VFA production, mmol/d | 38.1 | 46.6 | 5.420 | 0.127 |
| Molar proportion (mol/100 mol) | ||||
| Acetate | 50.1 | 49.4 | 0.864 | 0.424 |
| Propionate | 32.3 | 31.8 | 0.994 | 0.650 |
| Butyrate | 12.1 | 13.7 | 0.468 | 0.002 |
| Isobutyrate | 0.253 | 0.258 | 0.091 | 0.956 |
| Valerate | 3.81 | 3.76 | 1.012 | 0.965 |
| Isovalerate | 1.46 | 1.06 | 0.158 | 0.019 |
| Acetate: Propionate | 1.55 | 1.57 | 0.062 | 0.681 |
| H recovery, % | 85.56 | 73.91 | 3.703 | 0.004 |
DM-dry matter; OM-organic matter.
Total volatile fatty acids (VFA) and VFA profiles (acetate, propionate, isobutyrate, valerate, and acetate to propionate ratio) showed no observable differences between the two species (P>0.05, Table 3). Butyrate and isovalerate were affected by the two species. Butyrate was higher with yak species than cattle species. In contrast, isovalerate was lower in yak species (P<0.05, Table 3). Previously, the propionate, butyrate, and acetate to propionate ratios were affected by the donor animals of cow and sheep [30]. The different results could be due to several reasons, including the microbial composition of the rumen ecosystem [31]. Hydrogen recovery was higher in cattle species than yak species, meaning that more hydrogen was used by microbes in cattle species (P<0.05, Table 3).
Microbial growth is one of the key measurements in an in vitro system because of the important roles played by microbes in host health and energy supply [32]. A suitable marker is very important for differentiating microbial nitrogen from different parts of feed degradation. In the present study, 15N was selected as marker due to its accuracy [33]. As shown in Table 4, no differences were observed in ammonia production, daily production of non-NH3 N, flows of microbial nitrogen, and SAM nitrogen derived from ammonia-N (P>0.05). Although 15N enrichment of NH3-N and LAM were lower in cattle species than in yak species, the proportion of LAM nitrogen derived from ammonia-N was greater for cattle species (P<0.05). However, a lower enrichment of the SAM was found in both cattle and yak species compared with the LAM, which was in agreement with the previous comparative report regarding Merino sheep and Rusitec fermenters [32]. The 15N enrichment was lower in the SAM than in the LAM (the mean values were 0.5210 and 1.5298 atom% in excess in cattle species, respectively, and 0.5842 and 1.7620 atom% in excess in yak species, respectively). The LAM was located in free rumen fluid and SAM was loosely/tightly attached to feed particles and associated with feed surfaces, where the ammonia concentration may be lower on the surfaces of feed particles than in the rumen fluid. As a consequence of the differences in 15N enrichment between the LAM and the SAM, the percent of microbial nitrogen derived from NH3-N was lower in the SAM than in the LAM in both cattle and yak species (Table 4). The results of the nitrogen differences in the SAM and LAM suggested that these two different parts should be taken into account to obtain a more reliable result in determining microbial protein production in further studies.
Table 4. Nitrogen content and daily production of ammonia-N, NAN, and microorganisms, the proportion of microbial N derived from ammonia in Rusitec fermenters.
| Item | cattle | yak | SEM | P-value |
|---|---|---|---|---|
| Ammonia-N, mg/d | 59.4 | 48.8 | 7.119 | 0.178 |
| NAN, mg/d | 96.7 | 102.2 | 3.984 | 0.204 |
| Microbial N flow, | ||||
| Total microorganisms, mg/d | 72.1 | 76.4 | 4.044 | 0.338 |
| LAM, mg/d | 35.6 | 34.4 | 3.422 | 0.737 |
| SAM, mg/d | 36.5 | 42.0 | 5.021 | 0.318 |
| SAM % of total | 50.6 | 54.5 | 4.750 | 0.444 |
| N content of LAM, mg/g DM | 59.8 | 62.7 | 2.786 | 0.394 |
| N content of SAM, mg/g DM | 62.4 | 64.8 | 0.973 | 0.114 |
| 15N enrichment, atoms % excess | ||||
| LAM | 1.5298a | 1.7620a | 0.053 | 0.015 |
| SAM | 0.5210b | 0.5842b | 0.043 | 0.276 |
| Ammonia-N | 3.2416 | 4.0361 | 0.067 | 0.001 |
| Proportion of microbial N derived from ammonia-N, % | ||||
| LAM | 47.2a | 43.7a | 1.25 | 0.049 |
| SAM | 16.1b | 14.5b | 1.41 | 0.367 |
DM-dry matter; LAM-liquid-associated microorganisms; SAM- solid-associated microorganisms; NAN- non-ammonia nitrogen.
a-bMeans within a column without common superscript letters differ between LAM and SAM (P < 0.05).
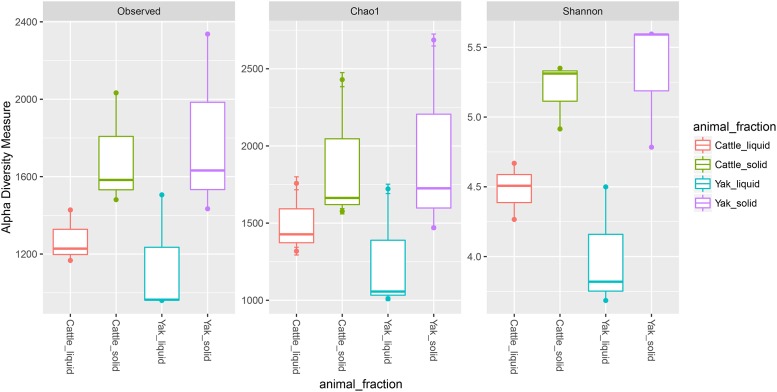
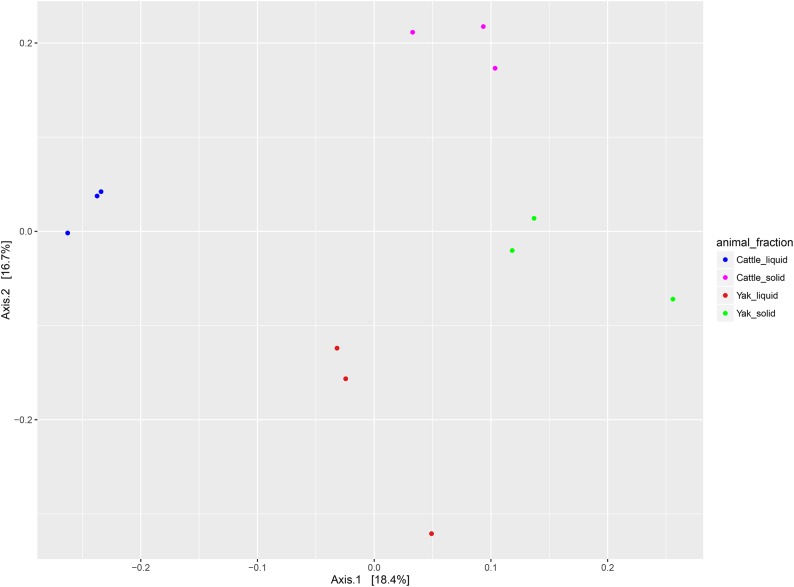
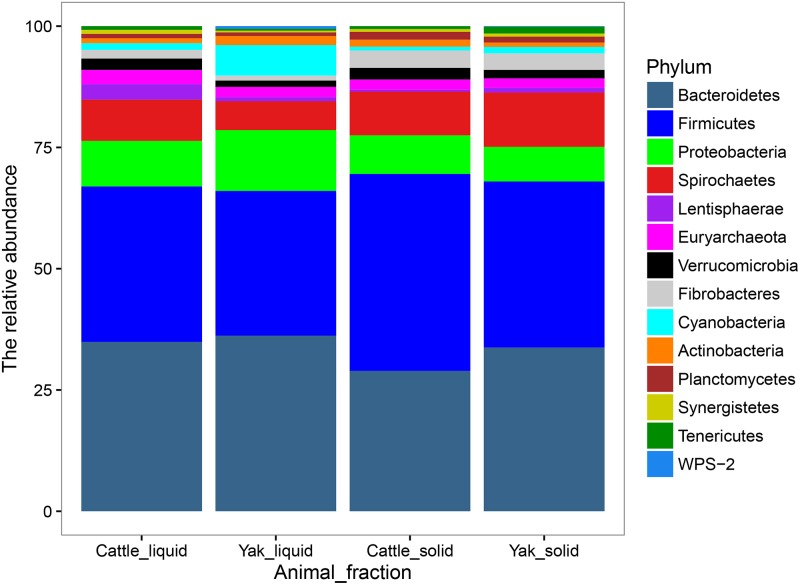
Considering the observed differences in gas production, digestibility, and microbial growth, the microbial composition may be the main reason for these results. Thus, we isolated genomic DNA from the LAM and SAM. A culture-independent method, next generation sequencing technology using Miseq-250 platform, was used to assess the microbial community structures. After quality control, a total of 962,074 reads were obtained for the V4 16S rRNA sequences, with an average of 80, 172 ± 6392 (SD) per sample. The average length of the sequence reads was 273 bp. The number of OTUs observed in this study reached 9, 794 based on a similarity threshold of 97% at species level. No differences were found for all alpha-diversity index between yak and cattle species from same fraction in Rusitec fermenters (P>0.05, Fig 1), which was consistent with the previous comparison study of low and high methane production cattle [34]. However, alpha diversity index of the solid-associated microbes from the same animal group was higher than that of liquid-associated microbes. The lowest values of alpha diversity were found in the rumen liquid-associated microbes of yak species. The PCoA analysis using the UnWeighted Unifrac metric indicated that the samples clustered according to the different parts in Rusitec fermenters with different animals (Fig 2). In total, 14 phyla were identified as being distributed across all the samples in Rusitec fermenters (Fig 3). Bacteroidetes, Firmicutes, Spirochaetes, and Proteobacteria were dominant phyla, regardless of the group (Fig 3), but their proportions varied among the groups, as has been found by many others regarding rumen microbe studies [34]. Six phyla were affected by different animal fractions (Proteobacteria, Spirochaetes, Lentisphaerae, Verrucomicrobia, Fibrobacteres and Cyanobacteria) (P<0.05, S1 Table). The phylum Proteobacteria was the highest in the LAM and lowest in the SAM of yak species. Cyanobacteria, Spirochaetes, and Lentisphaerae were the highest in LAM of yak species, SAM of yak species, and LAM of cattle species, separately. The Fibrobacteres was higher in SAM parts than in LAM regardless of different animals. Because Fibrobacteres was most important fiber degradation microbiomes [35]. Verrucomicrobia was higher in cattle than yak species regardless of the fractions.
Fig 1. Changes in alpha diversity values among different groups.
Fig 2. Principal coordinate analysis (PCoA) of the microbiota community based on UnWeighted Unifrac distance.
Fig 3. The impact of different fractions in Rusitec fermenters on the microbiota composition.
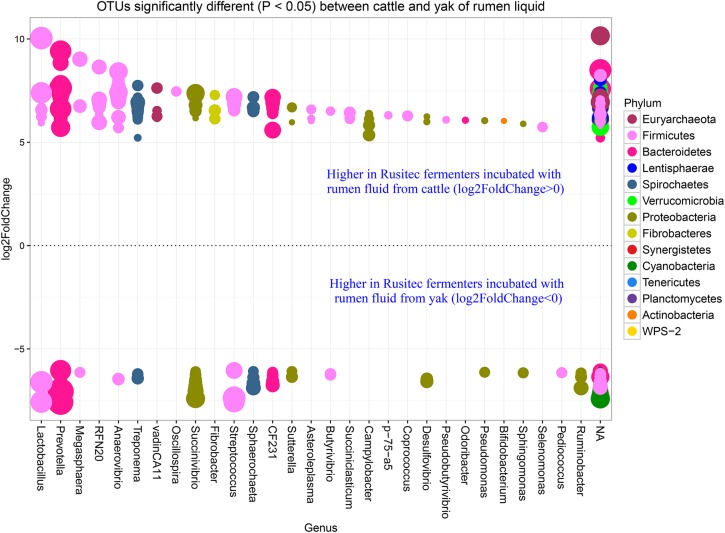
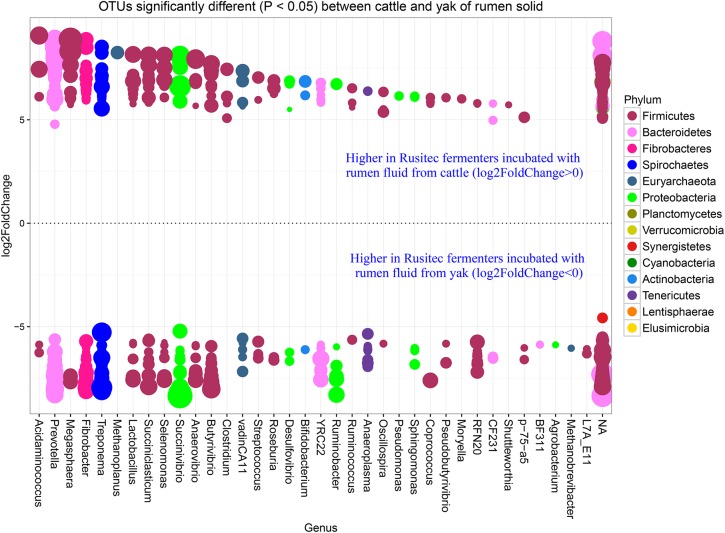
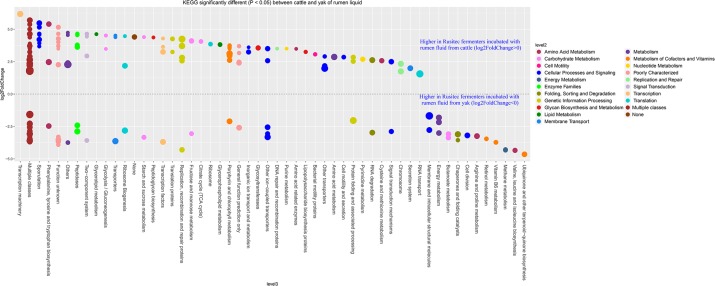
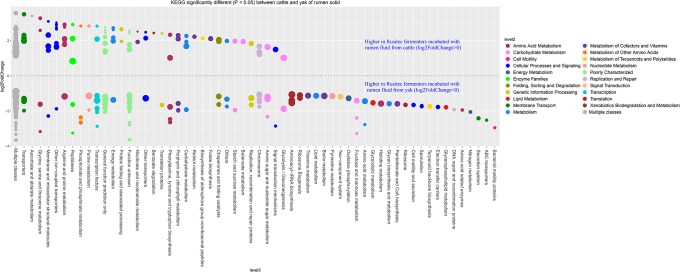
In our study, yak produced less methane than cattle with the same diet in vitro semi-continuous culture system (Rusitec). Thus, we want to know the difference at genus level between yak and cattle with the same fractions. The fold2changes were showed in Figs 4 and 5. RFN20, vadinCA11, Fibrobacter, Asteroleplasma, Succiniclasticum, Campylobacter, p−75−a5, Coprococcus, Pseudobutyrivibrio, Odoribacter, Bifidobacterium, and Selenomonas were higher in LAM of cattle and only Pediococcus and Ruminobacter were higher in LAM of yak species. Methanoplanus, Clostridium, Pseudomonas, Moryella, and Shuttleworthia were higher in SAM of cattle species and BF311, Agrobacterium, Methanobrevibacter, and L7A_E11 were higher in SAM of yak species. Higher abundances of bacteria as H2 producers existed in cattle species, such as Coprococcus, Succiniclasticum, and Clostridium [36]. However, the dominant methanogen genus Methanobrevibacter was higher in the SAM of yak than cattle species [37]. While the new order of methanogen Methanomassiliicoccales (Genus vadinCA11) was higher in LAM of cattle species. The difference between cattle and yak species was not linked regularly with the methane production. That might be the reason of more diversity of bacteria existed in the cattle fermenters, which contributed to the substrate needed by methanogen Methanomassiliicoccales. There were a few higher abundance bacteria in the yak species, which would produce less H2, in agreement with the less H2 production of yak compare with cattle (Table 3). In order to confirm the function difference between yak and cattle species, we used PICRUSt to predict the function of the microbiomes based on 16S RNA sequenced data (Figs 6 and 7). The result showed that many functions were different between two species (Figs 6 and 7), however, we just focused on the ones about nutrition and energy metabolism to discuss. Energy metabolism, vitamin B6 metabolism, and methane metabolism were higher in LAM of yak species. The higher methane metabolism function in LAM of yak might be the consequence of less diversity of microbiome existed (Fig 1). That difference might be the consequence of the in vitro study limits. In future, in vivo study should be conducted to compare the methane difference between yak and cattle. However, the predicted functions involved in sugar, fat, protein and amino acid were higher in LAM of cattle species. Vitamin B6 metabolism was higher in the yak species, which might be the consequence of the higher relative abundance of phylum Cyanobacteria [38]. Twenty-six predicted functions were higher in SAM of yak than cattle species, indicating more microbiome pathways existed to help yak to adapt the harsh environment. The further study should be conducted to confirm this hypothesis.
Fig 4. OTUs counts significantly different (P < 0.05) between cattle and yak of rumen liquid.
The size of the dot represents the value of the OTU, the higher value of the OTU number, the bigger size of the dot. The P value was modified by p.adjust value.
Fig 5. OTUs counts significantly different (P < 0.05) between cattle and yak of rumen solid.
The size of the dot represents the value of the OTU, the higher value of the OTU number, the bigger size of the dot. The P value was modified by p.adjust value.
Fig 6. Predicted KEGG functions count significantly different (P < 0.05) between cattle and yak of rumen liquid.
The size of the dot represents the value of the function genes, the higher value of the function genes number, the bigger size of the dot. The P value was modified by p.adjust value. The predicted data was generated by PICRUSt, the analysis and figure were conducted by R (3. 2. 3).
Fig 7. Predicted KEGG functions count significantly different (P < 0.05) between cattle and yak of rumen solid.
The size of the dot represents the value of the function genes, the higher value of the function genes number, the bigger size of the dot. The P value was modified by p.adjust value. The predicted data was generated by PICRUSt, the analysis and figure were conducted by R (3. 2. 3).
In conclusion, the results showed that yak was potential “low carbon” ruminant. The different microbe compositions correlated with methane emissions. The data might be used to manipulate or provide useful information to reduce the environmental effects of other ruminants.
Supporting Information
a-c Means within a row without common superscript letters differ under different treatmens (P < 0.05).
(XLSX)
Acknowledgments
Authors thank the farmer Liu Deli who helped collect rumen fluid in this study. We thank Xu Liu for collecting samples in this study. We also thank Stuart Denman who helped to teach JM the technology about QIIME and R.
Data Availability
The sequence data were deposited in EMBL-EBI European Nucleotide Archive (ENA, https://www.ebi.ac.uk/ena/submit/sra) under accession number PRJEB11872.
Funding Statement
This work was partially supported by China Scholarship Council (201406180022), National Nature Science Foundation of China(31170378;31500101), Research Fund for the Doctoral Program of Higher Education (20120211110030), and Fundamental Research Funds for the Central Universities (lzujbky-2013-78). The funders had no role in study design, data collection and analysis, decision to publish, or preparation of the manuscript.
References
- 1.Chen GQ, Zhang B. Greenhouse gas emissions in China 2007: Inventory and input–output analysis. Energy Policy. 2010;38(10): 6180–93. 10.1016/j.enpol.2010.06.004. [DOI] [Google Scholar]
- 2.Zhang B, Chen GQ. Methane emissions by Chinese economy: Inventory and embodiment analysis. Energy Policy. 2010;38(8): 4304–16. 10.1016/j.enpol.2010.03.059. [DOI] [Google Scholar]
- 3.Plattner GK, Tignor M, Allen S, Boschung J, Nauels A, Xia Y, et al. Climate change 2013: the physical science basis. Contribution of Working Group I to the Fifth Assessment Report of the Intergovernmental Panel on Climate Change, 2013; pp. 172–173.
- 4.Johnson KA, Johnson DE. Methane emissions from cattle. J Anim Sci. 1995;73(8): 2483–92. [DOI] [PubMed] [Google Scholar]
- 5.Knapp JR, Laur GL, Vadas PA, Weiss WP, Tricarico JM. Invited review: Enteric methane in dairy cattle production: quantifying the opportunities and impact of reducing emissions. J Dairy Sci. 2014;97(6): 3231–61. 10.3168/jds.2013-7234 [DOI] [PubMed] [Google Scholar]
- 6.Rooke JA, Wallace RJ, Duthie CA, McKain N, de Souza SM, Hyslop JJ, et al. Hydrogen and methane emissions from beef cattle and their rumen microbial community vary with diet, time after feeding and genotype. Br J Nutr. 2014;112(3): 398–407. 10.1017/S0007114514000932 [DOI] [PubMed] [Google Scholar]
- 7.Shi W, Moon CD, Leahy SC, Kang D, Froula J, Kittelmann S, et al. Methane yield phenotypes linked to differential gene expression in the sheep rumen microbiome. Genome Res. 2014;24(9): 1517–25. 10.1101/gr.168245.113 [DOI] [PMC free article] [PubMed] [Google Scholar]
- 8.Pope PB, Smith W, Denman SE, Tringe SG, Barry K, Hugenholtz P, et al. Isolation of Succinivibrionaceae implicated in low methane emissions from Tammar wallabies. Science. 2011;333(6042): 646–8. 10.1126/science.1205760 [DOI] [PubMed] [Google Scholar]
- 9.Ding X, Long R, Kreuzer M, Mi J, Yang B. Methane emissions from yak (Bos grunniens) steers grazing or kept indoors and fed diets with varying forage: concentrate ratio during the cold season on the Qinghai-Tibetan Plateau. Anim Feed Sci Tech. 2010;162(3): 91–8. [Google Scholar]
- 10.Thorpe A. Enteric fermentation and ruminant eructation: the role (and control?) of methane in the climate change debate. Climatic Change. 2009;93(3–4): 407–31. [Google Scholar]
- 11.Wiener G, Jianlin H, Ruijun L. The yak: FAO Regional Office for Asia and the Pacific; 2003.
- 12.Guo XS, Zhang Y, Zhou JW, Long RJ, Xin GS, Qi B, et al. Nitrogen metabolism and recycling in yaks (Bos grunniens) offered a forage–concentrate diet differing in N concentration. Anim Pro Sci. 2012;52(5): 287–96. [Google Scholar]
- 13.Shao B, Long R, Ding Y, Wang J, Ding L, Wang H. Morphological adaptations of yak (Bos grunniens) tongue to the foraging environment of the Qinghai-Tibetan Plateau. J Anim Sci. 2010;88(8): 2594–603. 10.2527/jas.2009-2398 [DOI] [PubMed] [Google Scholar]
- 14.Qiu Q, Zhang G, Ma T, Qian W, Wang J, Ye Z, et al. The yak genome and adaptation to life at high altitude. Nat Genet. 2012;44(8): 946–9. 10.1038/ng.2343 [DOI] [PubMed] [Google Scholar]
- 15.Shibata M, Terada F. Factors affecting methane production and mitigation in ruminants. Anim Sci J. 2010;81(1): 2–10. 10.1111/j.1740-0929.2009.00687.x [DOI] [PubMed] [Google Scholar]
- 16.Hristov AN, Lee C, Hristova R, Huhtanen P, Firkins JL. A meta-analysis of variability in continuous-culture ruminal fermentation and digestibility data. J Dairy Sci. 2012;95(9): 5299–307. 10.3168/jds.2012-5533 [DOI] [PubMed] [Google Scholar]
- 17.Makkar HP, Vercoe PE, Joint F. Measuring methane production from ruminants: Springer; 2007. [Google Scholar]
- 18.Martinez ME, Ranilla MJ, Ramos S, Tejido ML, Carro MD. Effects of dilution rate and retention time of concentrate on efficiency of microbial growth, methane production, and ruminal fermentation in Rusitec fermenters. J Dairy Sci. 2009;92(8): 3930–8. 10.3168/jds.2008-1975 [DOI] [PubMed] [Google Scholar]
- 19.Carro MD, Miller EL. Effect of supplementing a fibre basal diet with different nitrogen forms on ruminal fermentation and microbial growth in an in vitro semi-continuous culture system (RUSITEC). Br J Nutr. 1999;82(2): 149–57. 20. [DOI] [PubMed] [Google Scholar]
- 20.Minato H, SutoUTO T. Technique for fractionation of bacteria in rumen microbial ecosystem. II. Attachment of bacteria isolated from bovine rumen to cellulose powder in vitro and elution of bacteria attached therefrom. J Gen Appl Microbiol. 1978;24(1): 1–16. [Google Scholar]
- 21.Ranilla M, Carro M. Diet and procedures used to detach particle-associated microbes from ruminal digesta influence chemical composition of microbes and estimation of microbial growth in Rusitec fermenters. J Animal Sci. 2003;81(2): 537–44. [DOI] [PubMed] [Google Scholar]
- 22.Helrich K. Official methods of Analysis of the AOAC: Association of Official Analytical Chemists Inc.; 1990. [Google Scholar]
- 23.Van Soest Pv, Robertson J, Lewis B. Methods for dietary fiber, neutral detergent fiber, and nonstarch polysaccharides in relation to animal nutrition. J Dairy Sci. 1991;74(10): 3583–97. 10.3168/jds.S0022-0302(91)78551-2 [DOI] [PubMed] [Google Scholar]
- 24.Caporaso JG, Lauber CL, Walters WA, Berg-Lyons D, Lozupone CA, Turnbaugh PJ, et al. Global patterns of 16S rRNA diversity at a depth of millions of sequences per sample. P Natl Acad Sci USA. 2011;108(Supplement 1): 4516–22. [DOI] [PMC free article] [PubMed] [Google Scholar]
- 25.Kozich JJ, Westcott SL, Baxter NT, Highlander SK, Schloss PD. Development of a dual-index sequencing strategy and curation pipeline for analyzing amplicon sequence data on the MiSeq Illumina sequencing platform. Appl Environ Microb. 2013;79(17): 5112–20. [DOI] [PMC free article] [PubMed] [Google Scholar]
- 26.Caporaso JG, Kuczynski J, Stombaugh J, Bittinger K, Bushman FD, Costello EK, et al. QIIME allows analysis of high-throughput community sequencing data. Nat Methods. 2010;7(5): 335–6. 10.1038/nmeth.f.303 [DOI] [PMC free article] [PubMed] [Google Scholar]
- 27.Edgar RC. UPARSE: highly accurate OTU sequences from microbial amplicon reads. Nat Methods. 2013;10(10): 996–8. 10.1038/nmeth.2604 [DOI] [PubMed] [Google Scholar]
- 28.Langille MGI, Zaneveld J, Caporaso JG, McDonald D, Knights D, Reyes JA, et al. Predictive functional profiling of microbial communities using 16S rRNA marker gene sequences. Nat Biotech. 2013;31(9): 814–21. [DOI] [PMC free article] [PubMed] [Google Scholar]
- 29.García-González R, González JS, López S. Decrease of ruminal methane production in Rusitec fermenters through the addition of plant material from rhubarb (Rheum spp.) and alder buckthorn (Frangula alnus). J Dairy Sci. 2010;93(8): 3755–63. 10.3168/jds.2010-3107 [DOI] [PubMed] [Google Scholar]
- 30.Boguhn J, Zuber T, Rodehutscord M. Effect of donor animals and their diet on in vitro nutrient degradation and microbial protein synthesis using grass and corn silages. J Anim Physiol An N. 2013;97(3): 547–57. [DOI] [PubMed] [Google Scholar]
- 31.Jewell KA, McCormick CA, Odt CL, Weimer PJ, Suen G. Ruminal bacterial community composition in dairy cows is dynamic over the course of two lactations and correlates with feed efficiency. Appl Environ Microb. 2015;81(14): 4697–710. [DOI] [PMC free article] [PubMed] [Google Scholar]
- 32.Martínez M, Ranilla MJ, Tejido ML, Ramos S, Carro M. Comparison of fermentation of diets of variable composition and microbial populations in the rumen of sheep and Rusitec fermenters. I. Digestibility, fermentation parameters, and microbial growth. J Dairy Sci. 2010;93(8): 3684–98. 10.3168/jds.2009-2933 [DOI] [PubMed] [Google Scholar]
- 33.Carro MD, Miller EL. Comparison of microbial markers (1 5N and purine bases) and bacterial isolates for the estimation of rumen microbial protein synthesis. Anim Sci. 2002;75(2): 315–22. [Google Scholar]
- 34.Wallace RJ, Rooke JA, McKain N, Duthie C-A, Hyslop JJ, Ross DW, et al. The rumen microbial metagenome associated with high methane production in cattle. BMC Genomics. 2015;16(1):1. [DOI] [PMC free article] [PubMed] [Google Scholar]
- 35.Ransom-Jones E, Jones DL, McCarthy AJ, McDonald JE. The Fibrobacteres: an important phylum of cellulose-degrading bacteria. Microb Ecol. 2012;63(2): 267–81. 10.1007/s00248-011-9998-1 [DOI] [PubMed] [Google Scholar]
- 36.Kittelmann S, Pinares-Patiño CS, Seedorf H, Kirk MR, Ganesh S, McEwan JC, et al. Two different bacterial community types are linked with the low-methane emission trait in sheep. PloS One. 2014;9(7): e103171 10.1371/journal.pone.0103171 [DOI] [PMC free article] [PubMed] [Google Scholar]
- 37.Henderson G, Cox F, Ganesh S, Jonker A, Young W, Janssen PH. Rumen microbial community composition varies with diet and host, but a core microbiome is found across a wide geographical range. Sci Rep-UK. 2015;5: 14567. [DOI] [PMC free article] [PubMed] [Google Scholar]
- 38.Di Rienzi SC, Sharon I, Wrighton KC, Koren O, Hug LA, Thomas BC, et al. The human gut and groundwater harbor non-photosynthetic bacteria belonging to a new candidate phylum sibling to Cyanobacteria. eLife. 2013;2: e01102 10.7554/eLife.01102 [DOI] [PMC free article] [PubMed] [Google Scholar]
Associated Data
This section collects any data citations, data availability statements, or supplementary materials included in this article.
Supplementary Materials
a-c Means within a row without common superscript letters differ under different treatmens (P < 0.05).
(XLSX)
Data Availability Statement
The sequence data were deposited in EMBL-EBI European Nucleotide Archive (ENA, https://www.ebi.ac.uk/ena/submit/sra) under accession number PRJEB11872.


