Abstract
Benzene is metabolized to hydroquinone in liver and subsequently transported to bone marrow for further oxidization to 1,4-benzoquinone (1,4-BQ), which may be related to the leukemia and other blood disorders. In the present study, we investigated the proteome profiles of human primary bone marrow mesenchymal stem cells (hBM-MSCs) treated by 1,4-BQ. We identified 32 proteins that were differentially expressed. Two of them, HSP27 and Vimentin, were verified at both mRNA and protein levels and their cellular localization was examined by immunofluorescence. We also found increased mRNA level of RAP1GDS1, a critical factor of metabolism that has been identified as a fusion partner in various hematopoietic malignancies. Therefore, these differentially expressed proteins can play important roles in benzene-mediated hematoxicity.
1. Introduction
Benzene, a volatile solvent and ubiquitous contaminant in indoor air or outdoor environment, comes mostly from traffic emissions, followed by the production of oil and fuel. Exposure to benzene causes leukemia and other blood disorders, such as aplastic anemia, myelodysplasia, and malignant lymphoma [1, 2]. Recent studies further demonstrated that long-term occupational or environmental exposure to low levels of benzene can also lead to blood disorders [3]. Previous studies have shown that mechanisms of benzene effect on hematopoietic disorders are complex, including DNA damage, DNA methylation, genomic instability, and apoptosis [4, 5]. Both animal and human exposure studies of benzene toxicity found biotransformation from parent compounds to reactive species. Benzene itself does not have genotoxicity [6]. As described by the US Environmental Protection Agency (EPA, 1998), benzene transferring to phenolic metabolites (phenol, catechol, and hydroquinone) in the liver is an important primary event of benzene toxicity. These metabolites are then transported to bone marrow, a source of peroxidases. Among those peroxidases, myeloperoxidase is found with particularly high concentrations, which activates hydroquinone to 1,4-benzoquinone (1,4-BQ), a more reactive species of benzene [6]. However, to date, mechanisms of benzene toxicity in haematology are still obscure.
It is not yet clear if 1,4-BQ is responsible for benzene toxicity. Recent study showed that the DNA damage or cytotoxicity caused by benzene may be attributed to the production of reactive oxygen species (ROS), which lead to adducts of protein and DNA, DNA strand breaks, and inhibition of DNA repair. ROS induced by benzene's metabolites cause the hematopoietic disorders. In previous study, 1,4-BQ induced ROS in chicken erythroblast HD3 cells. It is suggested that benzene may exert its toxicity through ROS-mediated c-myb signaling pathway in vitro [7]. 1,4-BQ also forms adducts of DNA or protein in vitro and in vivo. Gaskell et al. found formation of four major DNA adducts from DNA reaction with 1,4-BQ in vitro [8]. Increased adducts of the albumin (Alb) with 1,4-benzoquinone (1,4-BQ-Alb) were also found in benzene exposed-workers [9, 10]. Analysis of mRNA expression in hematopoietic stem cells (HSCs) of 129/SvJ (129X1/SvJ) mice exposed to 1,4-BQ in vitro showed an altered expression of DNA repair genes when compared to control HSCs [11]. 1,4-BQ is a poison of topoisomerase II which is associated with DNA repair in vitro [12]. If the DNA damage resulting from benzene exposure cannot be properly repaired, cells will undergo apoptosis to prevent proliferation or development of mutated cells that transform into malignancies. Other studies showed that benzene's reactive metabolites such as 1,4-BQ exert their toxic effects through covalent and/or oxidative damage proteins. Proteins related to the benzene and its metabolites-mediated hematoxicity, including CYP2E1, aryl hydrocarbon receptor (AhR), myeloperoxidase, microsomal epoxide hydrolase, quinone oxidoreductase 1 (NQO1), thioredoxin, connexin 43, and topoisomerase [13–15]. These proteins have a diverse range of functions in cell metabolism, oxygen stress, cell signal transaction, and DNA repair.
Previous studies have shown that bone marrow stem cells may be targets of benzene-induced cytotoxicity and DNA damage, leading to hematopoietic disorders and cancers [16–18]. Hematopoietic stem cells (HSCs) in the bone marrow [19] are a small population (<0.05% of BM) of self-renewing, pluripotent cells which give rise to all blood cells. In a previous study, HSCs showed a dose-dependent cytotoxic response to benzene's metabolite-1,4-BQ exposure [16]. Exposure to benzene also arrested the cell cycle of HSCs [20]. It is suggested recently that mesenchymal stem cells (MSCs) in bone marrow, another kind of stem cells, provide structural and functional support for haematopoiesis. MSCs colocalize with HSCs in the bone marrow, forming multipotent and self-renewing mesenspheres, which are required for HSCs maintenance, homing, and migration [19]. Zolghadr et al.'s findings revealed that higher concentrations of BQ induced cell death in MSCs after 24 h of exposure [21]. Our previous study also found that 1,4-BQ not only inhibited the proliferation activity of HSCs but also inhibited the proliferation of MSCs [22]. We speculate that MSCs may be implicated in the initiation, development, and various aspects of hematotoxic damage induced by benzene and its metabolites. The mechanism of MSCs damage caused by benzene and its metabolites is still unclear.
Therefore, the aim of this study was to determine how 1,4-BQ induced changes of protein profiles in hBM-MSCs. It will help us to find novel target proteins and to explore molecular mechanisms of hematopoietic toxicity caused by benzene and its metabolites.
2. Materials and Methods
2.1. hBM-MSCs' Isolation and Cultivation
The study was approved by the Ethics Committee of Zhejiang Academy of Medical Sciences (Zhejiang, China) and conducted in accordance with the Declaration of Helsinki. Written informed consent was obtained from three male volunteers aged between 20 and 40 years prior to the study. Bone marrow from the volunteers with no benzene exposure and any other haematological diseases was collected. Experiments were repeated three times from different donors. Human MSCs were isolated as described previously [23] with modification. Mononuclear cells were isolated by density gradient centrifugation through 1.073 g/ml Ficoll-Paque PREMIUM (GE Healthcare Bio-Science AB, Uppsala, Sweden) at 400 g for 30 min. Mononuclear cells were seeded in culture flask at 1 × 10⁶/ml (a total volume of 5 ml) in low glucose (1.0 g/l) Dulbecco's modified Eagle's medium (Invitrogen Corporation, Carlsbad, CA, USA) supplemented with 10% fetal calf serum and were maintained in 5% CO2 and 95% humidity at 37°C to collect the adherent hBM-MSCs likely cells. After 10 d of culture, adherent cells formed homogenous colonies and were disassociated by 0.05% trypsin and subcultured with a split ratio of 1 : 3. The medium was changed every 2-3 d and hBM-MSCs from passage 3 were used for the following studies.
2.2. Identification of hBM-MSCs by Flow Cytometry Analysis
As described in a previous study [24], after 14 d incubation, hBM-MSCs likely cells were trypsinized into single-cell suspension, counted, and washed with PBS. For identification of hBM-MSCs, phycoerythrin- (PE-) conjugated mouse monoclonal antibody against human CD29, CD34, CD44, and CD45 (BD Biosciences, Franklin Lakes, NJ, USA) was added to cell suspension at concentrations recommended by the manufacturer, and cells were analyzed on a FACSCalibur Flow Cytometry (BD Biosciences). Data were collected using CellQuest Pro™ v5.2. software (BD Biosciences).
2.3. MTT Assay
1,4-BQ (CAS number 106-51-4, 99.5%) was obtained from Sigma-Aldrich (Sigma-Aldrich, St. Louis, MO, USA). Cells were seeded in 96-well plates with the concentration of 1 × 10⁴/ml (100 μl in each well) and treated with 1, 5, 10, 25, 50, 100, 200, 500, and 1000 μM of 1,4-BQ for 24 h. Three independently repeated experiments were performed. Cytotoxic effects of 1,4-BQ on hBM-MSCs were determined using the 3-(4,5-dimethylthiazol-2-yl)-2,5-diphenyl tetrazolium bromide (MTT) assay following previous studies [25, 26].
2.4. Sample Preparation for Two-Dimensional Gel Electrophoresis (2DE)
According to the results of MTT, we selected 10, 25, and 50 μM of 1,4-BQ for 2DE analysis. After being treated with different doses of 1,4-BQ for 24 h, hBM-MSCs were washed with PBS, suspended in 2DE lysis buffer (7 M urea, 2 M thiourea, 4% (wt/vol) CHAPS, 0.5% (v/v) IPG buffer, 50 mM dithiothreitol (DTT), and 1% (v/v) protease inhibitor mix (GE Healthcare, Uppsala, Sweden)). After incubating on ice for 30 min, samples were centrifuged at 13,000 rpm at 4°C for 1 h, and the total soluble proteins were used for subsequent 2DE. Protein quantitative analysis was performed with the Bio-Rad Protein Assay Kit (Bio-Rad, Hercules, CA, USA). All samples were stored at −80°C until further 2DE analysis.
2.5. 2DE Analysis and In-Gel Tryptic Digestion
Protein samples (350 μg each) were dissolved in rehydration buffer (7 M urea, 2 M thiourea, 2% (m/v) CHAPS, 50 mM DTT, and 0.5% (v/v) IPG buffer) and rehydrated with 24 cm IPG strip (pH 5–8, Bio-Rad) for 12 h at 20°C followed by 1D isoelectric focusing (IEF) in a maximum current of 50 μA/IPG strip. The 1D isoelectric focusing (IEF) was performed at 250 V for 0.5 h, 500 V for 1 h, 4000 V for 2 h, 6000 V for 2 h, 8000 V for 2 h, 10000 V for 2 h, and 10000 V for 8 h. The IPG strip was equilibrated twice: first for 15 min in 20 ml equilibration solution I (6 M urea, 2% (m/v) SDS, 0.375 M Tris-HCl (pH 8.8), 20% (v/v) glycerol, and 2% (m/v) DTT); second in equilibration solution II (2.5% (m/v) iodoacetamide instead of 2% (m/v) DTT). For the 2D electrophoresis, the equilibrated IPG strips were placed on top of 10% SDS-polyacrylamide gels (SDS-PAGE) and sealed with 0.5% agarose in SDS running buffer. SDS-PAGE was performed for 30 min at a constant current of 20 mA/gel and then 30 mA/gel until the bromophenol blue dye front reached the lower edge of the gel. After electrophoresis, gels were fixed and stained by using Protein Silver Staining Kit (GE Healthcare, Uppsala, Sweden) according to instructions. Images of the silver-stained 2DE gels were collected by using ImageScanner III (GE Healthcare) and analyzed by using Imagemaster software (Version 6.0, GE Healthcare). All protein spots were detected with the same settings of brightness, contrast, and color to minimize bias. The raw quantity of each spot in a member gel was divided by the total quantity of valid spots in the gel. After data analysis, protein spots that were differentially expressed (>1.5-fold, P < 0.05) were excised from the gels for in-gel digestion as described previously [27].
2.6. Liquid Chromatography Coupled with Tandem Mass Spectrometry (LC-MS/MS)
The separation and identification of digested protein were conducted by a Finnigan linear trap quadrupole (LTQ) mass spectrometer (Thermo Finnigan, San Jose, CA) coupling with a high performance liquid chromatography (HPLC) system (Thermo Finnigan) according to Stastna et al. [28]. Solvent A was 0.1% (v/v) formic acid, and solvent B was 0.1% v/v formic acid in 80% v/v acetonitrile. The gradient was held at 95% solvent A for 15 min and increased linearly from 5% solvent B to 100% solvent B in 50 min. The peptides were eluted from C18 microcapillary column at flow rate of 150 μl per min. Protein identification using MS/MS raw data was performed with the BioworksBrowser rev.3.1 software (Thermo Electron, San Jose) based on the human Uniprot database.
2.7. Western Blot Analysis
After treatment, the total proteins of hBM-MSCs were extracted with SDS sample buffer and boiled for 5–10 min at 95–100°C. Western blot was performed according to the previous studies [29, 30]. Proteins were detected with antibodies including polyclonal anti-human Vimentin, monoclonal anti-human HSP27 (Cell Signaling Technology, Inc. Danvers, MA, USA), polyclonal human GAPDH (Santa Cruz Biotechnology, CA, USA), and quantified using the FluorChem FC2 system (Alpha Innotech Corp., Santa Clara, CA, USA).
2.8. Confocal Immunofluorescence Microscopy
As described in previous studies [29, 30], antibodies against HSP27 (1 : 100) and Vimentin (1 : 50) were applied to 1,4-BQ-treated hBM-MSCs, followed by immunofluorescent staining with Alexa Fluor 633 (red)-goat anti-mouse IgG or Alexa Fluor 514 (green)-goat anti-mouse IgG (Invitrogen Corp.). Hoechst33342 (Sigma-Aldrich) was used for nuclear counterstaining. Cell morphology and intracellular localization of protein were analyzed by confocal microscopy (Zeiss LSM710, Jena, Germany) and exported as TIFF files using Zeiss ConfoCor 3 systems.
2.9. Quantitative Real-Time PCR (qRT-PCR)
After treatment, total RNA was extracted from hBM-MSCs using Ultrapure RNA Kit (Cwbiotech, Beijing, China). Reverse transcription was conducted using the RevertAid First Strand cDNA Synthesis Kit (Fermentas, Glen Burmie, MD, USA). To evaluate the mRNA levels of HSP27 and Vimentin, qRT-PCR was performed on LightCycler 2.0 Real-Time PCR System (Roche Diagnostics GmbH, Mannheim, Germany) using SYBR Premix Ex Taq™ Perfect Real-Time kit (Takara, kyoto, Japan). GAPDH was used as an internal control. Relative quantification (RQ) value was calculated using the comparative cycle threshold method (2−ΔΔCt). Three independent experiments were performed to calculate the average RQ and standard deviations (n = 3).
2.10. Statistical Analysis
Each experiment was conducted at least three times. Data were presented as mean ± standard deviation. Statistical analysis was performed using SPSS 18.0 software (SPSS Inc., Shanghai, China). Student's t-test was used for MTT and 2DE analysis, and one-way ANOVA was used for Western blot and quantitative real-time PCR analysis. Significant difference was further analyzed by Dunnett's multiple comparison methods. All probability values were 2-tailed, and P < 0.05 was considered statistically significant.
3. Results
3.1. hBM-MSCs Identification
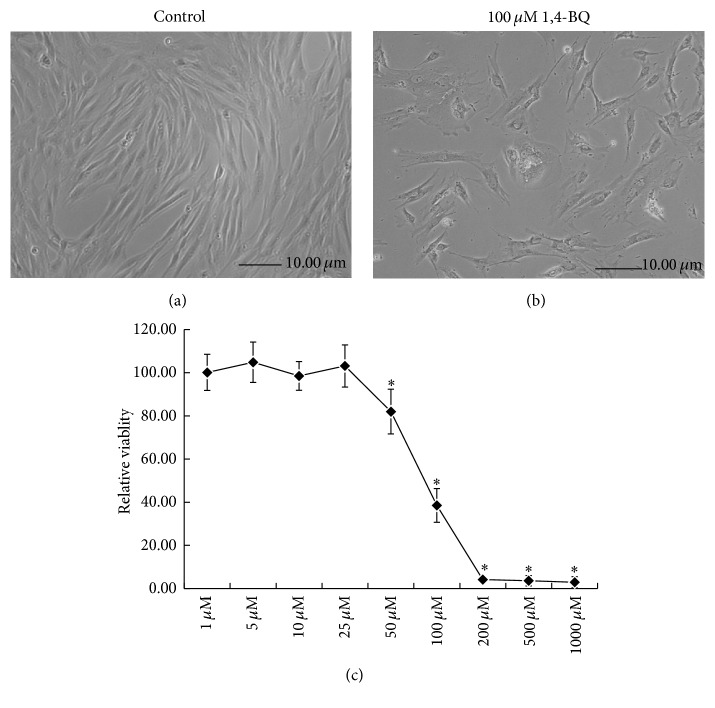
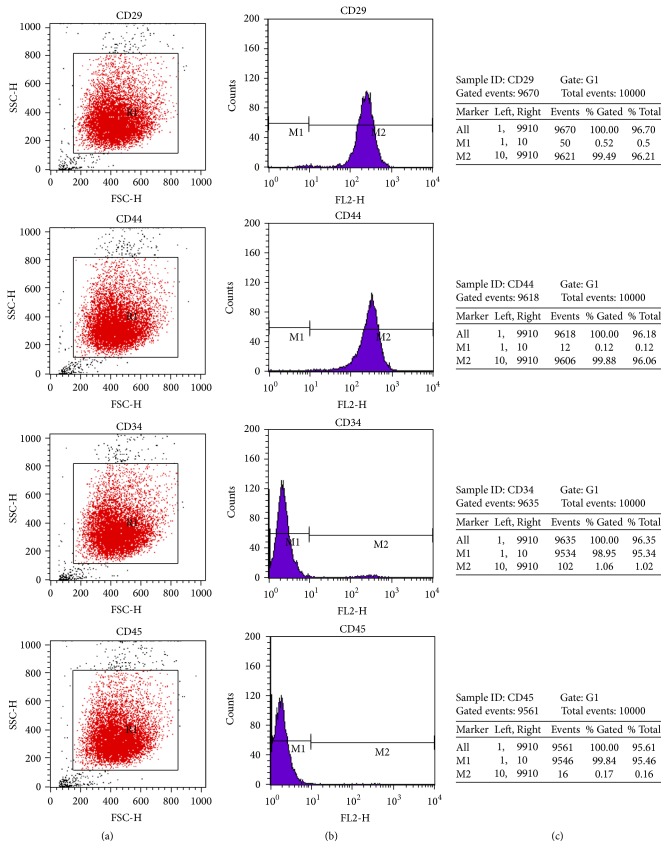
According to the previous study [31], the spindle-like-hBM-MSCs tightly adhered to the flask bottom after 3-d culture. The nonadherent cells can be removed by changing the medium. Larger clones appeared on the 7th day. The fibroblast-like cells with rich cytoplasm and large nucleus began to grow rapidly. Cells became gradually confluent and had a spiral whorl-like outlook (Figure 1(a)). Flow cytometry for analysis of cell surface antigens found the expression of mesenchymal cell markers of CD29 and CD44, instead of hematopoietic stem cell markers of CD34 or CD45 (Figures 2(a) and 2(b)). The positive incidence of CD29 and CD44 was 96.2% and 96.1%, and the negative incidence of CD34 and CD45 was 95.3% and 95.5%, respectively (Figure 2(c)).
Figure 1.
Effect of 1,4-BQ on cell viability of hBM-MSCs. (a) Phase contrast micrographs of normal hBM-MSCs. (b) Phase contrast micrographs of hBM-MSCs treated with 100 μM of 1,4-BQ for 24 h. (c) Dose-dependent effect of 1,4-BQ on cell viability of hBM-MSCs. Cells were treated with 1, 5, 10, 25, 50, 100, 200, 500, and 1000 μM of 1,4-BQ for 24 h. Cell viability of hBM-MSCs was determined by MTT assay. Statistical analysis was performed by one-way ANOVA analysis followed by Dunnett's multiple comparison. ∗ P < 0.05, compared with control.
Figure 2.
Expression of CD29, CD34, CD44, and CD45 on the surface of hBM-MSCs. Flow cytometry analysis was performed to detect the CD29+/CD44+/CD34−/CD45− cell population on day 14 of cell culture. (a) Expression of CD29, CD44, CD34, and CD45 on hBM-MSCs cells from each group. (b) M1 marker gates of the CD29−/CD44−/CD34−/CD45− cells and M2 marker gates of the CD29+/CD44+/CD34+/CD45+ cells. (c) The percentage of the CD29+/CD29−, CD44+/CD44−, CD34+/CD34−, and CD45+/CD45− cells is indicated within the hBM-MSCs cell population.
3.2. Effect of 1,4-BQ on Cell Viability of hBM-MSCs
Cell viability was examined using MTT assay in hBM-MSCs treated with 1, 5, 10, 25, 50, 100, 200, 500, and 1000 μM 1,4-BQ for 24 h. The morphological changes were observed in hBM-MSCs treated with 100 μM 1,4-BQ for 24 h, and many cells were found detached and floated into the medium (Figure 1(b)). In addition, membrane blebbing and cytoplasmic shrinkage were observed; cells were dispersed, and monolayer was not formed (Figure 1(b)). As shown in Figure 1(c), 1,4-BQ significantly inhibited cell viability in hBM-MSCs in a dose-dependent manner (P < 0.05). Cell viability was less than 10% at concentrations of over 200 μM of 1,4-BQ when compared to the control group.
3.3. 2DE Profile of hBM-MSCs
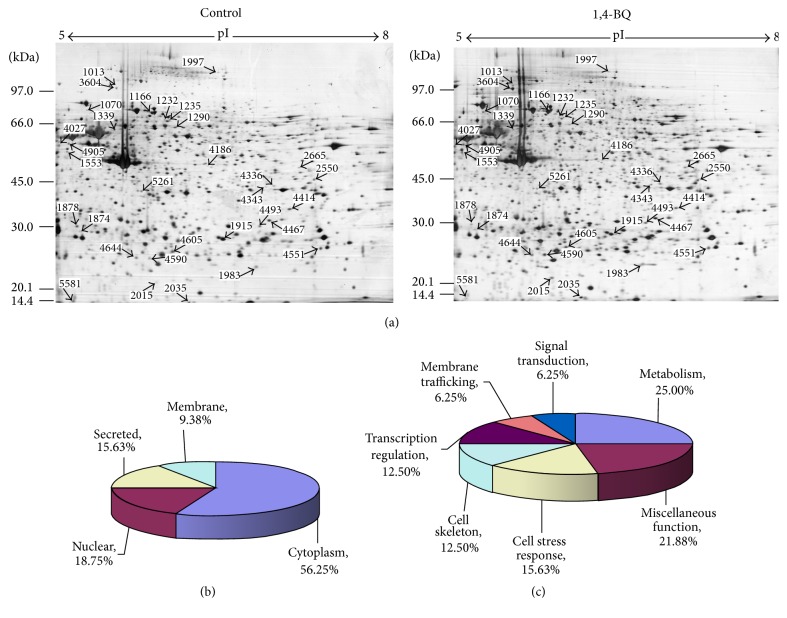
To determine the effect of 1,4-BQ on the proteome of hBM-MSCs, protein profiles were examined and compared between 1,4-BQ-treated and untreated hBM-MSCs. After background subtraction and matching detective spots, the number of protein spots in each group was as follows: 1006 ± 11 in 10 μM of 1,4-BQ treatment group and 1017 ± 16 in the corresponding control group; 1207 ± 5 in 25 μM of 1,4-BQ treatment group and 1190 ± 13 in the corresponding control group; 1053 ± 26 in 50 μM of 1,4-BQ treatment group and 1042 ± 40 in the corresponding control group. The differentially expressed spots were chosen with intensity at least 1.5-fold greater than the corresponding ones on control gels (P < 0.05). As shown in Figure 3(a), 32 protein spots were found differentially expressed between 1,4-BQ-treated groups and control groups.
Figure 3.
Protein profile difference between 1, 4-BQ-treated and control hBM-MSCs. (a) Comparison of protein profiles by two-dimensional gel electrophoresis between 1,4-BQ treated hBM-MSCs and control. Spots that were differentially expressed were analyzed by LC-MS/MS. (b) Identified proteins with differential expression were cytoplasmic, nuclear, membrane-bound, or secreted. (c) Proteins identified by LC-MS/MS are involved in metabolism (25.00%), cell stress response (15.63%), cell skeleton (12.5%), transcription regulation (12.5%), membrane trafficking (6.25%), signal transduction (6.25%), and miscellaneous function (21.88%).
3.4. Identification and Classification of Differentially Expressed Proteins
After image comparison between treatment and control groups, 42 spots showing a clear spatial separation from surrounding spots, sufficient intensity, and consistent spot shape and size were chosen for the identification by LC-MS/MS and 32 of them were successfully identified. Sixteen proteins were upregulated in 1,4-BQ treated groups and the others were downregulated.
The identified proteins can be classified into four categories according to the localization, that is, cytoplasmic, nuclear, membrane-bound, or secreted proteins (Figure 3(b)). Based on their function, 32 proteins can be classified into the following groups: metabolism (25.00%), cell stress response (15.63%), cell skeleton (12.50%), transcription regulation (12.50%), membrane trafficking (6.25%), signal transduction (6.25%), and miscellaneous function (21.87%) (Figure 3(c)). The information of all identified proteins, including protein name, UniPropt ID, function, theoretical MW/pI, ratio of spot volume was listed in Table 1.
Table 1.
Differentially expressed proteins in 1,4-BQ treated hBM-MSCs identified by LC-MS/MSa.
| Spot | Protein name | UniProt ID | Function | Unique peptide count | Theoretical MW/pI | Ratio of spot volume (P-value) | ||
|---|---|---|---|---|---|---|---|---|
| 10 μM | 25 μM | 50 μM | ||||||
| 1878 | Alpha-actin-1 | P68133 | Involved in various types of cell motility | 2 | 42.1/5.23 | −2.0354 (0.0090) | −1.8674 (0.0001) | |
| 1874 | Beta-actin | P60709 | Involved in various types of cell motility | 3 | 41.7/5.29 | −1.7746 (0.0062) | −1.7694 (0.0016) | −1.9527 (0.0002) |
| 1997 | Gelsolin | P06396 | Actin-modulating protein | 3 | 85.7/5.90 | −3.0914 (0.0028) | ||
| 2550 | Creatine kinase M-type (M-CK) | P06732 | Creatine metabolic process | 2 | 43.1/6.77 | −3.0392 (0.0055) | ||
| 2665 | Beta-enolase | P13929 | Glycolysis | 2 | 47.0/7.58 | 1.7390 (0.0080) | ||
| 4590 | Transcription elongation factor B polypeptide 1 | Q15369 | Transcription regulation | 1 | 12.5/4.74 | −1000000 (0.0033) | ||
| 4905 | Isoform 1 of 26S proteasome non-ATPase regulatory subunit 1 | Q99460-1 | Degradation of proteins | 2 | 105.8/5.25 | −1.8721 (0.0251) | ||
| 5581 | Ragulator complex protein LAMTOR2 | Q9Y2Q5 | Signal transduction | 2 | 13.5/5.30 | −1.7177 (0.0132) | ||
| 4027 | Isoform 4 of Crumbs homolog 1 precursor | P82279-4 | Cell-cell signaling | 1 | 104.2/5.45 | −3.2976 (0.0081) | ||
| 4644 | Translocon-associated protein subunit delta | P51571 | Intracellular protein transport | 5 | 20.2/5.53 | −1000000 (0.0001) | ||
| 5261 | TAR DNA-binding protein 43 | Q13148 | transcription regulation | 5 | 44.7/5.85 | 1.6949 (0.0095) | ||
| 4467 | Isoform Short of Proteasome subunit alpha type 1 | P25786-1 | Immunity | 11 | 29.6/6.15 | 1.6421 (0.0024) | ||
| 4414 | Ribose-phosphate pyrophosphokinase 2 | P11908 | Nucleotide biosynthesis | 1 | 34.8/6.15 | 2.1110 (0.0023) | ||
| 4343 | Apolipoprotein L2 | Q9BQE5 | Lipid transport | 4 | 37.1/6.28 | 1.8877 (0.0008) | ||
| 4336 | Transaldolase | P37837 | Energy reserve metabolic process | 4 | 37.5/6.36 | 1.5618 (0.0050) | ||
| 4186 | Lupus La protein | P05455 | tRNA modification | 2 | 46.8/6.68 | 1.6213 (0.0011) | ||
| 4493 | 26S proteasome non-ATPase regulatory subunit 8 (PSMD8) | P48556 | Degradation of proteins | 2 | 32.6/6.85 | 1.5107 (0.0102) | ||
| 4605 | Calponin-2 | Q99439 | Regulation of actin filament-based process | 1 | 33.7/6.94 | −1000000 (0.0000) | ||
| 4551 | Glutathione S-transferase M1 isoform 2 | P09488 | Glutathione transferase activity | 2 | 21.3/7.67 | 1.9390 (0.0193) | ||
| 3604 | Heat shock protein 90 kDa beta member 1 | P14625 | Molecular chaperone that functions in the processing and transport of secreted proteins | 2 | 92.5/4.76 | −1.5504 (0.0101) | ||
| 1553 | Vimentin | P08670 | Structural constituent of cytoskeleton | 8 | 53.7/5.06 | 2.0727 (0.0015) | ||
| 1070 | Heat shock 70 kDa protein 5 | P11021 | Facilitating the assembly of multimeric protein complexes inside the endoplasmic reticulum | 3 | 72.4/5.07 | 2.7257 (0.0022) | ||
| 1339 | Rap1 GTPase-GDP dissociation stimulator 1 | P52306 | Stimulating GDP/GTP exchange reaction of a group of small GTP-binding proteins (G proteins) | 2 | 66.3/5.21 | −1.57169 (0.0109) | ||
| 1166 | Heat shock cognate 71 kDa protein | P11142-1 | Acting as a repressor of transcriptional activation | 2 | 70.9/5.37 | 1.5630 (0.0144) | ||
| 1235 | Copine-1 | Q99829 | Membrane trafficking | 3 | 59.1/5.52 | −1.6085 (0.0039) | ||
| 1290 | Copine-3 | O75131 | Membrane trafficking | 3 | 60.1/5.60 | −2.0902 (0.0022) | ||
| 1013 | Collagen alpha-1(I) chain | P02452 | Leukocyte migration. Platelet activation | 5 | 138.9/5.60 | 1.8513 (0.0071) | ||
| 2035 | Superoxide dismutase [Cu-Zn] | P00441 | Destroying radicals | 2 | 15.9/5.70 | 1.9264 (0.0050) | ||
| 2015 | Ferritin | Q6S4P3 | Cellular iron ion homeostasis | 1 | 21.3/5.70 | 2.0167 (0.0001) | ||
| 1232 | Heat shock protein 60 | P10809 | Preventing misfolding under stress conditions in the mitochondrial matrix | 1 | 61.1/5.70 | −1.5792 (0.0180) | ||
| 1983 | Putative uncharacterized protein DKFZp686N1815 | Q5HYI3 | Proteolysis | 1 | 17.6/5.83 | 1.6203 (0.0389) | ||
| 1915 | Heat shock 27 kDa protein | P04792 | Involved in stress resistance and actin organization | 4 | 22.8/5.98 | −1.6224 (0.0014) | ||
aRatio of spot volume means the spot intensity ratio of treatment group to control group (>1.5, increased in treatment group; <1.5, decreased in treatment group). Theoretical molecular weights (MW in kDa) and isoelectric points (pI) were determined from database sequence entries. Note that the theoretical values do not account for potential posttranslational modification.
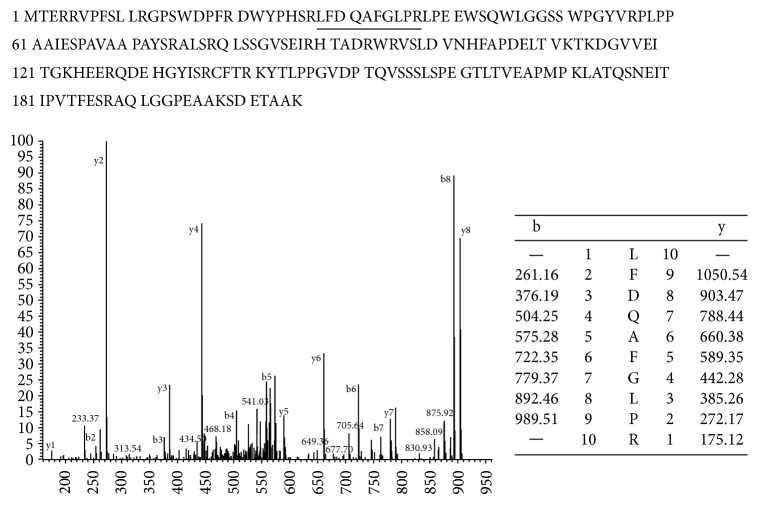
Spot 1915, heat shock protein 27 (HSP27), was identified as heat shock protein beta-1. The expression level of HSP27 showed 1.6-fold decrease in 1,4-BQ treated cells. As shown in Figure 4, peptides fragmentation of HSP27 was identified by mass spectra. Vimentin was also identified in spot 1553, which showed a 2.0-fold increase in 1,4-BQ-treated hBM-MSCs and had eight matched peptides and 19.3% sequence coverage according to the LC-MS/MS analysis.
Figure 4.
Identification of HSP27 by using LC-MS/MS. The reporter ion signals of LFDQAFGLPR were a peptide fragment of HSP27.
3.5. Verification of the Differentially Expressed Proteins
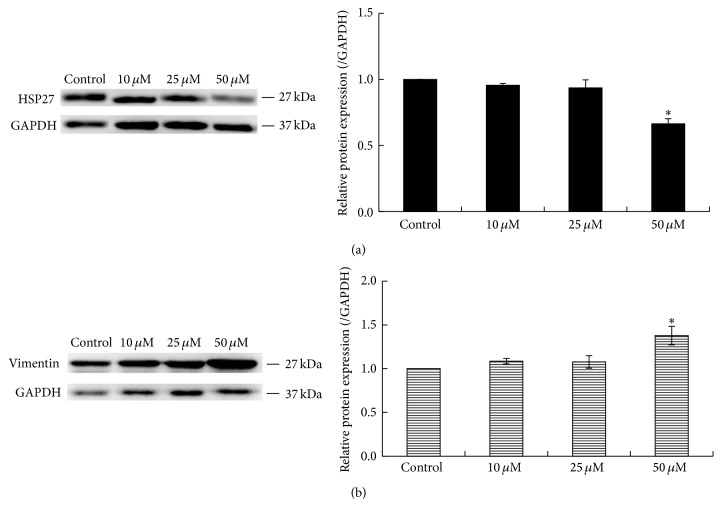
To further confirm the results of 2DE analysis, protein levels of Vimentin and HSP27 in hBM-MSCs treated with 0, 10, 25, and 50 μM of 1,4-BQ were determined by Western blot. The results showed that 50 μM 1,4-BQ significantly decreased expression of HSP27 and increased expression of Vimentin in hBM-MSCs when compared to the control group (P < 0.05) (Figures 5(a) and 5(b)). However, 10 and 25 μM 1,4-BQ did not affect the levels of HSP27 and Vimentin in hBM-MSCs.
Figure 5.
Protein expression of HSP27 and Vimentin verified by Western blot analysis. Left: blots were incubated with commercial antibodies against HSP27 and Vimentin, respectively. GAPDH was used as an internal control. Right: mean densitometry (optical density × area) of the antibody-antigen reaction shown on the blots. Statistical analysis was performed by one-way ANOVA analysis followed by Dunnett's multiple comparison. ∗ P < 0.05, compared to control. (a) HSP27. (b) Vimentin.
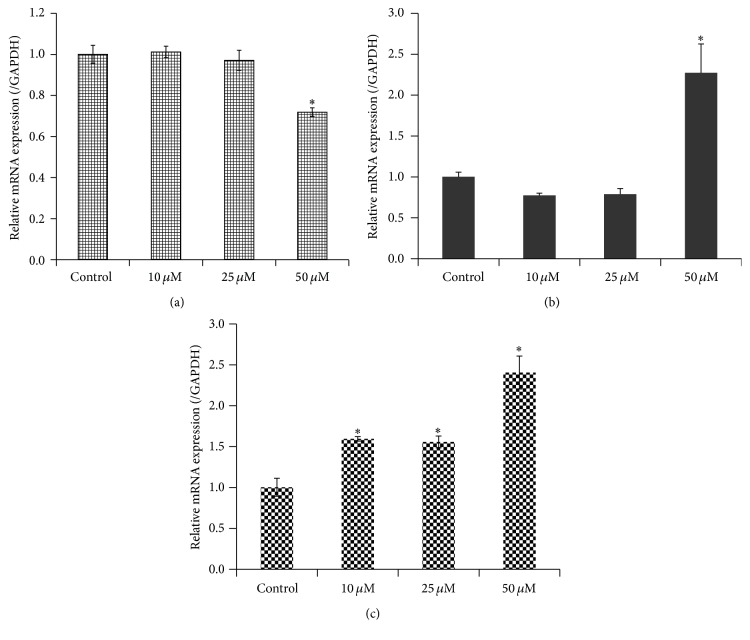
To examine whether the altered protein expression of HSP27 and Vimentin in 1,4-BQ-treated hBM-MSCs are related to changes at transcriptional level, we conducted qRT-PCR analysis. The results showed that 50 μM 1,4-BQ significantly decreased the mRNA level of HSP27 and increased the mRNA level of Vimentin in hBM-MSCs in comparison with the control group (P < 0.05) (Figures 6(a) and 6(b)). No difference was found between 10 and 25 μM 1,4-BQ-treated groups and control group (P > 0.05). In addition, the mRNA level of RAP1GDS1 was also significantly increased in hBM-MSCs treated with different concentrations of 1,4-BQ in a dose-dependent manner (Figure 6(c)) (P < 0.05).
Figure 6.
Quantitative real-time PCR analysis of the mRNA levels of HSP27, Vimentin, and RAP1GDS1 in hBM-MSCs. Results were normalized to internal control GAPDH. Data were represented as means ± SD (n = 3). Statistical analysis was performed by ANOVA and Dunnett's multiple comparison. ∗ P < 0.05, compared with control. (a) HSP27. (b) Vimentin. (c) RAP1GDS1.
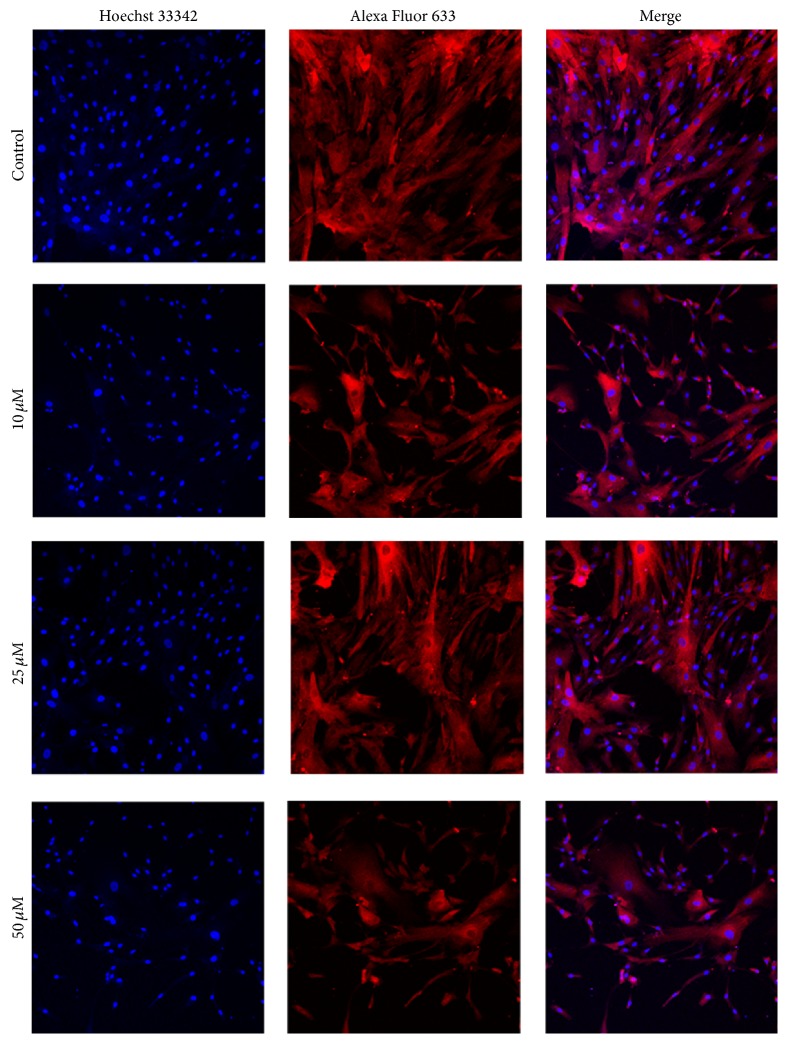
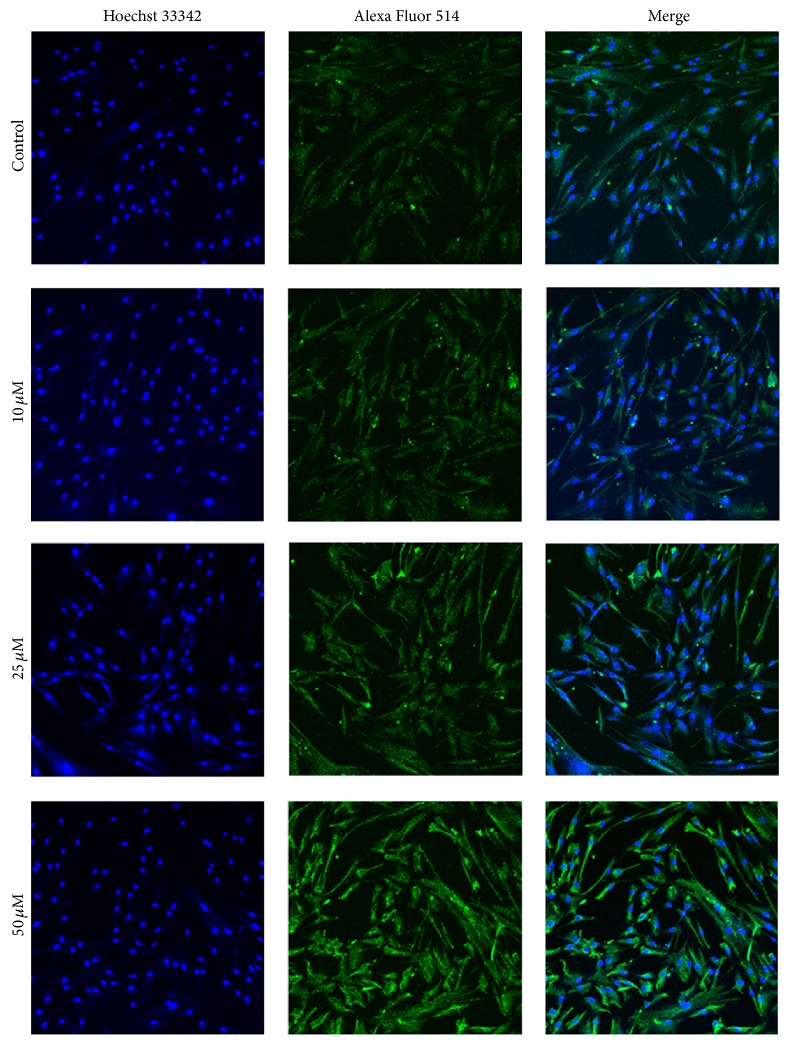
To determine their subcellular localization, HSP27 and Vimentin were observed in hBM-MSCs using immunofluorescent staining. The results showed that 50 μM 1,4-BQ led to an extremely low expression of HSP27 (Figure 7) and a higher expression of Vimentin (Figure 8) in hBM-MSCs. Both HSP27 and Vimentin expression were found in the cytoplasm of hBM-MSCs.
Figure 7.
Localization examination of HSP27 in hBM-MSCs by immunofluorescence. Alexa Fluor 633 (red)-labeled secondary antibody was used to detect HSP27 expression and the nuclei were stained with Hoechst 33342 (blue). The expression of HSP27 was mainly detected in the cytoplasm of hBM-MSCs (×200).
Figure 8.
Localization examination of Vimentin in hBM-MSCs by immunofluorescence. Alexa Fluor 514 (green)-labeled secondary antibody was used to detect Vimentin expression and the nuclei were stained with Hoechst 33342 (blue). The expression of Vimentin was mainly detected in the cytoplasm of hBM-MSCs (×200).
4. Discussion
Available data show that benzene causes leukemia and other hematotoxicities [32, 33]. Recently, hematotoxicity was found in workers who were exposed to low levels of benzene [3, 34]. 1,4-BQ, one of major metabolites of benzene, has been related to a lot of effects observed both in vivo and in vitro including formation of DNA adducts, DNA methylation in mouse bone marrow cells, and inhibition of DNA replication [11, 35, 36]. To find effective target proteins for 1,4-BQ is of pivotal importance to better understand the mechanisms of benzene-induced toxicity and hematotoxicity.
In our previous study, hydroquinone, one of the benzene metabolites, induced significantly differential protein expression profile in human liver cells [37], and four proteins were identified, including Rho GDP dissociation inhibitor GDI alpha, 6-phosphogluconolactonase, erbB3 binding protein EBP1, and lamin A/C. Benzene is metabolized in liver to benzene oxide, phenol, and several hydroxylated compounds including hydroquinone. Hydroquinone is then transported to bone marrow and metabolized by myeloperoxidases to highly toxic and mutagenic 1,4-BQ. The toxic effects of benzene are affected by the complex intercellular interactions in the bone marrow microenvironment. hBM-MSCs in the bone marrow are required for the marrow microenvironment maintenance. In the present study, cell viability of hBM-MSCs treated with 25 μM 1,4-BQ for 24 h did not show difference when compared to the control group, which suggests that hBM-MSC cells may not be sensitive to 1,4-BQ. However, in mouse bone marrow cells treated with 1,4-BQ at concentrations of 0.1, 1, and 10 μM for 24 h, levels of p15 and p16 mRNA were significantly upregulated when compared to the controls [38]. Treatment with 37 μM 1,4-BQ for 24 h also led to significant increase of Topo II α promoter activity in K-562 cells [39]. 1,4-BQ (1~10 μM for 4 h) increased mRNA levels of Rad51, xpc, and mdm-2 in male hematopoietic stem cells (HSCs) [11]. In another study, treatment with 5, 10, 25, or 50 μM 1,4-BQ for 48 h did not affect cell viability but significantly induced global DNA hypomethylation in human normal hepatic L02 cells [40]. Despite the weak effect on cell viability, 1,4-BQ still showed certain negative effects including genotoxicity, which needs more evidence at the molecular level to improve our understanding. Therefore, in this study, we used 1,4-BQ at concentrations of 10, 25, and 50 μM to investigate the altered protein profiles of hBM-MSCs using a 2DE and LC-MS/MS-based approach.
2DE and LC-MS/MS-based approach makes no assumptions about known or unknown molecules, allowing the process to be independent of any presupposed hypotheses. In this study, we found that there were numbers of proteins with differential expression between 1,4-BQ treated and untreated hBM-MSCs. As mentioned above, the differentially expressed 32 protein identified in the present study participated in various functional aspects including metabolism, cell stress response, cell skeleton, transcription regulation, membrane trafficking, and signal transduction (Figure 3(c)). These findings indicate that mechanism of genotoxicity disorders caused by 1,4-BQ could be related to multifactors.
Heat shock proteins (HSPs) are a family of proteins induced by different insults and can affect many physiological activities. Induction of HSPs allows cells to survive stress conditions. These proteins act as molecular chaperones involved either in the refolding of misfolded proteins or in their elimination if they become irreversibly damaged. In recent years, proteomic studies have identified several different HSPs in various tumor types as potential clinical biomarkers or molecular targets for cancer therapy [41, 42]. In this study, several heat shock proteins were identified, such as heat shock 27 kDa protein (HSP27), heat shock protein 60 (HSP60), heat shock 70 kDa protein 5 (HSP70 protein 5), heat shock cognate 71 kDa protein (HSP71), and heat shock protein 90 kDa beta member 1 (HSP90β1). HSP27 is a cytoprotective chaperone that is phosphor-activated during cell stress, preventing aggregation, and/or regulating activity and degradation of certain client proteins. HSP27 seems to play a crucial role in regulating the balance between cell death and cell survival, where its overexpression is associated with the suppression of apoptosis, increased cytoprotection, and resistance to treatment [43]. The downregulation of HSP27 in the present study suggested that HSP27 may not play the cytoprotective role in response to 1,4-BQ. Instead, the alteration of its expression might be an outcome of the regulation of responsive pathways which need further exploration.
The differentially expressed proteins in this study included some cell skeleton proteins such as Vimentin, beta-actin, and alpha-actin-1. These cell skeleton proteins affect cell morphology, strength, motility, and infectivity. Vimentin is a member of the intermediate filament family, which, along with microtubules and actin microfilaments, compose the cytoskeleton of cells [44]. It is normally expressed in mesenchymal cells and associated with tumor invasiveness and migration in a variety of tumor types [45, 46]. Our observation of higher expression of Vimentin in 1,4-BQ-treated hBM-MSCs suggested that Vimentin protein expression may be an efficient biomarker of cellular response to 1,4-BQ. Western blot analysis, RT-qPCR, and immunofluorescent analysis further confirmed these findings. Further investigation is needed to understand the functional impact of Vimentin on hBM-MSCs and its relationship to other proteins implicated in benzene-induced leukemogenesis.
In our study, there were several metabolism-related proteins that were significantly upregulated or downregulated. Based on our findings, the expression of Apolipoprotein L2, beta-enolase, putative uncharacterized protein DKFZp686N1815, 26S proteasome non-ATPase regulatory subunit 8 (PSMD8), and transaldolase (spots 4343, 2665, 1983, 4493, and 4336) were induced over 1.5-fold, whereas the intensity of 26S proteasome non-ATPase regulatory subunit 1 and creatine kinase M-type (M-CK) decreased 1.5-fold when compared to the control group. 1,4-BQ changed the expression levels of metabolism-related proteins, which was confirmed by examination of the mRNA expression level of RAP1GDS1. In summary, this work revealed the proteome profiles of hBM-MSCs treated with 1,4-BQ using 2DE and LC-MS/MS approaches. The differentially expressed proteins may be useful therapeutic targets for hematopoietic disorders induced by benzene. Further study will be needed to provide more evidence of how these proteins are involved in the hematopoietic disorders induced by benzene and its metabolites.
Acknowledgments
This work was supported partly by grants from National Natural Science Foundation of China (nos. 81202244 and 81302464); Zhejiang Provincial Natural Science Foundation of China (nos. Y207394 and LQ12H26001); Science Technology Department of Zhejiang Province (nos. 2008F1027 and 2013F20004); Health and Family Planning Commission of Zhejiang Province (2015RCA007). Yun Xiao is sponsored by Zhejiang Provincial Program for the Cultivation of High-level Innovative Health Talents.
Competing Interests
The authors declare that there is no conflict of interests regarding the publication of this paper.
References
- 1.Snyder R. Leukemia and benzene. International Journal of Environmental Research and Public Health. 2012;9(8):2875–2893. doi: 10.3390/ijerph9082875. [DOI] [PMC free article] [PubMed] [Google Scholar]
- 2.Bird M. G., Greim H., Kaden D. A., Rice J. M., Snyder R. BENZENE 2009—health effects and mechanisms of bone marrow toxicity: implications for t-AML and the mode of action framework. Chemico-Biological Interactions. 2010;184(1-2):3–6. doi: 10.1016/j.cbi.2009.12.001. [DOI] [PubMed] [Google Scholar]
- 3.Lan Q., Zhang L., Li G., et al. Hematotoxicity in workers exposed to low levels of benzene. Science. 2004;306(5702):1774–1776. doi: 10.1126/science.1102443. [DOI] [PMC free article] [PubMed] [Google Scholar]
- 4.Hu J., Ma H., Zhang W., Yu Z., Sheng G., Fu J. Effects of benzene and its metabolites on global DNA methylation in human normal hepatic l02 cells. Environmental Toxicology. 2014;29(1):108–116. doi: 10.1002/tox.20777. [DOI] [PubMed] [Google Scholar]
- 5.Michishita M., Satoh M., Yamaguchi M., Hirayoshi K., Okuma M., Nagata K. Phosphorylation of the stress protein HSP27 is an early event in murine myelomonocytic leukemic cell differentiation induced by leukemia inhibitory factor/D-factor. Biochemical and Biophysical Research Communications. 1991;176(3):979–984. doi: 10.1016/0006-291X(91)90378-K. [DOI] [PubMed] [Google Scholar]
- 6.Westphal G. A., Bünger J., Lichey N., Taeger D., Mönnich A., Hallier E. The benzene metabolite para-benzoquinone is genotoxic in human, phorbol-12-acetate-13-myristate induced, peripheral blood mononuclear cells at low concentrations. Archives of Toxicology. 2009;83(7):721–729. doi: 10.1007/s00204-009-0402-6. [DOI] [PMC free article] [PubMed] [Google Scholar]
- 7.Wan J., Winn L. M. Benzene's metabolites alter c-MYB activity via reactive oxygen species in HD3 cells. Toxicology and Applied Pharmacology. 2007;222(2):180–189. doi: 10.1016/j.taap.2007.04.016. [DOI] [PubMed] [Google Scholar]
- 8.Gaskell M., McLuckie K. I. E., Farmer P. B. Genotoxicity of the benzene metabolites para-benzoquinone and hydroquinone. Chemico-Biological Interactions. 2005;153-154:267–270. doi: 10.1016/j.cbi.2005.03.034. [DOI] [PubMed] [Google Scholar]
- 9.Rappaport S. M., Waidyanatha S., Qu Q., et al. Albumin adducts of benzene oxide and 1,4-benzoquinone as measures of human benzene metabolism. Cancer Research. 2002;62(5):1330–1337. [PubMed] [Google Scholar]
- 10.Yeowell-O'Connell K., Rothman N., Waidyanatha S., et al. Protein adducts of 1,4-benzoquinone and benzene oxide among smokers and nonsmokers exposed to benzene in China. Cancer Epidemiology Biomarkers & Prevention. 2001;10(8):831–838. [PubMed] [Google Scholar]
- 11.Faiola B., Fuller E. S., Wong V. A., et al. Exposure of hematopoietic stem cells to benzene or 1,4-benzoquinone induces gender-specific gene expression. Stem Cells. 2004;22(5):750–758. doi: 10.1634/stemcells.22-5-750. [DOI] [PubMed] [Google Scholar]
- 12.Gurbani D., Kukshal V., Laubenthal J., et al. Mechanism of inhibition of the ATpase domain of human topoisomerase IIα by 1,4-benzoquinone, 1,2-naphthoquinone, 1,4-naphthoquinone, and 9,10-phenanthroquinone. Toxicological Sciences. 2012;126(2):372–390. doi: 10.1093/toxsci/kfr345. [DOI] [PubMed] [Google Scholar]
- 13.Kondrová E., Stopka P., Souček P. Cytochrome P450 destruction by benzene metabolites 1,4-benzoquinone and 1,4-hydroquinone and the formation of hydroxyl radicals in minipig liver microsomes. Toxicology in Vitro. 2007;21(4):566–575. doi: 10.1016/j.tiv.2006.11.002. [DOI] [PubMed] [Google Scholar]
- 14.Wiwanitkit V., Suwansaksri J., Soogarun S. The urine trans, trans muconic acid biomarker and platelet count in a sample of subjects with benzene exposure. Clinical and Applied Thrombosis/Hemostasis. 2004;10(1):73–76. doi: 10.1177/107602960401000113. [DOI] [PubMed] [Google Scholar]
- 15.Kalf G. F., Hazel B. A., Hoffmann M. J., Kim D. D., Snyder R. The interaction of 1,4-benzoquinone, a bioreactive intermediate of benzene, with three proteins essential for differentiation/maturation of the mouse myeloid stem cell. Advances in Experimental Medicine and Biology. 2001;500:429–439. doi: 10.1007/978-1-4615-0667-6_65. [DOI] [PubMed] [Google Scholar]
- 16.Abernethy D. J., Kleymenova E. V., Rose J., Recio L., Faiola B. Human CD34+ hematopoietic progenitor cells are sensitive targets for toxicity induced by 1,4-benzoquinone. Toxicological Sciences. 2004;79(1):82–89. doi: 10.1093/toxsci/kfh095. [DOI] [PubMed] [Google Scholar]
- 17.Ishihama M., Toyooka T., Ibuki Y. Generation of phosphorylated histone H2AX by benzene metabolites. Toxicology in Vitro. 2008;22(8):1861–1868. doi: 10.1016/j.tiv.2008.09.005. [DOI] [PubMed] [Google Scholar]
- 18.Morgan G. J., Alvares C. L. Benzene and the hemopoietic stem cell. Chemico-Biological Interactions. 2005;153-154:217–222. doi: 10.1016/j.cbi.2005.03.025. [DOI] [PubMed] [Google Scholar]
- 19.Méndez-Ferrer S., Michurina T. V., Ferraro F., et al. Mesenchymal and haematopoietic stem cells form a unique bone marrow niche. Nature. 2010;466(7308):829–834. doi: 10.1038/nature09262. [DOI] [PMC free article] [PubMed] [Google Scholar]
- 20.Yoon B.-I., Hirabayashi Y., Kawasaki Y., et al. Mechanism of action of benzene toxicity: cell cycle suppression in hemopoietic progenitor cells (CFU-GM) Experimental Hematology. 2001;29(3):278–285. doi: 10.1016/s0301-472x(00)00671-8. [DOI] [PubMed] [Google Scholar]
- 21.Zolghadr F., Sadeghizadeh M., Amirizadeh N., Hosseinkhani S., Nazem S. How benzene and its metabolites affect human marrow derived mesenchymal stem cells. Toxicology Letters. 2012;214(2):145–153. doi: 10.1016/j.toxlet.2012.08.015. [DOI] [PubMed] [Google Scholar]
- 22.Xiao Y., Ju L., Wu W., Gao X.-L., Wang J., Zhang X. Effects of 1,4-benzoquinone on the proliferation activity of human bone marrow stem cells. Chinese Journal of Industrial Hygiene and Occupational Diseases. 2012;30(5):343–347. [PubMed] [Google Scholar]
- 23.Lee D.-H., Ahn Y., Kim S. U., et al. Targeting rat brainstem glioma using human neural stem cells and human mesenchymal stem cells. Clinical Cancer Research. 2009;15(15):4925–4934. doi: 10.1158/1078-0432.CCR-08-3076. [DOI] [PubMed] [Google Scholar]
- 24.Ock S.-A., Jeon B.-G., Rho G.-J. Comparative characterization of porcine mesenchymal stem cells derived from bone marrow extract and skin tissues. Tissue Engineering Part C: Methods. 2010;16(6):1481–1491. doi: 10.1089/ten.tec.2010.0149. [DOI] [PubMed] [Google Scholar]
- 25.Li Y., Sun W.-G., Liu H.-K., et al. γ-Tocotrienol inhibits angiogenesis of human umbilical vein endothelial cell induced by cancer cell. Journal of Nutritional Biochemistry. 2011;22(12):1127–1136. doi: 10.1016/j.jnutbio.2010.09.012. [DOI] [PubMed] [Google Scholar]
- 26.Liu J.-R., Chen B.-Q., Yang B.-F., et al. Apoptosis of human gastric adenocarcinoma cells induced by β-ionone. World Journal of Gastroenterology. 2004;10(3):348–351. doi: 10.3748/wjg.v10.i3.348. [DOI] [PMC free article] [PubMed] [Google Scholar]
- 27.Jia S.-H., Li M.-W., Zhou B., et al. Proteomic analysis of silk gland programmed cell death during metamorphosis of the silkworm Bombyx mori. Journal of Proteome Research. 2007;6(8):3003–3010. doi: 10.1021/pr070043f. [DOI] [PubMed] [Google Scholar]
- 28.Stastna M., Behrens A., McDonnell P. J., Van Eyk J. E. Analysis of protein composition of rabbit aqueous humor following two different cataract surgery incision procedures using 2-DE and LC-MS/MS. Proteome Science. 2011;9, article 8 doi: 10.1186/1477-5956-9-8. [DOI] [PMC free article] [PubMed] [Google Scholar]
- 29.Liu Q., Dong H.-W., Sun W.-G., et al. Apoptosis initiation of β-ionone in SGC-7901 gastric carcinoma cancer cells via a PI3K-AKT pathway. Archives of Toxicology. 2013;87(3):481–490. doi: 10.1007/s00204-012-0962-8. [DOI] [PubMed] [Google Scholar]
- 30.Dong H.-W., Zhang S., Sun W.-G., et al. β-Ionone arrests cell cycle of gastric carcinoma cancer cells by a MAPK pathway. Archives of Toxicology. 2013;87(10):1797–1808. doi: 10.1007/s00204-013-1041-5. [DOI] [PubMed] [Google Scholar]
- 31.Ma Y., Xu Y., Xiao Z., et al. Reconstruction of chemically burned rat corneal surface by bone marrow-derived human mesenchymal stem cells. Stem Cells. 2006;24(2):315–321. doi: 10.1634/stemcells.2005-0046. [DOI] [PubMed] [Google Scholar]
- 32.Smith M. T., Zhang L., McHale C. M., Skibola C. F., Rappaport S. M. Benzene, the exposome and future investigations of leukemia etiology. Chemico-Biological Interactions. 2011;192(1-2):155–159. doi: 10.1016/j.cbi.2011.02.010. [DOI] [PMC free article] [PubMed] [Google Scholar]
- 33.Hutt A. M., Kalf G. F. Inhibition of human DNA topoisomerase II by hydroquinone and p-benzoquinone, reactive metabolites of benzene. Environmental Health Perspectives. 1996;104(supplement 6):1265–1269. doi: 10.1289/ehp.961041265. [DOI] [PMC free article] [PubMed] [Google Scholar]
- 34.Xie Z., Zhang Y., Guliaev A. B., et al. The p-benzoquinone DNA adducts derived from benzene are highly mutagenic. DNA Repair. 2005;4(12):1399–1409. doi: 10.1016/j.dnarep.2005.08.012. [DOI] [PubMed] [Google Scholar]
- 35.Mansi A., Bruni R., Capone P., et al. Low occupational exposure to benzene in a petrochemical plant: modulating effect of genetic polymorphisms and smoking habit on the urinary t,t-MA/SPMA ratio. Toxicology Letters. 2012;213(1):57–62. doi: 10.1016/j.toxlet.2011.02.001. [DOI] [PubMed] [Google Scholar]
- 36.Nies E., Korinth G. Commentary on ‘Penetration of benzene, toluene and xylenes contained in gasolines through human abdominal skin in vitro’. Toxicology in Vitro. 2008;22(1):275–277. doi: 10.1016/j.tiv.2007.04.015. [DOI] [PubMed] [Google Scholar]
- 37.Ju L., Zhang S.-Z., Zhao R., Yao G.-D. Differential proteomic expression in human liver cells stimulated by hydroquinone. Chinese Journal of Industrial Hygiene and Occupational Diseases. 2006;24(11):658–661. [PubMed] [Google Scholar]
- 38.Tian J.-F., Peng C.-H., Yu X.-Y., Yang X.-J., Yan H.-T. Expression and methylation analysis of p15 and p16 in mouse bone marrow cells exposed to 1,4-benzoquinone. Human & Experimental Toxicology. 2012;31(7):718–725. doi: 10.1177/0960327111422403. [DOI] [PubMed] [Google Scholar]
- 39.Singh R., Winn L. M. The effects of 1,4-benzoquinone on c-Myb and topoisomerase II in K-562 cells. Mutation Research/Fundamental and Molecular Mechanisms of Mutagenesis. 2008;645(1-2):33–38. doi: 10.1016/j.mrfmmm.2008.08.007. [DOI] [PubMed] [Google Scholar]
- 40.Hu J., Ma H., Zhang W., Yu Z., Sheng G., Fu J. Effects of benzene and its metabolites on global DNA methylation in human normal hepatic l02 cells. Environmental Toxicology. 2014;29(1):108–116. doi: 10.1002/tox.20777. [DOI] [PubMed] [Google Scholar]
- 41.Sanjuán-Herráez D., Lliso I., Pastor A., De La Guardia M. Green determination of the presence of volatile organic compounds in vehicle repair shops through passive sampling. Talanta. 2012;98:40–48. doi: 10.1016/j.talanta.2012.06.034. [DOI] [PubMed] [Google Scholar]
- 42.Wu W., Zhang C., Chen Z., Zhang G., Yang J. Differences in heating methods may account for variation in reported effects on γH2AX focus formation. Mutation Research/Genetic Toxicology and Environmental Mutagenesis. 2009;676(1):48–53. doi: 10.1016/j.mrgentox.2009.03.003. [DOI] [PubMed] [Google Scholar]
- 43.Tunsaringkarn T., Siriwong W., Rungsiyothin A., Nopparatbundit S. Occupational exposure of gasoline station workers to BTEX compounds in Bangkok, Thailand. International Journal of Occupational and Environmental Medicine. 2012;3(3):117–125. [PubMed] [Google Scholar]
- 44.Terasaki Y., Sasaki T., Yagita Y., et al. Activation of NR2A receptors induces ischemic tolerance through CREB signaling. Journal of Cerebral Blood Flow and Metabolism. 2010;30(8):1441–1449. doi: 10.1038/jcbfm.2010.18. [DOI] [PMC free article] [PubMed] [Google Scholar]
- 45.Jiang Y., Fu J., Greenlee A. R., Shen Y., Duan H., Chen X. Effects of silencing of HER2/neu gene in anti-BPDE-transformed cells. Toxicology in Vitro. 2009;23(1):53–59. doi: 10.1016/j.tiv.2008.10.002. [DOI] [PubMed] [Google Scholar]
- 46.Lee S.-R., Kim M.-R., Yon J.-M., et al. Black ginseng inhibits ethanol-induced teratogenesis in cultured mouse embryos through its effects on antioxidant activity. Toxicology in Vitro. 2009;23(1):47–52. doi: 10.1016/j.tiv.2008.10.001. [DOI] [PubMed] [Google Scholar]


