Abstract
The purpose of this study was to compare performance factors of youth soccer players according to position. A total of 101 high school soccer players were selected and were classified into goalkeeper (n=7), defense (n=37), midfield (n=39), and forward (n=18) positions. All subjects were subjected to the Wingate test for anaerobic capacity, shuttle run test for aerobic capacity, and pass, kick, dribble, and shooting tests for soccer skills. There was no significant difference in aerobic capacity according to position. However, anaerobic capacity was significantly higher in defenders than midfielders (P<0.05), and soccer skills were significant lower in goalies than in other positions (P<0.01). The results show significant differences in anaerobic capacity and soccer skills according to position in youth soccer players. Therefore, we suggest that middle and high school soccer players should improve aerobic, an-aerobic capacity, and soccer skills irrespective position to achieve high-level soccer performance.
Keywords: Soccer, Playing position, Aerobic capacity, Anaerobic capacity, Skills
INTRODUCTION
In the game of soccer, various skills, strategies, and physical elements are required to perform well. Specialized training for each position is required to improve these conditions. A forward must have quick judgment and the ability to find holes in the opposing defense, a midfielder needs agility and must be adept at long and short passing, and a defender should be able to jump high as well as be effective at headers and tackling (Kim, 2000).
One of the most important elements for a soccer player is endurance. Rienzi et al. (2000) reported that midfielders cover the greatest overall distance while acting as a link between the defense and attack. Reports on the individual fitness and physical characteristics of each position can provide important information on improving match results. The somatotype components and physical abilities of soccer players are not significantly different by position (Noh et al., 2015; Ruas et al., 2015), but Gil et al. (2008) reported a difference in size and physical ability according to position. Therefore, more research on this topic is required despite limitations in training programs for youth players.
Some have argued that midfielders have higher anaerobic exercise capacity (Son et al., 2003), whereas others reported that forwards have higher capacity (Gil et al., 2007). This controversial issue has implications on overall soccer skill. For example, Malina et al. (2005) reported no significant differences in ball control, dribbling, passing, and shooting in youth players based on position, whereas a report by Lee et al. (2013) found that long distance kick power was stronger in defenders among middle school players. These differences suggest that differential physical training based on position cannot be the only influencing factor. Previous studies have found no significant difference in physical characteristics or trained ability by position. As an explanation, soccer players generally train using normal exercise routines rather than individualized physical or skillful abilities for specific positions. Therefore, more research would be helpful to develop important physical skills in soccer players categorized by positions.
MATERIALS AND METHODS
Subjects
The study included 48 middle school and 53 high school players; seven goalkeepers, 37 defenders, 39 midfielders, and 18 forwards registered in the Korea Football Association. Table 1 shows the physical characteristics of subjects.
Table 1.
Physical characteristics of subjects
| Characteristic | Position | P-value | |||
|---|---|---|---|---|---|
|
| |||||
| Goalkeeper (n=7) | Defense (n=37) | Midfield (n=39) | Forward (n=18) | ||
| Age (yr) | 16.0±1.6 | 16.1±1.3 | 15.8±1.3 | 15.8±1.4 | 0.743 |
|
| |||||
| Height (cm) | 181.6±4.8 | 174.9±5.4 | 172.2±5.4* | 172.8±7.2# | 0.001** |
|
| |||||
| Weight (kg) | 71.6±9.1 | 65.7±6.5# | 60.7±6.4* | 64.1±8.8 | 0.001** |
|
| |||||
| Career (yr) | 5.3±2.5 | 5.7±1.7 | 6.1±1.6 | 5.3±2.6 | 0.440 |
|
| |||||
| Dominant foot (n) | |||||
| Right | 7 | 35 | 35 | 18 | |
| Left | 0 | 2 | 4 | 0 | |
|
| |||||
| Body mass index (kg/m2) | 21.7±2.3 | 21.4±1.6 | 20.5±1.9 | 21.4±2.0 | 0.080 |
Values are presented as mean±standard deviation.
P<0.05, vs. goalkeeper.
P<0.05, vs. midfield.
P<0.01.
Wingate test
Monark bicycle ergometer was used to measure anaerobic power, namely peak power (W), relative peak power (W/kg), anaerobic capacity (W), and anaerobic fatigue (%). The subjects were instructed using the Wingate Test Protocol, which requires a warm-up of 3 min, followed by a recovery cool down. Then, each individual pedals ‘all out’ with no resistance, after which a predetermined fixed resistance is continuously applied to the flywheel for the duration of the 30-sec test.
Shuttle run test
As shown in Fig. 1, subjects ran to a cone 21 m away upon the verbal command ‘Go.’ Their starting speed was approximately 11 km/hr, and they had to pass the first round in about 6.87 sec. Upon leveling up, the signal command was sped up. Between each command, individuals had 15 sec to cool down by walking or jogging for about 3 m. The test was stopped if the subject could not reach 18 m, although the command was started 4 sec before completing the cool down.
Fig. 1.
Shuttle run test involves continuous running between two lines 21 m apart in time to recorded beeps. The subjects ran to reach the cone 21 m away with the command ‘Go.’ The starting speed was approximately 11 km/hr and they had to pass the first round in about 6.87 sec. With leveling up, the signal command should be getting faster to speed up. Between each command, the individual had 15 sec cool down all the time.
Pass test
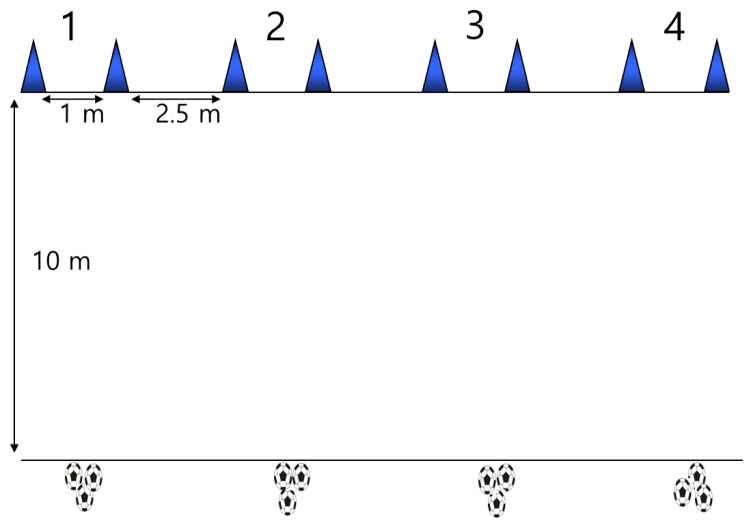
As shown in Fig. 2, the ability to pass the ball to an area 10 m away was assessed. The passing area was 1 m wide and divided into four sectors with cones located in each section. The subject was given three passing chances for each area for a total of 12, and successful passes were recorded.
Fig. 2.
A soccer ball is placed on a line, marked 10 m from the target. The subject was given three passing chances for each area, total 12, and successful passes were recorded.
Kick test
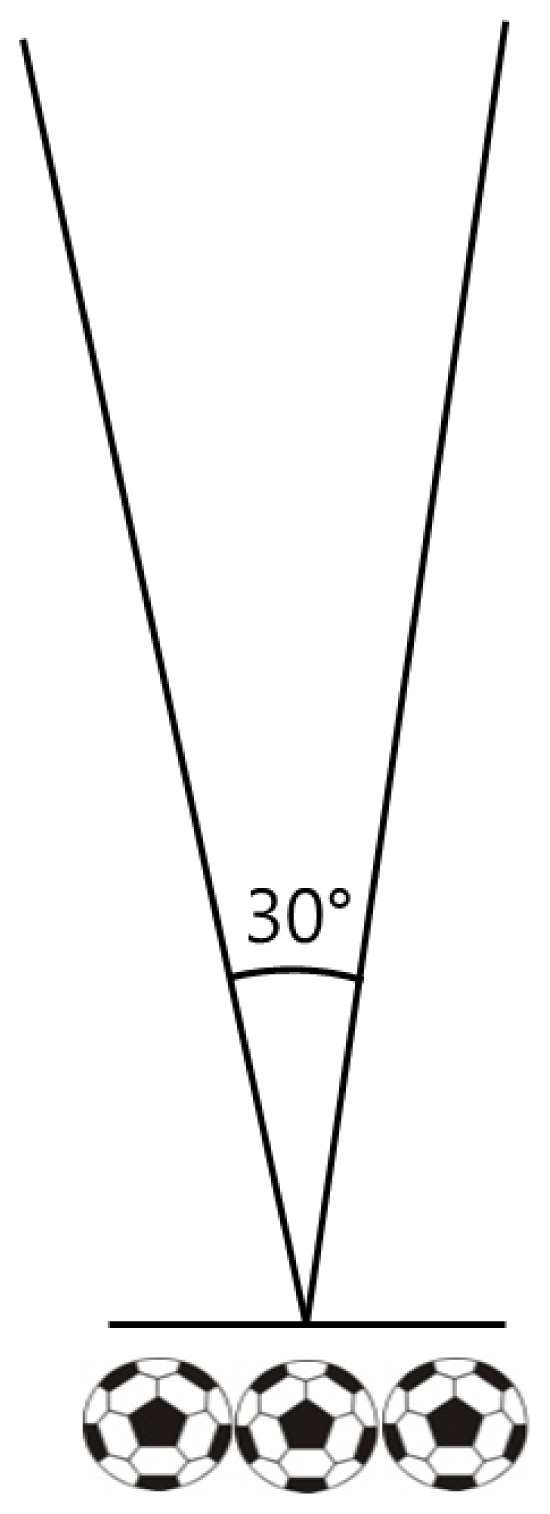
As shown in Fig. 3, subjects were given three chances to kick the ball as far as possible. The longest distance was recorded, and the angle of the kick was limited to 30 degrees. The subject was given three kicking chances, and the longest kick was recorded.
Fig. 3.

Kicking skill test was supposed to kick a ball as far as possible with three chances.
Dribble test
As shown in Fig. 4, subjects needed to dribble through four cones in a zigzag pattern for 10 m then return in a straight line as fast as possible to the starting point.
Fig. 4.
Dribble skill test was that the subjects needed to pass four cones in zigzag forms dribbling and 10 m straight line and return as fast as to the starting point.
Shooting test
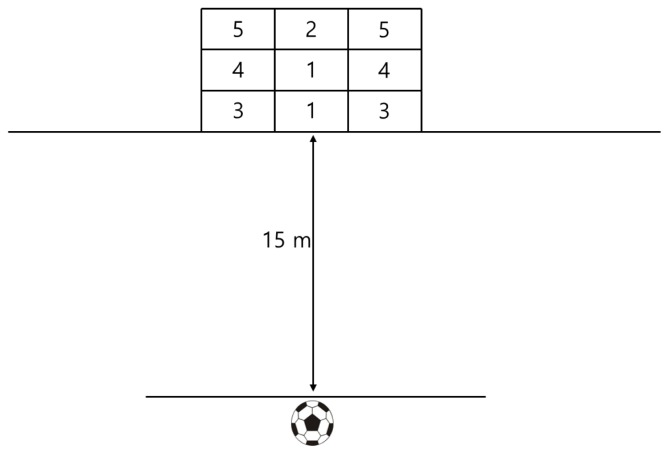
As shown in Fig. 5, an aiming point was placed 15 m away. Each subject had 14 chances over the course of two sets.
Fig. 5.
Shooting skill test was placed 15 m away from the target then the shooting was measured by the distance from the point.
Statistical analysis
All data are presented as mean±standard deviation. Data were analyzed using a one-way analysis of variance to determine significant differences in the measures of interest among the playing positions. When significance was detected, Tukey honestly significant difference post hoc procedures were performed to determine pairwise differences. The P<0.05 criterion was used to indicate statistical significance.
RESULTS
Fitness
In comparing the anaerobic and aerobic physical abilities of each position (Table 2), anaerobic ability measured by the Wingate Test showed significant differences (P<0.05) in terms of peak power (PP) and anaerobic capacity (AC). The results for PP (P<0.05) and AC (P<0.05) were similar between defenders and midfielders after verification.
Table 2.
Fitness according to position
| Fitness factor | Position | F | P-value | |||
|---|---|---|---|---|---|---|
|
| ||||||
| Goalkeeper | Defense | Midfield | Forward | |||
| Anaerobic capacity | ||||||
| PP (W) | 640.9±204.2 | 631.0±146.4# | 539.9±138.8 | 639.5±166.0 | 3.155 | 0.028* |
| RPP (W/kg) | 8.8±2.2 | 9.5±1.7 | 8.9±1.8 | 9.9±1.6 | 1.798 | 0.153 |
| AC (W) | 238.7±93.7 | 252.3±61.5# | 212.2±63.2 | 257.6±60.3 | 3.243 | 0.025* |
| AF (%) | 47.0±8.4 | 40.8±9.7 | 41.6±11.9 | 38.6±8.5 | 1.116 | 0.347 |
|
| ||||||
| Aerobic capacity (W) | 2,450±844 | 2,956±470 | 2,915±438 | 2,957±532 | 2.119 | 0.103 |
Values are presented as mean±standard deviation.
PP, peak power output; RPP, relative peak power output; AC, anaerobic capacity; AF, anaerobic fatigue.
P<0.05.
P<0.05, vs. midfield.
Skills
In comparing skills of each position based on passing, kicking, dribbling, and shooting (Table 3), only dribbling showed a statistical difference (P<0.01). Specifically, goalkeepers showed lower dribbling skill than other positions (P<0.05) such as defenders, midfielders, and forwards.
Table 3.
Soccer skills according to position
| Skill factor | Goalkeeper | Defence | Midfield | Forward | F | P-value |
|---|---|---|---|---|---|---|
| Passing | 7.9±1.6 | 8.3±2.0 | 8.0±2.3 | 7.6±2.1 | 0.481 | 0.696 |
| Kicking (m) | 48.4±9.7 | 47.5±8.8 | 42.6±7.8 | 44.5±9.6 | 2.394 | 0.073 |
| Dribbling | 18.1±2.0 | 15.6±1.6# | 15.9±1.9* | 15.8±1.8# | 4.072 | 0.009** |
| Shooting | 14.3±5.5 | 18.1±6.0 | 16.5±5.5 | 18.8±6.7 | 1.429 | 0.239 |
Values are presented as mean±standard deviation.
P<0.05, vs. goalkeeper.
P<0.01.
DISCUSSION
The German soccer team won the 2014 World Cup in Brazil 1:0 against Argentina and Lionel Messi, who is well known globally as the best forward in the world. This implies that that teamwork and strategy are more crucial than individual ability. Modern soccer players are expected to train for both forward and defend roles; especially youth players need to play various positions to develop techniques throughout their growth process.
In this research, 101 youth players of different positions were compare in terms of their physical and technical characteristics. We tried to discuss their physical and technical abilities as multiplayers at varied positions. There was no significant variation in any position based on aerobic exercise ability. This differs from previous research reporting that midfielders have higher aerobic abilities than other players (Bangsbo et al., 1991; Davis et al., 1992; Ekblom, 1986; Reilly et al., 2000; Wisløff et al., 1998). In addition, the current results differ from former reports (Krustrup et al., 2003) in which elite defenders ran farther than others in the Yo-Yo test. In this respect, adolescent soccer players should perform various roles, as all have equivalent physical ability in terms of aerobic exercise power. Conditioning programs should be disseminated to maintain aerobic power to adulthood. One disadvantage of this study is the limited number of goalkeepers, although they showed similar abilities. Therefore, even goalkeepers should have equivalent aerobic capability.
However, in the case of anaerobic abilities, defenders showed relatively higher values (P<0.05) in PP and AC than midfielders. The result confirms previous studies conducted by Kim (2000) in which the PP of forwards was highest (817.9 W) followed by defenders (804.9 W), and lastly midfielders (751.5 W). Other reports showed that the PP and AC of center defenders were larger than those of midfielders (Al-Hazzaa and Chukwuemeka, 2001). In this respect, defenders are expected to be able to respond to unpredictable and explosive movements while midfielders need additional training to improve their anaerobic power in order to engage in successful defense.
Regarding technical aspects of different positions, there were no significant variations in terms of passing, kicking, and shooting, whereas goalkeepers had far better scores for dribbling compared to other jobs (P<0.01), which means goalkeepers are less skillful than other players. The unfortunate limitation is that only a few goalkeepers participated. Still, it can be assumed that goalkeepers have fewer chances to perform dribbles. This reflects that they need to supplement their technical training for scoring goals.
Each position requires different systemic abilities since every soccer position has specialized roles and skills. Appropriate positioning considering physical characteristics and elements is crucial for a successful match. Thus, physical, fitness, and technical aspects are extremely important for performing proper roles. In addition, systemized conditioning programs can be implemented to supplement effective strategies playing multi-roles rather than limited fitness and techniques. In particular, young players should focus on learning various techniques while adult training needs to focus on physical fitness as well as techniques.
This study found certain differences in physical and technical abilities by position in youth players. First, there was no significant variation in aerobic fitness. Second, in terms of anaerobic power, defenders showed much higher PP and AC compared to others. Third, goalkeepers showed fewer technical skills. Therefore, various training programs should be applied for youth soccer players to develop their physical and technical abilities in order to modernize soccer. Particularly, they need to be encouraged to train themselves to play multiroles.
Footnotes
CONFLICT OF INTEREST
No potential conflict of interest relevant to this article was reported.
REFERENCES
- Al-Hazzaa HM, Chukwuemeka AC. Echocardiographic dimensions and maximal oxygen uptake in elite soccer players. Saudi Med J. 2001;22:320–325. [PubMed] [Google Scholar]
- Bangsbo J, Nørregaard L, Thorsø F. Activity profile of competition soccer. Can J Sport Sci. 1991;16:110–116. [PubMed] [Google Scholar]
- Davis JA, Brewer J, Atkin D. Pre-season physiological characteristics of English first and second division soccer players. J Sports Sci. 1992;10:541–547. doi: 10.1080/02640419208729950. [DOI] [PubMed] [Google Scholar]
- Ekblom B. Applied physiology of soccer. Sports Med. 1986;3:50–60. doi: 10.2165/00007256-198603010-00005. [DOI] [PubMed] [Google Scholar]
- Gil SM, Gil J, Ruiz F, Irazusta A, Irazusta J. Physiological and anthropometric characteristics of young soccer players according to their playing position: relevance for the selection process. J Strength Cond Res. 2007;21:438–445. doi: 10.1519/R-19995.1. [DOI] [PubMed] [Google Scholar]
- Gil SM, Hong CB, Kim KJ. Comparison of physique and physical fitness following to high school soccer players’ position. J Liv Sci Res. 2008;34:235–245. [Google Scholar]
- Kim YK. A fitness profiles of the professional soccer players by each position. Korean J Sports Med. 2000;18:217–226. [Google Scholar]
- Krustrup P, Mohr M, Amstrup T, Rysgaard T, Johansen J, Steensberg A, Pedersen PK, Bangsbo J. The yo-yo intermittent recovery test: physiological response, reliability, and validity. Med Sci Sports Exerc. 2003;35:697–705. doi: 10.1249/01.MSS.0000058441.94520.32. [DOI] [PubMed] [Google Scholar]
- Lee WJ, Lee SJ, Lee JJ. A study on the analysis of stamina, anaerobic power and performance of varying positions among high school soccer players. J Coach Dev. 2013;15:132–140. [Google Scholar]
- Malina RM, Cumming SP, Kontos AP, Eisenmann JC, Ribeiro B, Aroso J. Maturity-associated variation in sport-specific skills of youth soccer players aged 13–15 years. J Sports Sci. 2005;23:515–522. doi: 10.1080/02640410410001729928. [DOI] [PubMed] [Google Scholar]
- Noh JW, Kim MY, Lee LK, Park BS, Yang SM, Jeon HJ, Lee WD, Kim JH, Lee JU, Kwak TY, Lee TH, Kim JY, Kim J. Somatotype and body composition analysis of Korean youth soccer players according to playing position for sports physiotherapy research. J Phys Ther Sci. 2015;27:1013–1017. doi: 10.1589/jpts.27.1013. [DOI] [PMC free article] [PubMed] [Google Scholar]
- Reilly T, Bangsbo J, Franks A. Anthropometric and physiological predispositions for elite soccer. J Sports Sci. 2000;18:669–683. doi: 10.1080/02640410050120050. [DOI] [PubMed] [Google Scholar]
- Rienzi E, Drust B, Reilly T, Carter JE, Martin A. Investigation of anthropometric and work-rate profiles of elite South American international soccer players. J Sports Med Phys Fitness. 2000;40:162–169. [PubMed] [Google Scholar]
- Ruas CV, Minozzo F, Pinto MD, Brown LE, Pinto RS. Lower-extremity strength ratios of professional soccer players according to field position. J Strength Cond Res. 2015;29:1220–1226. doi: 10.1519/JSC.0000000000000766. [DOI] [PubMed] [Google Scholar]
- Son JS, Jeong JU, Kim JH, Lim JS, Kim H. The analysis of the anaerobic capacity in different soccer players’ positions. J Nat Sci. 2003;19:131–140. [Google Scholar]
- Wisløff U, Helgerud J, Hoff J. Strength and endurance of elite soccer players. Med Sci Sports Exerc. 1998;30:462–467. doi: 10.1097/00005768-199803000-00019. [DOI] [PubMed] [Google Scholar]


