Abstract
To understand the mechanism regulating the spontaneous change in polarity that leads to cell turning, we quantitatively analyzed the dynamics of focal adhesions (FAs) coupling with the self-assembling actin cytoskeletal structure in Swiss 3T3 fibroblasts. Fluorescent images were acquired from cells expressing GFP-actin and RFP-zyxin by laser confocal microscopy. On the basis of the maximum area, duration, and relocation distance of FAs extracted from the RFP-zyxin images, the cells could be divided into 3 regions: the front region, intermediate lateral region, and rear region. In the intermediate lateral region, FAs appeared close to the leading edge and were stabilized gradually as its area increased. Simultaneously, bundled actin stress fibers (SFs) were observed vertically from the positions of these FAs, and they connected to the other SFs parallel to the leading edge. Finally, these connecting SFs fused to form a single SF with matured FAs at both ends. This change in SF organization with cell retraction in the first cycle of migration followed by a newly formed protrusion in the next cycle is assumed to lead to cell turning in migrating Swiss 3T3 fibroblasts.
1. Introduction
Directional cell migration plays an essential role in embryonic development [1], tissue regeneration [2], development and remodeling of the nervous system [3], wound healing in multicellular organisms [4, 5], and biomedical applications such as tissue formation [6]. During these processes, cells generate, maintain, and change front-back polarity by integrating chemical and mechanical stimuli from the extracellular environment [7, 8].
The mechanism of polarity control of migrating cells has been studied extensively in chemotactic neutrophils and Dictyostelium amoeba in response to and movement along a gradient of chemoattractant [9, 10]. Polarized chemotactic cell migration is associated with the formation of polarized networks of actin filaments and microtubules together with the asymmetric distribution of signaling molecules including PI3Ks, PTEN, and Rho GTPases [10, 11]. It is also reported that local temperature gradients induce neurite outgrowth due to the enhanced microtubule and actin dynamics [12]. Intensive studies show that mechanical stimuli, such as stiffness [13–15] and topography [16, 17] of the extracellular matrix, and chemical and thermal stimuli are critical factors controlling the polarity of migrating cells. Mechanically responding cells modulate the delicate force balance between contractility of the actin cytoskeleton and exogenous mechanical forces transmitted across the focal adhesions (FAs) [6] and change their migratory direction [15, 18, 19]. Thus, self-organization of the actin cytoskeletal system involving FAs is a key factor to understand the polarity control of migrating cells in relation to mechanical stimuli in the extracellular environment.
The details on polarity maintenance through self-assembling actin cytoskeletal structure coupling with the dynamics of FAs, which are known to be regulated by Rho family GTPases [20, 21], have been studied extensively in relation to the key steps: protrusion at the leading edge, adhesion to the extracellular matrix via FAs, and detachment and retraction at the cell rear. Protrusion at the leading edge is driven by actin polymerization to form a lamellipodium, which is a dynamic dendritic network with actin binding proteins such as Arp2/3 for nucleation and branching of actin filaments [22, 23], capping proteins for terminating actin polymerization [24] and ADF/cofilin for severing actin filaments [25]. Some actin filaments in the lamellipodium are depolymerized and recycled again for polymerization to actin filaments. Others including filopodia, which are rod-like projections that extend from the lamellipodium and are composed of bundles of actin filaments, are delivered to the lamella by the actin retrograde flow to assemble a contractile network for traction, consisting of bundled filaments, myosin II, and FAs [26–29]. The contractile forces generated in the actomyosin network are required for retrograde flow to assemble the contractile network, as well as cell body translocation and disassembling FAs at the cell rear [30, 31].
Self-assembly of actin cytoskeleton for polarity generation has been reported in physically pushed lamellipodial fragments, in which the physical stimulus leads to local compression of the bundled actin filaments with myosin II, resulting in a positive feedback loop that initiates polarization and persistent migration [32]. Furthermore, this polarity generation was shown to be dependent on Rho kinase-mediated reorganization of the actomyosin network based on the detailed analysis of the spatiotemporal reorganization of the F-actin network [33].
Clarification of the mechanism of polarity change is the next challenge to understand the control of migrating cells in response to mechanical stimuli since extensive studies have demonstrated the self-assembling actin cytoskeletal structure and dynamics of FAs for polarity generation and maintenance. Our aim here was to demonstrate the mechanism regulating the change in polarity that leads to cell turning by focusing on the dynamics of FAs and bundled actin filaments called stress fibers (SFs) [34]. We combined precise observations of FAs and SFs with quantitative analyses of FA assembly-disassembly in relation to spatiotemporal changes in SFs. These observations and analyses demonstrated the spatiotemporal coordination of intracellular cytoskeletal reorganization due to an actin self-assembly mechanism and dynamics of FA formation.
2. Materials and Methods
2.1. Cell Culture, Transfection, and Sample Preparation
Swiss 3T3 fibroblasts (Riken Cell Bank, Tsukuba, Japan) were cultured in 5% CO2 at 37°C in Dulbecco's modified Eagle's medium (Low-glucose DMEM; GIBCO, USA) supplemented with 10% fetal bovine serum (Nacalai Tesque, Japan) and penicillin/streptomycin (50 units/mL and 50 μg/mL, resp.) (GIBCO). For long-term observations of cell migration, the cells were plated on 35 mm glass-bottom dishes (Matsunami, Japan). For observation of actin SFs and FAs during cell migration, the cells were cotransfected with pAcGFP1-actin (Clontech, USA) and pTagRFP-zyxin (Evrogen, Russia) using FuGENE HD transfection reagents (Promega, USA) according to the manufacturer's instructions. The cells were then seeded on silicone gel substrates. Both glass-bottom dishes and silicone gel substrates were precoated with 50 μg/mL fibronectin (BD Biosciences, USA) for 30 minutes at room temperature. After plating, the cells were incubated for at least 3 h in a 5% CO2 incubator at 37°C, allowing the cells to adhere to and spread over the substrate.
2.2. Silicone Gel Substrates
A thin silicone gel substrate embedded with fluorescent microspheres was prepared, as described in detail elsewhere [35] with some modifications. Briefly, a pair of liquid silicones (CY52-276A and B; Dow Corning Toray, Japan) were mixed at a weight ratio of 6 : 5 and degassed. The mixture was spread on a 22 × 22 mm coverslip (Matsunami) using a spin coater (LH-D7; MIKASA, Japan). The thickness of the silicone layer was less than 50 μm. A 35 mm plastic dish with a hole (14 mm in diameter) at the bottom (Matsunami) was assembled with the silicone-coated coverslip by curing the silicone at 70°C for 30 minutes. Assembled silicone substrate-bottom dishes were kept in a hermetically sealed case with a 100 μL aliquot of liquid silane (3-aminopropyl triethoxysilane; Sigma-Aldrich Japan, Japan) for 1 h to attach the silane to the surface of the silicone substrate by vapor deposition. A 250 μL aliquot of a solution containing dark red fluorescent microspheres (0.2 μm in diameter, with peak excitation and emission wavelengths of 660 and 680 nm, resp., F-8807; Invitrogen, USA) diluted 400 times with distilled water was added to the solidified silicone. After approximately 10 minutes, the substrate was washed with distilled water. Young's modulus of the silicone substrate was typically 1.0 kPa [35].
2.3. Live Cell Imaging and Image Processing for Long-Term Observation of Cell Migration
Long-term observations of Swiss 3T3 fibroblast migration were performed at 37°C 5% CO2 by phase contrast microscopy using an inverted microscope (ECLIPSE Ti-E; Nikon, Tokyo, Japan) equipped with the Perfect Focus System, a digital camera (Retiga-4000R CCD camera; QImaging, Canada), and a Plan Fluor 10x objective (NA 0.30; Nikon). Phase contrast images were captured every 10 minutes for up to 24 h controlled with NIS-Elements AR software (Nikon). The images were 1024 × 1024 pixels with a resolution of 1.48 μm/pixel. On the basis of the phase contrast images, cell edges were determined manually.
2.4. Live Cell Imaging and Image Processing for Observation of Actin and Zyxin
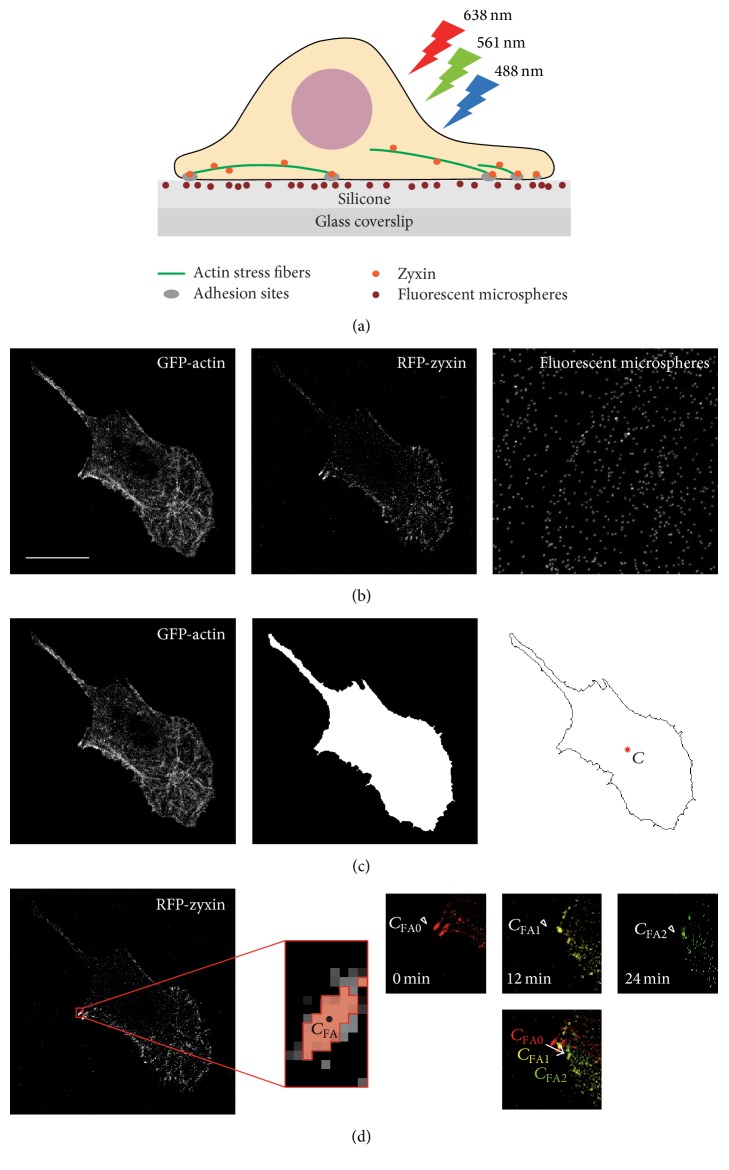
Swiss 3T3 fibroblasts expressing pAcGFP1-actin and pTagRFP-zyxin plated on the silicone substrate embedded with fluorescent dark red microspheres (Figure 1(a)) were observed at 37°C 5% CO2 using laser scanning confocal microscopy (A1R; Nikon) with a Plan Apo 60x oil immersion objective (NA 1.40; Nikon). Fluorescent images together with differential interference contrast (DIC) images were acquired every 3 minutes for up to 60 minutes. Here, the duration was limited to be 60 minutes that was shorter than the duration of images with phase contrast microscopy, which was due to the color shading especially in RFP-zyxin images. At each cycle of image capturing, z-stack fluorescent imaging was performed on 0.2 μm sections for a total thickness of 2.0 μm, the z-range of which included the top surface of the substrate and the bottom of the cell. Due to the difference in existing height positions among GFP-actin, RFP-zyxin, and dark red microspheres, a maximum intensity projection (MIP) image was configured from 5 series of slices from a total of 11 series of slices for each fluorescent image. One example is shown in Figure 1(b): MIP images of GFP-actin and RFP-zyxin were created from the 7th slice (z = 1.2 μm) to the 11th slice (z = 2.0 μm) from the bottom whereas the MIP images of fluorescent dark red microspheres were created from the 1st (z = 0 μm) to the 5th slice (z = 0.8 μm). From this imaging, we collected 3 sets of 512 × 512 pixels fluorescent images together with DIC images for a maximum of 21 cycles. Image resolution ranged from 0.14 to 0.21 μm/pixel.
Figure 1.
Schematics of image acquisition and processing. (a) Swiss 3T3 fibroblasts expressing GFP-actin and RFP-zyxin were plated on a silicone substrate in which fluorescent dark red microspheres were embedded. GFP, RFP, and dark red microspheres were excited by lasers at 488, 561, and 638 nm, respectively. (b) Examples of maximum intensity projection (MIP) images of GFP-actin, RFP-zyxin, and fluorescent dark red microspheres at time t = 0 minutes. In this case, the MIP images of GFP-actin and RFP-zyxin were created from images #7 (z = 1.2 μm) to #11 (z = 2.0 μm), whereas the MIP image of fluorescent microspheres was created from the images #1 (z = 0 μm) to #5 (z = 0.8 μm). Scale bars: 20 μm. (c) Image processing to identify the cell edge from an MIP image of GFP-actin. The position of the area centroid C is represented by a red asterisk. (d) Image processing for the identification of FAs from an MIP image of RFP-zyxin. Enlarged image around an FA cropped from the MIP image of RFP-zyxin is shown. The image is binarized locally, and the FA area with the area centroid C FA is shown in red with a black dot. Relocation of the FA is shown on the right. In this example, from 0 to 24 minutes, the position of the area centroid of the FA changed from C FA0 to C FA2.
All image processing was performed using the configured MIP images, which were saved as 12 bit gray scale images (Figure 1(c), left). The gray scale GFP-actin images were binarized using Otsu's method [36] and subsequently eroded, opened, and dilated (Figure 1(c), middle). Cell edges were found using the outline detection algorithm with the “bwperim” function in MATLAB. The obtained cell outline and area centroid are shown in Figure 1(c) (right). The area centroid was calculated from the binarized image by , where and m i are the coordinates and pixel value of each pixel, respectively. m i should be 1 (white) or 0 (black) for binarized images, and M is determined to be ∑i m i.
In each sequential MIP image of RFP-zyxin, an FA can be classified either to be born, to continue into the next time step, or to die. Firstly, individual FAs were identified manually from the gray scale RFP-zyxin images, and the duration of each FA was obtained from the time the FA was born to the time it died. Secondly, in order to calculate the area and area centroid for each FA, gray scale RFP-zyxin images were cropped locally around each FA and they were binarized using Otsu's method [36] (Figure 1(d), left). We determined individual FA areas as the number of pixels in the locally binarized image for each FA. In addition, an area centroid for each FA was also calculated using the same equation as for the whole cell, mentioned above. Finally, relocation distance was obtained from the distance between the area centroid of an FA to be born and that of the same FA to die (Figure 1(d), right).
2.5. Classification of SFs
We defined ventral SFs to be those SFs connecting to FAs at both ends and dorsal SFs to be those connecting to only one end, with an FA close to the leading edge and the other end free or connecting to arc SFs. Strictly, ventral SFs commonly extend from an FA near the cell edge to another FA. Arc SFs, which are not anchored at FAs, can be observed on the dorsal surface of migrating cells. Lastly, dorsal SFs associate at an end with an FA close to the leading edge and rise into the dorsal part of the cell, often connecting to arc SFs [34]. In our analysis, whether SFs were ventral or dorsal was determined based on the MIP images according to the number of connection between the SFs and FAs.
2.6. Displacement Field Analysis Using Image-Based Template Matching
In order to measure the displacement field of the silicone substrate between images in time, sequential MIP images of the fluorescent dark red microspheres embedded in the silicone substrate were analyzed by template matching [37], which we implemented in MATLAB. In order to estimate the displacement field of the substrate between time phase t and t + dt, we calculated the normalized cross-correlation (NCC) function. The NCC function was calculated for each pixel in sample image I with size M × N at time t + dt according to the template T with size U × V at time t:
| (1) |
where x = 0, 1, 2,…, M − 1, y = 0, 1, 2,…, N − 1, u = 0, 1, 2,…, U − 1 and v = 0, 1, 2,…, V − 1. represents the mean of T and is the mean of I.
3. Results
3.1. Cell Turning during Long-Term Migration
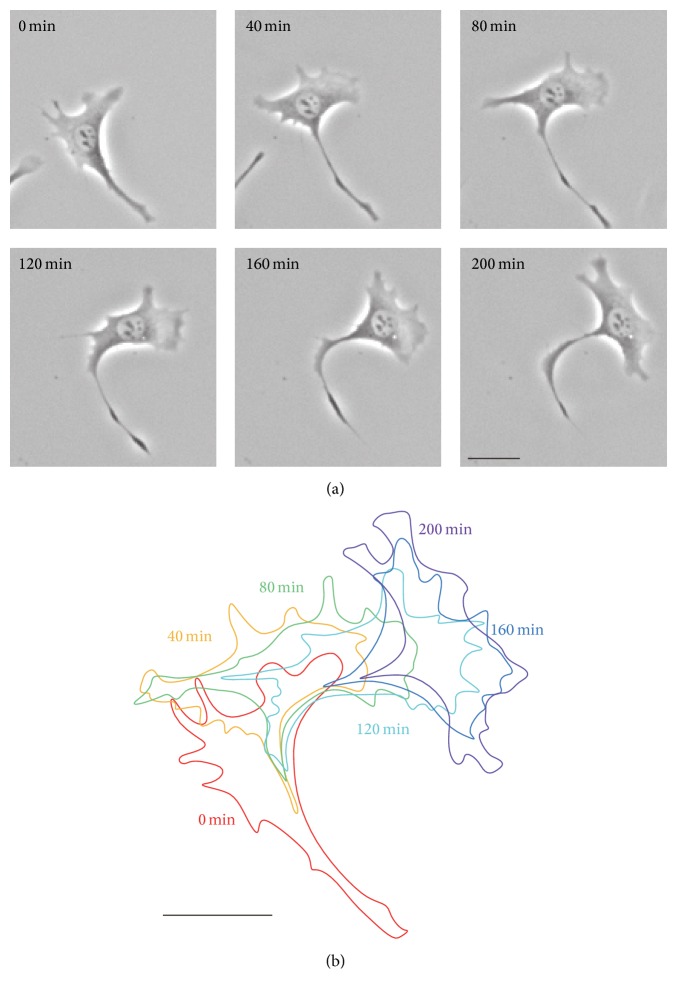
Long-term observations of Swiss 3T3 fibroblast migration were performed on a glass substrate by phase contrast microscopy. A total of 19 cells were observed: 2 cells showed directed migration; 7 cells lost their polarity and remained at the same position; and 10 cells showed more than 90° turning with large deformation during slow migration. Four of these 10 cells in particular showed unusual turning behavior, a representative example of which is shown in Figure 2. As seen in Figure 2, the cell turned with the collapse of the initial leading edge, followed by the formation of new lamellipodia, orthogonal to the original direction of migration.
Figure 2.
A typical example of an image sequence of a Swiss 3T3 fibroblast exhibiting turning behavior. (a) Sequential phase contrast images of the cell every 40 minutes for up to 200 minutes. The cell turned with the collapse of the initial leading edge, followed by the formation of new lamellipodia, orthogonal to the original direction of migration. In this study, a total of 19 cells were observed and 10 cells showed more than 90° turning with large deformation during slow migration. Four of these 10 cells in particular showed such turning behavior. (b) Time sequence of the manually extracted outline of the cell in (a), with color denoting time elapsed. Scale bars: 20 μm.
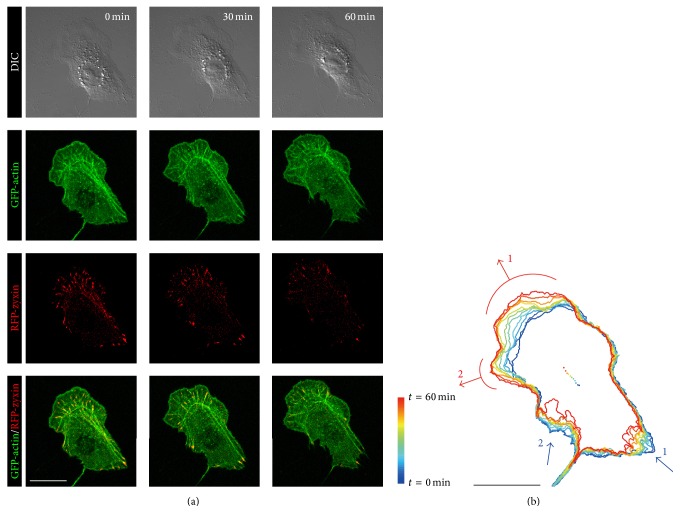
To focus on intracellular self-assembling actin cytoskeletal structure coupling with the dynamics of FAs in turning cells, we acquired time-lapse fluorescent images of migrating Swiss 3T3 fibroblasts expressing GFP-actin and RFP-zyxin with laser confocal microscopy and DIC microscopy. As shown in Figure 3(a), this setup enabled us to detect bundled filament-like actin SFs and spot-like FAs in cells establishing front-back polarity on the basis of direction of migration. Figure 3(b) represents the direction of the protrusion and retraction by red and blue arrows, respectively. The cell protruded largely to the upper region (red arrow 1) and also had a small protrusive region to the upper left (red arrow 2). At the cell rear, the lower right (blue arrow 1) and lower left (blue arrow 2) regions retracted. Here, the direction of red arrow 1 was almost the same as that of blue arrows 1 and 2, whereas the direction of red arrow 2 was perpendicular to that of the blue arrows. This suggests that the cell was turning from the direction of red arrow 1 to the direction of red arrow 2.
Figure 3.
Protrusion and retraction during migration of a Swiss 3T3 fibroblast. (a) Time-lapse images of DIC, GFP-actin, and RFP-zyxin of cells expressing GFP-actin and RFP-zyxin at t = 0, 30, and 60 minutes. (b) Sequential images of outlines of the cell in (a) are depicted together with the centroid of the cell marked by dots every 6 minutes. The positions of protrusion and retraction are represented by red and blue arrows, respectively. Scale bars: 20 μm.
3.2. Local FA Dynamics: Different Characteristics in the Front, Intermediate Lateral, and Rear Regions
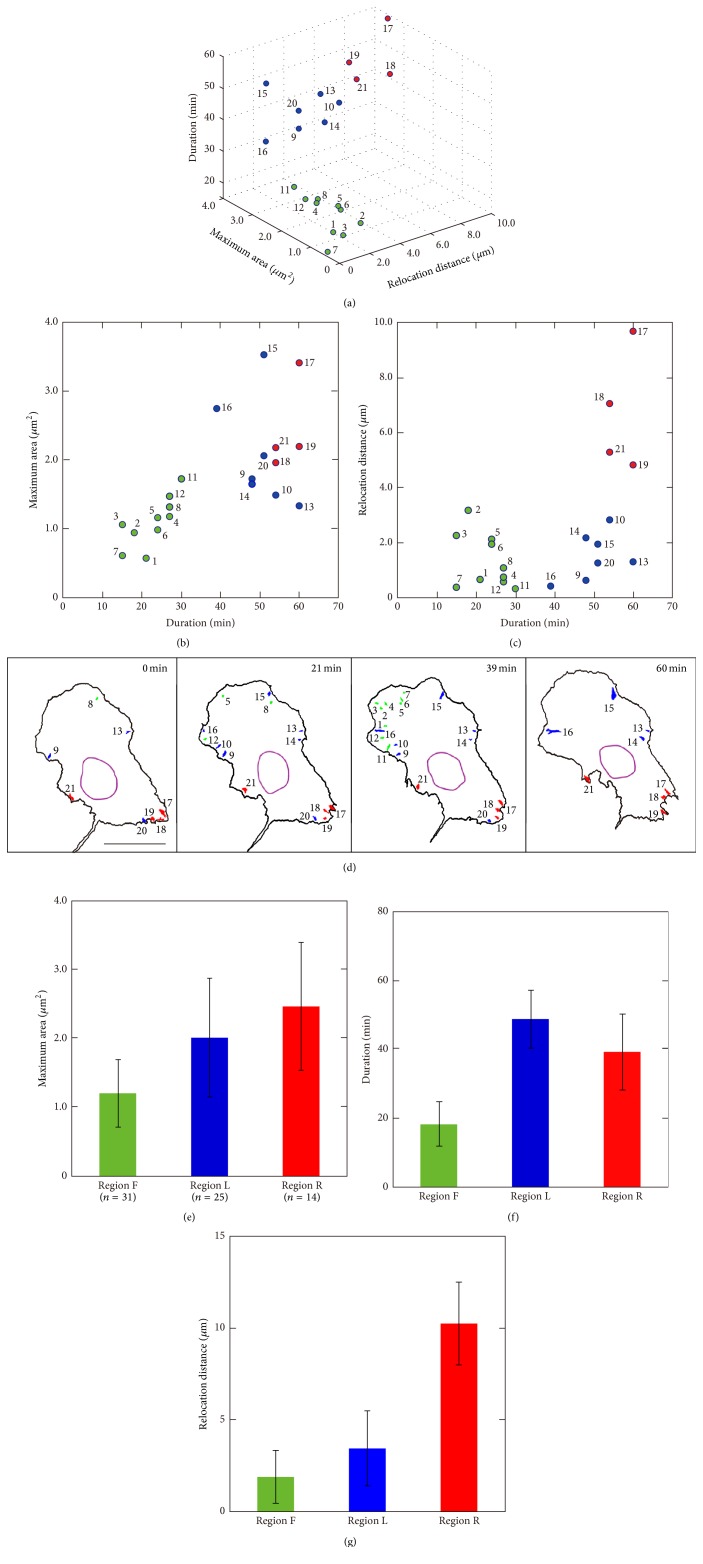
To analyze FA dynamics, we first quantitatively characterized FA dynamics in a single cell. We extracted FAs from the cell shown in Figure 3(a), and then duration, maximum area, and relocation distance of each FA were obtained by image processing according to the method explained in Figure 1(d). As shown in Figures 4(a), 4(b), and 4(c), 21 FAs were extracted. On the basis of k-mean clustering [38], these 21 FAs were classified into 3 groups: one with a short duration, small maximum area, and short relocation distance (green circles); one with a long duration, large maximum area, and long relocation distance (red circles); and one with a long duration, large maximum area, and short relocation distance (blue circles). The spatial distribution of the 21 FAs shown in Figure 4(d) demonstrated that the FAs indicated by the green circles were located at the front protrusive region, whereas the FAs indicated by the red circles were in the cell rear region where the cell retracted. The FAs indicated by the blue circles were rather scattered but were approximately in the lateral region between the cell front and rear. On the basis of these characteristics of the FAs, the migrating cell seemed to be divided into 3 regions: front, intermediate lateral, and rear regions.
Figure 4.
Classification of FAs on the basis of k-mean clustering. (a) The relationship among duration, maximum area, and relocation distance of 21 FAs extracted from the cell in Figure 3. Duration versus maximum area of the FAs and duration versus relocation distance of the FAs are also depicted in (b) and (c), respectively. On the basis of k-mean clustering, these FAs were classified into three groups: green, blue, and red circles. (d) Spatial distribution of these FAs at t = 0, 21, 39, and 60 minutes is shown. The FAs indicated by the green circles were located at the front protrusive region (region F), whereas the FAs indicated by the red circles were in the cell rear (region R). The FAs indicated by the blue circles were approximately in the lateral region between the cell front and the cell rear regions (region L). Scale bar: 20 μm. (e, f, g) Average and standard deviations of the maximum area, duration, and relocation distance of FAs are shown in (e), (f), and (g), respectively. For statistical analysis, a total of 70 FAs were extracted from 10 cells. One-way analysis of variance demonstrated significant difference between FAs in region F, region L, and region R.
To confirm statistically whether this division of the cell into 3 regions based on the characteristics of the FAs was typical, a total of 70 FAs extracted from 10 cells were again analyzed by k-mean clustering and the FAs were classified by the region they were located in. The results found that the FAs were indeed classified into 3 groups: green group mainly existing in the front region (region F), blue group mainly existing in the intermediate lateral region (region L), and red group mainly existing in the rear region (region R). The averages and standard deviations of the maximum area, duration, and relocation distance of the FAs in each region are shown in Figures 4(e), 4(f), and 4(g), respectively. One-way analysis of variance demonstrated significant difference in maximum area between FAs in region F, region L, and region R in Figure 4(e) (F = 16.8; n = 70; df = 2; p < 0.001). The same analyses were performed, and both the difference in duration between FAs in three regions in Figure 4(f) (F = 99.4; n = 70; df = 2; p < 0.001) and the difference in relocation distance between FAs in three regions in Figure 4(g) (F = 101.8; n = 70; df = 2; p < 0.001) were found to be significant.
These results demonstrated that the cell could be divided clearly into 3 regions: (1) front region, where FAs had a small maximum area, short duration, and short relocation distance; (2) intermediate lateral region between the cell front and cell rear, where FAs had a large maximum area, long duration, and short relocation distance; and (3) rear region, where FAs had a large maximum area, long duration, and long relocation distance.
3.3. Local FA Dynamics: Relationship between FA Relocation and Extracellular Matrix Deformation
The substrate under the front region of the cell was displaced several micrometers, whereas the substrate under the rear region was displaced much less than that shown in Figure 5. The displacement field of the silicone substrate under the other 9 cells also showed the same results.
Figure 5.
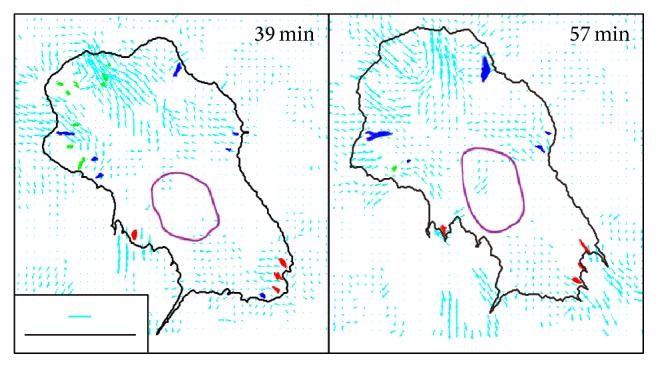
Displacement field of the substrate. Displacement vectors of the substrate analyzed by image-based template matching are shown by the cyan arrows. The length of the displacement vectors is enlarged from the original size and its scale is shown by the cyan scale bar (3 μm). The positions of the FAs in the front, intermediate lateral, and rear regions are shown in green, blue, and red, respectively. Black scale bar: 20 μm. The analysis here is based on the same data presented in Figures 3 and 4(a)–4(d).
According to Figure 4(g), the relocation distance of the FAs in the front region was several micrometers, whereas that in the rear region was approximately 10 μm. When compared with the displacement of the substrate under the front and the rear regions, this indicates that the FAs in the front region were firmly linked to the substrate and moved together with it. The FAs in the rear region were less strongly linked to the substrate and instead slipped on it. These results are consistent with a previous report that motile fibroblasts have a front-towing mechanism, where the cells exert strong propulsive forces within a discrete zone near the leading edge, resulting in the cell body being towed forward during migration [39], with sliding trailing adhesion at the cell rear [30].
3.4. Local FA Dynamics: Quantitative Characterization of Growth and Decay in the Front, Intermediate Lateral, and Rear Regions
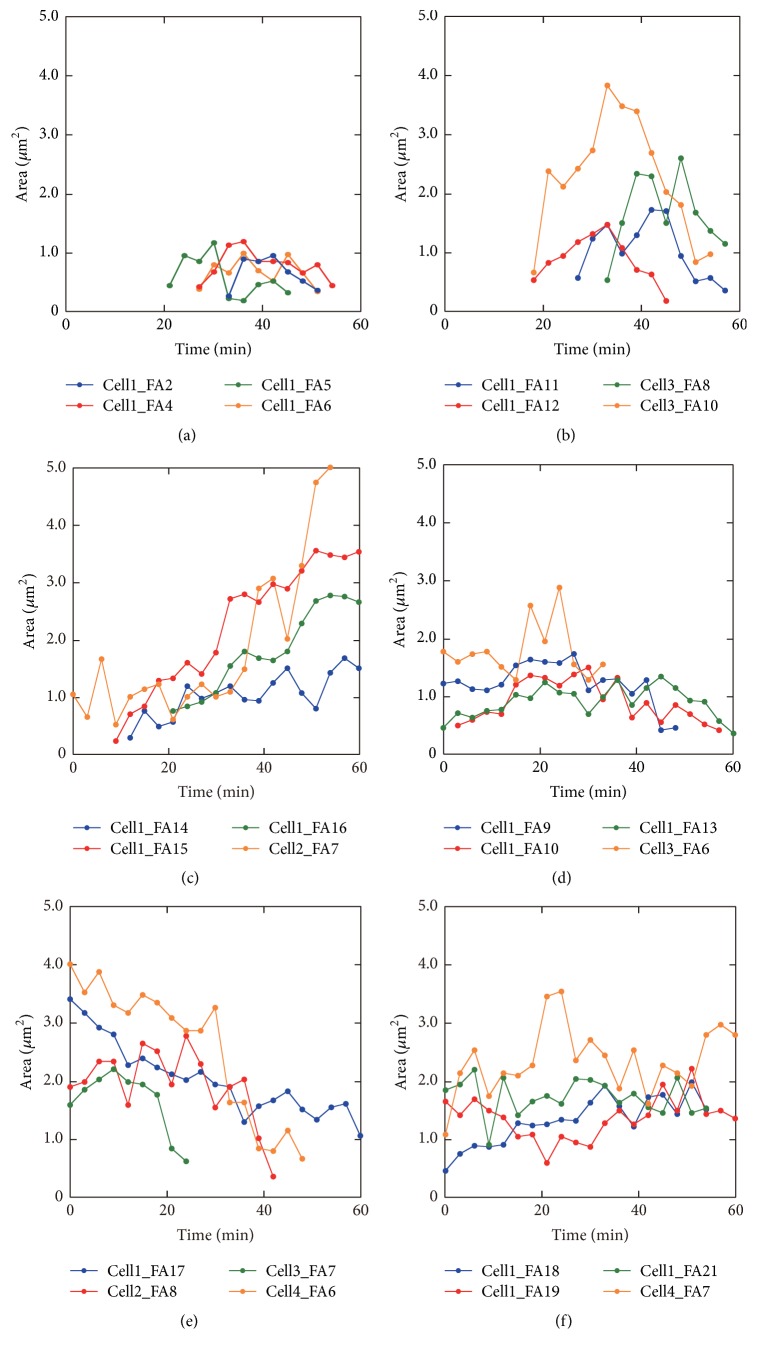
For a more detailed understanding of the difference in the dynamics of the FAs in each region, time courses of the area of the FAs in the front, intermediate lateral, and rear regions were analyzed quantitatively (Figure 6).
Figure 6.
Growth and decay of FAs in the front, intermediate lateral, and rear regions. Time courses of FA area in the front (a, b), intermediate lateral (c, d), and rear regions (e, f) are shown. Representative 24 FAs from 4 cells, including the cell in Figure 3 (Cell 1) are used for the analysis. FAs were further classified into 2 patterns in each region. The FA number for Cell 1 corresponds to that shown in Figure 4(d).
In the front region of the cell, FA dynamics were classified further into 2 patterns. The first one was, as shown in Figure 6(a), the area of the FAs which was approximately 1.0 μm2 or less and their area fluctuated between small and big repeatedly, indicating that the FAs were unstable and not maturing. Their lifetime was less than 30 minutes, which was short compared to the FAs in the other regions. The second one is shown in Figure 6(b); the area of FAs was increased initially and then it decreased. This might correspond to the assembly and disassembly phases of FAs [40]. The lifetime of both patterns of FA dynamics (Figures 6(a) and 6(b)) was approximately 30 minutes.
In the intermediate lateral region, as shown in Figures 6(c) and 6(d), the FAs showed 2 patterns of dynamics. The first typical pattern is shown in Figure 6(c), in which the area increased over time. The other pattern is shown in Figure 6(d), in which the area of the FAs was almost constant for up to 60 minutes. The duration of the FAs in Figures 6(c) and 6(d) was more than 39 minutes, which was longer than that for the FAs in the front region (Figures 6(a) and 6(b)).
The change in area of the FAs in the rear region is shown in Figures 6(e) and 6(f). The FAs in this region showed 2 patterns of the dynamics. In Figure 6(e), the area decreased over time. Conversely, as shown in Figure 6(f), the area of the other FAs remained almost constant for up to 60 minutes.
3.5. Local Dynamics of SFs Coupled with the FAs in the Front, Intermediate Lateral, and Rear Regions
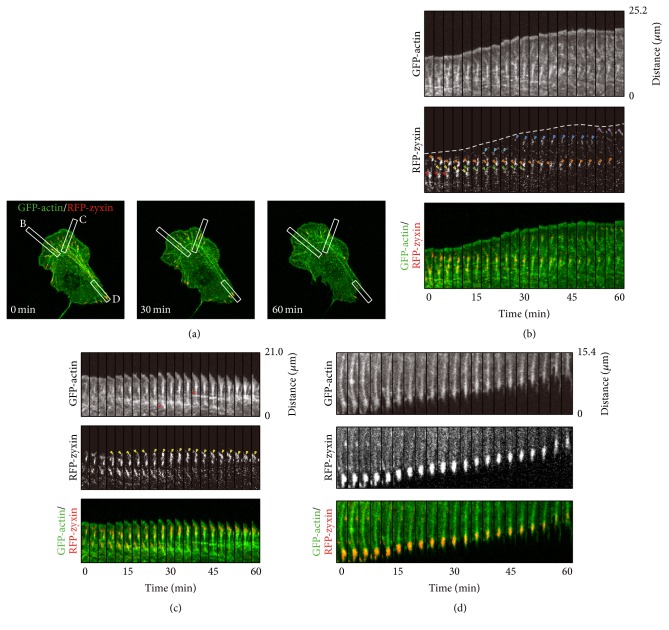
Next, the local dynamics of actin SFs and FAs in the front, intermediate lateral, and rear regions were investigated (Figure 7). Time-lapse montages of GFP-actin and RFP-zyxin were built for the front region (region F, boxed area B in Figure 7(a)), intermediate lateral region (region L, boxed area C), and rear region (region R, boxed area D).
Figure 7.
Dynamics of actin SFs together with FAs. The analysis here is based on the same data presented in Figures 3, 4(a)–4(d) and 5. (a) Merged images of GFP-actin and RFP-zyxin. (b) The time-lapse montages of GFP-actin and RFP-zyxin were built from the boxed area B in panel (a) (region F). The cell edge extracted from the montage of GFP-actin is indicated by a dotted line in the montage of RFP-zyxin. The edge of the cell moved gradually in the upper direction, which indicated that the cell protruded. The montage of RFP-zyxin demonstrated that new FAs (orange, yellow, green, light blue, and blue arrowheads) were formed one after another at an anterior position to the preexisting FAs (red arrowheads). The FAs in the region F formed simultaneously with SFs (thick bundled-like filaments in the montage of GFP-actin) and disappeared simultaneously with the disappearance of the SFs. (c) Time-lapse montages were built from the boxed area C in panel (a) (region L). From the montage of GFP-actin, the cell did not protrude. Yellow arrowheads in the montage of RFP-zyxin showed that a small FA appeared close to the cell edge and its area became gradually larger. As for the case in (c), an SF was observed vertically from the position of the FA and intersecting SF connections were also observed (red arrowheads in the montage of GFP-actin). (d) Time-lapse montages were built from the boxed area D in panel (a) (region R). From the montages of GFP-actin and RFP-zyxin, we could recognize the relocating FA connected to a bundle-like SF with a contractile movement.
In the front region, as shown in the montage of GFP-actin in Figure 7(b), the edge of the cell moved gradually in the upper direction, which indicated that the cell protruded. The montage of RFP-zyxin demonstrated that new FAs (orange, yellow, green, light blue, and blue arrowheads) were formed one after another at an anterior position to the preexisting FAs (red arrowheads), which is consistent with previous reports [41, 42]. As shown in the montage of RFP-zyxin in Figure 7(b), some FAs (indicated by yellow and light blue arrowheads) showed a short duration, whereas some FAs (indicated by orange and blue arrowheads) existed for nearly 30 minutes. From the comparison of the montages of GFP-actin and RFP-zyxin, both types of FAs formed simultaneously with SFs (thick bundled-like filaments) and disappeared simultaneously with the disappearance of the SFs.
The intermediate lateral region of the cell did not protrude (Figure 7(c)). The montage of RFP-zyxin showed that a small FA appeared close to the cell edge and its area became gradually larger (yellow arrowheads). In this case, as for the case in Figure 7(b), an SF was observed vertically from the position of the FA. However, as shown at 27 minutes in Figure 7(c), the vertical SF connected to the other SF that was aligned parallel to the leading edge (red arrowhead), which was a different behavior to the SFs in the front region in Figure 7(b). The same intersecting SF connection was observed again at 39 minutes in Figure 7(c) (red arrowhead) and in 8 of the 10 cells. This observation in Figure 7(c) together with the image of SFs in the whole cell in Figure 7(a) indicated that these connecting SFs were part of an arc SF that existed parallel to the leading edge. The interaction of vertical SFs with arc SF was consistent with a previous report [43].
The local SF and FA dynamics in the rear region are shown in Figure 7(d). The time-lapse montage of RFP-zyxin shows that a large FA existed initially and it relocated toward the upper direction, indicating that the FA in the rear region relocated toward the nucleus. The time-lapse montage of GFP-actin in Figure 7(d) shows that the relocating FA connected to a bundle-like SF with a contractile movement. This result is consistent with earlier studies that described sliding trailing adhesions with SFs [30, 44].
3.6. Globally Coordinated SF Dynamics Coupled with FAs
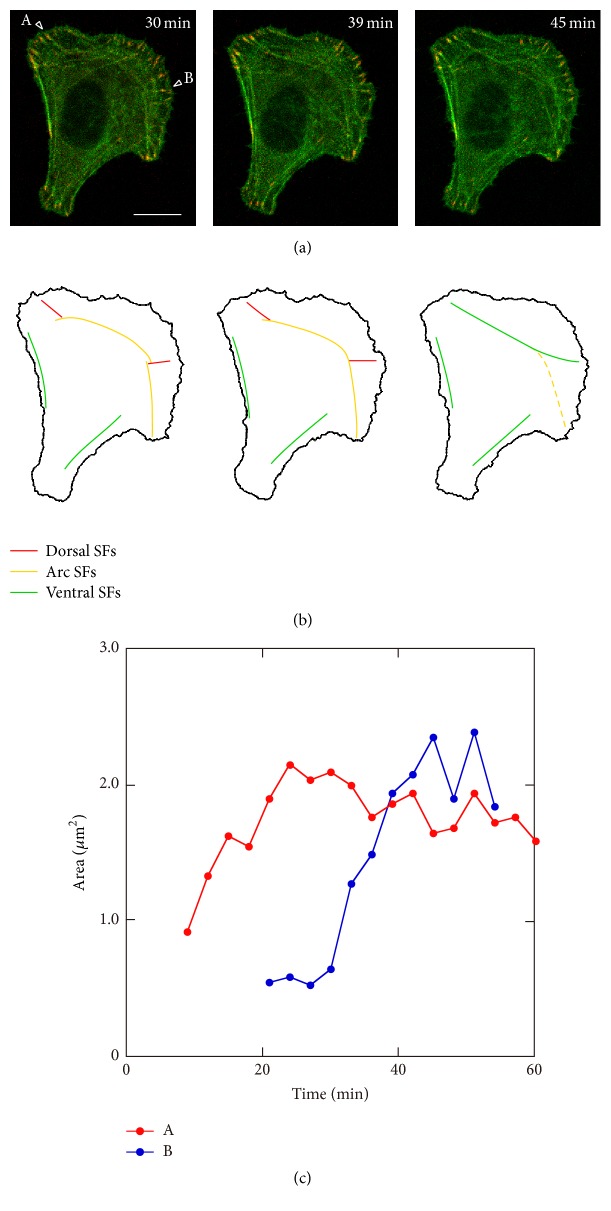
In Figure 8, how SFs connect globally is shown together with the change in stability of FAs. At 30 minutes, there were 2 FAs in the intermediate lateral region, which are shown by white triangles A and B (Figure 8(a)). Short SFs (red lines in Figure 8(b)) were assembled from both FAs toward the inside of the cell, which are dorsal SFs, and they seemed to connect to the other long SFs parallel to the leading edge, that is, arc SFs (yellow lines in Figure 8(b)). At this moment, the dorsal SF from the FA (indicated by B in Figure 8(a)) connected to 2 arc SFs. Then, at 39 minutes, both arc SFs parallel to the leading edge started to fuse into a single arc SF. At this time point, 2 dorsal SFs and the arc SF still seemed to be distinct; that is, there were 3 SFs between the FA-A and the FA-B. At 45 minutes, these 3 SFs became a single SF linked to the FAs, which is a ventral SF (green line in the intermediate region in Figure 8(b)). A similar change in alignment of SFs with FA in the front and intermediate regions of the cell could be also observed in 3 migrating cells.
Figure 8.
Change in alignment of SFs together with the change in FA stability in the front and intermediate regions. (a) Merged images of GFP-actin and RFP-zyxin. The time after the start of observation is denoted in minutes. (b) SFs of interest extracted from (a). Each image in (b) corresponds to that in (a). (c) Temporal change in FA area indicated as “A” and “B” in (a). At 30 minutes, there were 2 FAs in the intermediate lateral region (“A” and “B” in (a)). Short dorsal SFs (red lines in (b)) were assembled from both FAs toward the inside of the cell and they seemed to connect to the other two long arc SFs (yellow lines in (b)). Then, at 39 minutes, both arc SFs started to fuse into a single arc SF. At this time point, 2 dorsal SFs and the arc SF still seemed to be distinct. At 45 minutes, these 3 SFs became a single SF linked to the FAs, which is ventral SF (green line in the intermediate region in (b)).
From 30 minutes to 45 minutes, the area of FA-A was almost constant, indicating that the rate of FA assembly was balanced by FA disassembly. This will result in the apparent stability of the FA. The area of FA-B increased during the period, which indicated that FA-B matured gradually. The result indicated that there were FAs at the intermediate lateral regions of both sides of the cell that were connected by several dorsal SFs, and these SFs fused gradually with arc SFs and finally became a single ventral SF with maturing and apparently stable FAs at both ends (green line in the intermediate region in Figure 8(b)). This SF assembly with FAs was also reported previously [43]. Conversely in the cell rear, from 30 minutes to 45 minutes, there were several thick and long SFs, which are ventral SFs (green lines in the rear region in Figure 8(b)), aligned close to the lateral side of the cell with FAs at both ends. A similar transition in the alignment of SFs with FAs in the intermediate region of the cell was observed in three other migrating cells.
4. Discussion
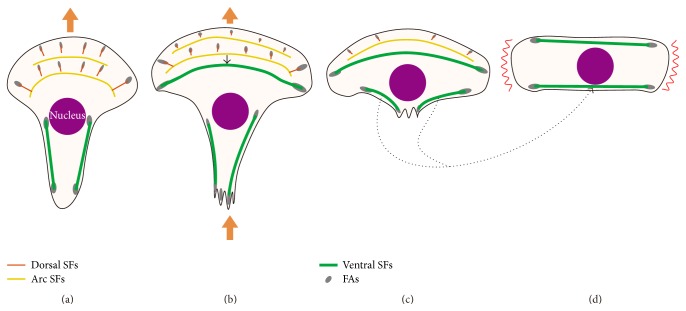
In this study, we focused on the dynamics of FAs and SFs during the cycle of cell migration steps in Swiss 3T3 fibroblasts: leading edge protrusion at the cell front, contractile force generation against adhesions and release of rear adhesions, and retraction of the cell rear. Our precise observations and quantitative analyses of FA assembly-disassembly demonstrated that the cycle of cell migration steps consisted of 3 distinct FA dynamics, and FAs with different dynamics were distributed in different cell regions: front, intermediate lateral, and rear regions (Figures 4, 6, and 7). Furthermore, analysis of the spatiotemporal changes in SFs in relation to the assembly-disassembly of FAs clarified SF dynamics locally (Figure 7) and globally (Figure 8) coupled with FA dynamics. On the basis of the results, Figure 9 summarizes the hypothesized mechanism of spontaneous polarity change that leads to cell turning behavior.
Figure 9.
Hypothesized mechanism of spontaneous polarity change resulting in cell turning behavior. (a) Protrusion at the cell front. (b) Protrusion at the cell front together with retraction at the cell rear. A single ventral SF could be connected or fused from dorsal SFs and arc SFs in the intermediate region of the cell (green line). (c) End of retraction at the cell rear. The upper single ventral SF is the SF formed in (b), whereas the lower 2 ventral SFs are those in the rear region in (b), which could become a single ventral SF subsequently (dotted arrow). (d) End of the cyclic process of cell migration. Possible protrusion site of the cell is shown by the red winding lines, which is perpendicular to that in the initial direction of protrusion. This means that the cell could change its polarity, resulting in cell turning behavior.
The first step of the migration cycle is protrusion of the cell front (Figure 9(a)). Some FAs newly assembled at the cell front were unstable (Figure 6(a)), while the others were assembled and disassembled quickly (Figure 6(b)). In the cell front, as illustrated by the red line in Figure 9(a), dorsal SFs extended perpendicular to the leading edge from the newly formed FAs toward the inside of the cell and then disappeared simultaneously with disassembly of the FAs (Figure 7(b)). Conversely, in the intermediate lateral region of the cell, some dorsal SFs connected or fused to long arc SFs parallel to the leading edge (Figure 7(c)), which is depicted by the yellow lines in Figure 8(a). These SFs finally became a single ventral SF (Figure 8), which is depicted by the green line in the intermediate region of the cell in Figure 9(b), with intermediate lateral FAs at both ends. In the cell rear, retraction occurred. Cell retraction might be due to the contraction of ventral SFs, which is depicted by the green lines in the cell rear in Figures 9(a), 9(b), and 9(c), accompanied by translocation of the FAs at the end of those SFs (Figure 7(d)).
After retraction in the cell rear, as shown in Figures 9(c) and 9(d), ventral SFs with FAs at both ends would align in the horizontal direction. Here in Figure 9(d), one of the SFs will come from the newly formed ventral SF with FAs at both ends in the intermediate region in Figure 9(b) (green line) [28]. The other one could possibly be formed by the annealing of 2 or more ventral SFs [45] at the cell rear during the process shown in Figures 9(c) and 9(d) (dotted arrows). In Figure 9(d), the possible protrusion site of the cell is assumed to be in the peripheral region (the red winding lines), along which there are no SFs. This assumption is supported by previous findings that localized tension transfer across integrins in FAs could locally activate Rac and Cdc42, which leads to the formation of lamellipodia [46], whereas mechanical stresses in FAs suppress lamellipodial protrusion through inhibition of Rac activation [47]. Therefore, the regions indicated by the red winding lines in Figure 9(d) could protrude with the formation of new FAs together with SFs. It should be noted that the direction of the new protrusion site is perpendicular to that in the initial state of the cell in Figure 9(a), which leads the cell to spontaneous polarity change and resulting turning behavior.
Cytoskeletal rearrangements where ventral SFs are assembled from dorsal SFs and arc SFs have been reported from the molecular point of view [43] and recently reviewed [48, 49]. However, to our knowledge, the relationship between such cytoskeletal rearrangements and cell migration has not been reported. In the present study, we show that the SF assembly, coupled with growing and apparently stable FA dynamics, occurred at the end of dorsal SFs in the intermediate lateral region of the cell. From this observation, we proposed the model in Figure 9, showing that such globally coordinated SF dynamics with FAs would lead to cell turning behavior during migration. Continuous protrusion in the direction of the cell might be the simplest description for cell turning behavior, which could be explained by the well-known key steps for migration: protrusion at the leading edge, adhesion to the extracellular matrix via FAs, and subsequent detachment. Our model could provide further novel insights into the mechanism of polarity change driven by self-assembling actin cytoskeletal structures. In order to establish the mechanism of polarity change mentioned here, further observation would be needed to confirm the process after Figure 9(d).
5. Conclusions
In this study, we proposed a hypothesis for cell turning focusing on the coupling dynamics of actin SFs and FAs in Swiss 3T3 fibroblasts. In the intermediate lateral region of the cell, we observed the FAs maturing and becoming stable. In addition, our analysis demonstrated that 2 dorsal SFs assembled from FAs close to the leading edge and then connected into arc SFs, fused gradually into a single ventral SF. This change in SF organization with cell retraction in the first cycle of migration followed by a newly formed protrusion in the next cycle will lead to cell turning during migration in Swiss 3T3 fibroblasts.
Acknowledgments
The authors thank Dr. Yoshiaki Iwadate (Yamaguchi University, Yamaguchi, Japan) for their technical advice and help in making the silicone substrate embedded with microspheres. The authors also thank Mr. Daishi Inoue (RIKEN, Wako, Japan) and Dr. Michio Murakoshi (Kagoshima University, Japan) for their technical help in observing the surface topology of the silicone substrate embedded with microspheres using scanning electron microscopy and atomic force microscopy, respectively. This study was supported in part by Japan Society for the Promotion of Science KAKENHI Grant nos. 24700448, 25630046, and 16K01350.
Competing Interests
The authors declare that there is no conflict of interests regarding the publication of this paper.
Authors' Contributions
Michiko Sugawara and Hiromi Miyoshi contributed equally to this work.
References
- 1.Detrich H. W., III, Kieran M. W., Chan F. Y., et al. Intraembryonic hematopoietic cell migration during vertebrate development. Proceedings of the National Academy of Sciences of the United States of America. 1995;92(23):10713–10717. doi: 10.1073/pnas.92.23.10713. [DOI] [PMC free article] [PubMed] [Google Scholar]
- 2.Lutolf M. P., Hubbell J. A. Synthetic biomaterials as instructive extracellular microenvironments for morphogenesis in tissue engineering. Nature Biotechnology. 2005;23(1):47–55. doi: 10.1038/nbt1055. [DOI] [PubMed] [Google Scholar]
- 3.Puram S. V., Bonni A. Cell-intrinsic drivers of dendrite morphogenesis. Development. 2013;140(23):4657–4671. doi: 10.1242/dev.087676. [DOI] [PMC free article] [PubMed] [Google Scholar]
- 4.Krawczyk W. S. A pattern of epidermal cell migration during wound healing. The Journal of Cell Biology. 1971;49(2):247–263. doi: 10.1083/jcb.49.2.247. [DOI] [PMC free article] [PubMed] [Google Scholar]
- 5.Martin P. Wound healing—aiming for perfect skin regeneration. Science. 1997;276(5309):75–81. doi: 10.1126/science.276.5309.75. [DOI] [PubMed] [Google Scholar]
- 6.Miyoshi H., Adachi T. Topography design concept of a tissue engineering scaffold for controlling cell function and fate through actin cytoskeletal modulation. Tissue Engineering Part B: Reviews. 2014;20(6):609–627. doi: 10.1089/ten.teb.2013.0728. [DOI] [PMC free article] [PubMed] [Google Scholar]
- 7.Lecaudey V., Gilmour D. Organizing moving groups during morphogenesis. Current Opinion in Cell Biology. 2006;18(1):102–107. doi: 10.1016/j.ceb.2005.12.001. [DOI] [PubMed] [Google Scholar]
- 8.Yumura S., Itoh G., Kikuta Y., Kikuchi T., Kitanishi-Yumura T., Tsujioka M. Cell-scale dynamic recycling and cortical flow of the actin-myosin cytoskeleton for rapid cell migration. Biology Open. 2013;2(2):200–209. doi: 10.1242/bio.20122899. [DOI] [PMC free article] [PubMed] [Google Scholar]
- 9.Wedlich-Soldner R., Li R. Spontaneous cell polarization: undermining determinism. Nature Cell Biology. 2003;5(4):267–270. doi: 10.1038/ncb0403-267. [DOI] [PubMed] [Google Scholar]
- 10.Chung C. Y., Funamoto S., Firtel R. A. Signaling pathways controlling cell polarity and chemotaxis. Trends in Biochemical Sciences. 2001;26(9):557–566. doi: 10.1016/S0968-0004(01)01934-X. [DOI] [PubMed] [Google Scholar]
- 11.Zhang J., Guo W.-H., Wang Y.-L. Microtubules stabilize cell polarity by localizing rear signals. Proceedings of the National Academy of Sciences of the United States of America. 2014;111(46):16383–16388. doi: 10.1073/pnas.1410533111. [DOI] [PMC free article] [PubMed] [Google Scholar]
- 12.Oyama K., Zeeb V., Kawamura Y., et al. Triggering of high-speed neurite outgrowth using an optical microheater. Scientific Reports. 2015;5, article 16611 doi: 10.1038/srep16611. [DOI] [PMC free article] [PubMed] [Google Scholar]
- 13.Pelham R. J., Jr., Wang Y.-L. Cell locomotion and focal adhesions are regulated by substrate flexibility. Proceedings of the National Academy of Sciences of the United States of America. 1997;94(25):13661–13665. doi: 10.1073/pnas.94.25.13661. [DOI] [PMC free article] [PubMed] [Google Scholar]
- 14.Lo C.-M., Wang H.-B., Dembo M., Wang Y.-L. Cell movement is guided by the rigidity of the substrate. Biophysical Journal. 2000;79(1):144–152. doi: 10.1016/S0006-3495(00)76279-5. [DOI] [PMC free article] [PubMed] [Google Scholar]
- 15.Kawano T., Kidoaki S. Elasticity boundary conditions required for cell mechanotaxis on microelastically-patterned gels. Biomaterials. 2011;32(11):2725–2733. doi: 10.1016/j.biomaterials.2011.01.009. [DOI] [PubMed] [Google Scholar]
- 16.Miyoshi H., Ju J., Lee S. M., et al. Control of highly migratory cells by microstructured surface based on transient change in cell behavior. Biomaterials. 2010;31(33):8539–8545. doi: 10.1016/j.biomaterials.2010.07.076. [DOI] [PubMed] [Google Scholar]
- 17.Ghibaudo M., Trichet L., Le Digabel J., Richert A., Hersen P., Ladoux B. Substrate topography induces a crossover from 2D to 3D behavior in fibroblast migration. Biophysical Journal. 2009;97(1):357–368. doi: 10.1016/j.bpj.2009.04.024. [DOI] [PMC free article] [PubMed] [Google Scholar]
- 18.Miyoshi H., Adachi T., Ju J., et al. Characteristics of motility-based filtering of adherent cells on microgrooved surfaces. Biomaterials. 2012;33(2):395–401. doi: 10.1016/j.biomaterials.2011.09.094. [DOI] [PubMed] [Google Scholar]
- 19.Mahmud G., Campbell C. J., Bishop K. J. M., et al. Directing cell motions on micropatterned ratchets. Nature Physics. 2009;5(8):606–612. doi: 10.1038/nphys1306. [DOI] [Google Scholar]
- 20.Chrzanowska-Wodnicka M., Burridge K. Rho-stimulated contractility drives the formation of stress fibers and focal adhesions. Journal of Cell Biology. 1996;133(6):1403–1415. doi: 10.1083/jcb.133.6.1403. [DOI] [PMC free article] [PubMed] [Google Scholar]
- 21.Burridge K., Wennerberg K. Rho and rac take center stage. Cell. 2004;116(2):167–179. doi: 10.1016/s0092-8674(04)00003-0. [DOI] [PubMed] [Google Scholar]
- 22.Mullins R. D., Heuser J. A., Pollard T. D. The interaction of Arp2/3 complex with actin: nucleation, high affinity pointed end capping, and formation of branching networks of filaments. Proceedings of the National Academy of Sciences of the United States of America. 1998;95(11):6181–6186. doi: 10.1073/pnas.95.11.6181. [DOI] [PMC free article] [PubMed] [Google Scholar]
- 23.Amann K. J., Pollard T. D. The Arp2/3 complex nucleates actin filament branches from the sides of pre-existing filaments. Nature Cell Biology. 2001;3(3):306–310. doi: 10.1038/35060104. [DOI] [PubMed] [Google Scholar]
- 24.Pollard T. D., Borisy G. G. Cellular motility driven by assembly and disassembly of actin filaments. Cell. 2003;112(4):453–465. doi: 10.1016/S0092-8674(03)00120-X. [DOI] [PubMed] [Google Scholar]
- 25.Ghosh M., Song X., Mouneimne G., Sidani M., Lawrence D. S., Condeelis J. S. Cofilin promotes actin polymerization and defines the direction of cell motility. Science. 2004;304(5671):743–746. doi: 10.1126/science.1094561. [DOI] [PubMed] [Google Scholar]
- 26.Small J. V., Resch G. P. The comings and goings of actin: coupling protrusion and retraction in cell motility. Current Opinion in Cell Biology. 2005;17(5):517–523. doi: 10.1016/j.ceb.2005.08.004. [DOI] [PubMed] [Google Scholar]
- 27.Okeyo K. O., Adachi T., Sunaga J., Hojo M. Actomyosin contractility spatiotemporally regulates actin network dynamics in migrating cells. Journal of Biomechanics. 2009;42(15):2540–2548. doi: 10.1016/j.jbiomech.2009.07.002. [DOI] [PubMed] [Google Scholar]
- 28.Burnette D. T., Manley S., Sengupta P., et al. A role for actin arcs in the leading-edge advance of migrating cells. Nature Cell Biology. 2011;13(4):371–382. doi: 10.1038/ncb2205. [DOI] [PMC free article] [PubMed] [Google Scholar]
- 29.Nemethova M., Auinger S., Small J. V. Building the actin cytoskeleton: filopodia contribute to the construction of contractile bundles in the lamella. Journal of Cell Biology. 2008;180(6):1233–1244. doi: 10.1083/jcb.200709134. [DOI] [PMC free article] [PubMed] [Google Scholar]
- 30.Rid R., Schiefermeier N., Grigoriev I., Small J. V., Kaverina I. The last but not the least: the origin and significance of trailing adhesions in fibroblastic cells. Cell Motility and the Cytoskeleton. 2005;61(3):161–171. doi: 10.1002/cm.20076. [DOI] [PubMed] [Google Scholar]
- 31.Möhl C., Kirchgessner N., Schäfer C., Hoffmann B., Merkel R. Quantitative mapping of averaged focal adhesion dynamics in migrating cells by shape normalization. Journal of Cell Science. 2012;125(1):155–165. doi: 10.1242/jcs.090746. [DOI] [PubMed] [Google Scholar]
- 32.Verkhovsky A. B., Svitkina T. M., Borisy G. G. Self-polarization and directional motility of cytoplasm. Current Biology. 1999;9(1):11–20. doi: 10.1016/S0960-9822(99)80042-6. [DOI] [PubMed] [Google Scholar]
- 33.Yam P. T., Wilson C. A., Ji L., et al. Actin-myosin network reorganization breaks symmetry at the cell rear to spontaneously initiate polarized cell motility. Journal of Cell Biology. 2007;178(7):1207–1221. doi: 10.1083/jcb.200706012. [DOI] [PMC free article] [PubMed] [Google Scholar]
- 34.Small J. V., Rottner K., Kaverina I., Anderson K. I. Assembling an actin cytoskeleton for cell attachment and movement. Biochimica et Biophysica Acta (BBA)—Molecular Cell Research. 1998;1404(3):271–281. doi: 10.1016/s0167-4889(98)00080-9. [DOI] [PubMed] [Google Scholar]
- 35.Iwadate Y., Yumura S. Molecular dynamics and forces of a motile cell simultaneously visualized by TIRF and force microscopies. BioTechniques. 2008;44(6):739–750. doi: 10.2144/000112752. [DOI] [PubMed] [Google Scholar]
- 36.Otsu N. A threshold selection method from gray-level histograms. IEEE Transactions Systems Man Cybernetics. 1979;9(1):62–66. doi: 10.1109/tsmc.1979.4310076. [DOI] [Google Scholar]
- 37.Lewis J. P. Fast normalized cross-correlation. Vision Interface. 1995;10:120–123. [Google Scholar]
- 38.Bishop C. M. Neural Networks for Pattern Recognition. Oxford University Press; 1995. [Google Scholar]
- 39.Munevar S., Wang Y.-L., Dembo M. Traction force microscopy of migrating normal and H-ras transformed 3T3 fibroblasts. Biophysical Journal. 2001;80(4):1744–1757. doi: 10.1016/S0006-3495(01)76145-0. [DOI] [PMC free article] [PubMed] [Google Scholar]
- 40.Berginski M. E., Vitriol E. A., Hahn K. M., Gomez S. M. High-resolution quantification of focal adhesion spatiotemporal dynamics in living cells. PLoS ONE. 2011;6(7) doi: 10.1371/journal.pone.0022025.e22025 [DOI] [PMC free article] [PubMed] [Google Scholar]
- 41.Webb D. J., Parsons J. T., Horwitz A. F. Adhesion assembly, disassembly and turnover in migrating cells—over and over and over again. Nature Cell Biology. 2002;4(4):E97–E100. doi: 10.1038/ncb0402-e97. [DOI] [PubMed] [Google Scholar]
- 42.Alexandrova A. Y., Arnold K., Schaub S., et al. Comparative dynamics of retrograde actin flow and focal adhesions: formation of nascent adhesions triggers transition from fast to slow flow. PLoS ONE. 2008;3(9) doi: 10.1371/journal.pone.0003234.e3234 [DOI] [PMC free article] [PubMed] [Google Scholar]
- 43.Hotulainen P., Lappalainen P. Stress fibers are generated by two distinct actin assembly mechanisms in motile cells. Journal of Cell Biology. 2006;173(3):383–394. doi: 10.1083/jcb.200511093. [DOI] [PMC free article] [PubMed] [Google Scholar]
- 44.Ballestrem C., Hinz B., Imhof B. A., Wehrle-Haller B. Marching at the front and dragging behind: differential αVβ3-integrin turnover regulates focal adhesion behavior. Journal of Cell Biology. 2001;155(7):1319–1332. doi: 10.1083/jcb.200107107. [DOI] [PMC free article] [PubMed] [Google Scholar]
- 45.Murphy D. B., Gray R. O., Grasser W. A., Pollard T. D. Direct demonstration of actin filament annealing in vitro. Journal of Cell Biology. 1988;106(6):1947–1954. doi: 10.1083/jcb.106.6.1947. [DOI] [PMC free article] [PubMed] [Google Scholar]
- 46.Kevin Parker K. I. T., Lepre Brock A. M. Y., Brangwynne C., et al. Directional control of lamellipodia extension by constraining cell shape and orienting cell tractional forces. FASEB Journal. 2002;16(10):1195–1204. doi: 10.1096/fj.02-0038com. [DOI] [PubMed] [Google Scholar]
- 47.Katsumi A., Milanini J., Kiosses W. B., et al. Effects of cell tension on the small GTPase Rac. The Journal of Cell Biology. 2002;158(1):153–164. doi: 10.1083/jcb.200201105. [DOI] [PMC free article] [PubMed] [Google Scholar]
- 48.Naumanen P., Lappalainen P., Hotulainen P. Mechanisms of actin stress fibre assembly. Journal of Microscopy. 2008;231(3):446–454. doi: 10.1111/j.1365-2818.2008.02057.x. [DOI] [PubMed] [Google Scholar]
- 49.Vallenius T. Actin stress fibre subtypes in mesenchymal-migrating cells. Open Biology. 2013;3(6) doi: 10.1098/rsob.130001.130001 [DOI] [PMC free article] [PubMed] [Google Scholar]


