Abstract
We report a new type of carbon nanotube ring (CNTR) coated with gold nanoparticles (CNTR@AuNPs) using CNTR as a template and surface attached redox-active polymer as a reducing agent. This nanostructure of CNTR bundle embedded in the gap of closely attached AuNPs can play multiple roles as a Raman probe to detect cancer cells and a photoacoustic (PA) contrast agent for imaging-guided cancer therapy. The CNTR@AuNP exhibits substantially higher Raman and optical signals than CNTR coated with a complete Au shell (CNTR@ AuNS) and straight CNT@AuNP. The extinction intensity of CNTR@AuNP is about 120-fold higher than that of CNTR at 808 nm, and the surface enhanced Raman scattering (SERS) signal of CNTR@AuNP is about 110 times stronger than that of CNTR, presumably due to the combined effects of enhanced coupling between the embedded CNTR and the plasmon mode of the closely attached AuNPs, and the strong electromagnetic field in the cavity of the AuNP shell originated from the intercoupling of AuNPs. The greatly enhanced PA signal and photothermal conversion property of CNTR@AuNP were successfully employed for imaging and imaging-guided cancer therapy in two tumor xenograft models. Experimental observations were further supported by numerical simulations and perturbation theory analysis.
Graphical abstract
INTRODUCTION
Raman spectroscopy with high sensitivity and spatial resolution has been widely used for sensing and imaging applications.1–3 The spectrometric sensor based on the surface enhanced Raman scattering (SERS) signal of carbon nanotube (CNT) and graphene was also developed to detect biomolecules, such as DNA, RNA, protein, and so on.4–7 To further increase their SERS signal, hybrid nanomaterials of sandwiched gold-CNT/reduced graphene oxide (rGO)–gold were recently exploited to investigate their electrostatic interactions.8 Gold nanoparticles coated with rGO exhibit higher light absorption efficiency than noncoated nanoparticles.9 The reason is that the light absorption of rGO/CNT at the plasmon resonance of gold nanoparticle is increased, with the gold nanoparticle serving as a local nanoantenna.10,11 When the CNT is precisely placed into the gap of gold nanodimers, the Raman signal of the CNT can be enhanced because the plasmonic coupling induces a strong electromagnetic field in the cavity.12–14
Localized surface plasmon resonance (LSPR) is a unique optical property of Au or Ag metal nanostructures, resulting from the collective oscillation of conduction electrons caused by the irradiation of electromagnetic fields.15,16 Recent research has focused on controlling the shape and assembled structures of Au nanoparticles in order to tune the peak positions of plasmonic bands to fulfill specific purposes.17,18 The signal of the Raman dye will be greatly enhanced when it is placed in the hot spot.19,20 For example, plasmonic nanoparticles with nanogap size of 1–10 nm were demonstrated and the Raman enhancement factor reached 1010 when the Raman probe was embedded in the gap, owing to the strong coupling between the shell and core.21,22 In contrast to the analogous solid nanoparticles, hollow nanoparticles are expected to exhibit even more enhanced interaction with light and surrounding media due to a larger exposed surface than that of solid nanoparticles.23,24
Recently, large sized rGO with small gold nanoparticle coated on the surface was reported to have an enhanced photothermal effect.11 The plasmonic metal nanoparticles can serve as local nanoantenna to increase the light absorption efficiency of rGO and also act as a photothermal source based on nonradiative decay. Due to the benefit from the interaction between rGO and plasmonic metal nanomaterials illuminated with a laser, the photocurrent of the rGO will be increased, leading to enhanced photothermal performance.11 Carbon nanotubes are another commonly used carbon-based nanomaterial for photothermal therapy, as they can convert absorbed light from the UV to near-infrared (NIR) region into heat via nonradiative decay. In this study, a novel platform based on a gold nanoparticle-coated CNT ring (CNTR@AuNP) is designed and proposed to enhance light-matter interactions in the AuNP-plasmonic hybrid structures. We report on the tunable optical absorbance and strong associated electromagnetic field confinement effect of CNTR@AuNP. We demonstrate that the SPR wavelength can be facilely tuned from the visible to NIR region by varying the density and size of the coated AuNPs, which determines the plasmonic coupling of the interparticle and inner/outer AuNP ring surface, and the extent of enhancing the electromagnetic field inside the AuNP nanoring.25,26 CNTR@AuNP showed much stronger Raman and PA signal and photothermal effect as compared to CNT, CNTR, and CNTR coated with a complete Au nanoshell (CNTR@AuNS) and straight CNT@AuNP, which was also further supported by numerical simulations and perturbation theory analysis. In comparison with single gold nanocrystals and carbon nanomaterials, this new CNTR templated preparation of a gold nanoring, with ultrahigh Raman enhancement and photothermal conversion efficiency as well as the inert protective layer of gold, warrants widespread biomedical applications for diagnosing, imaging, and treating diseases.
RESULTS AND DISCUSSION
Preparation and Characterization of CNTR and CNTR@AuAPs
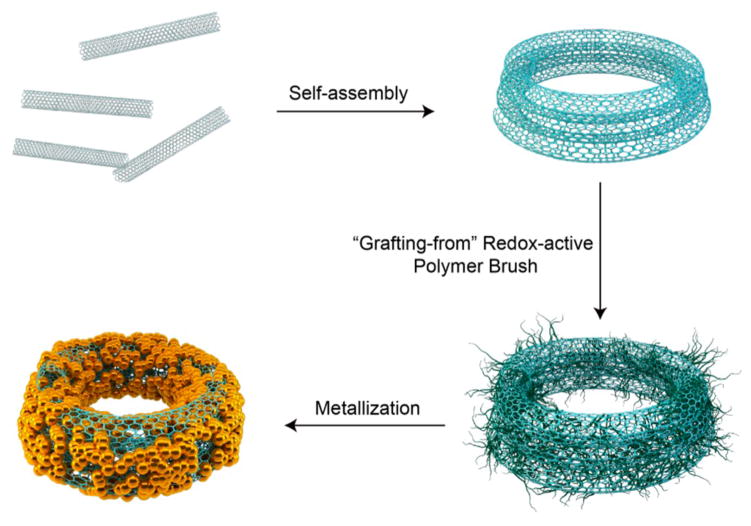
CNTs are known for their excellent chemical and mechanical stabilities, due to the strong network of C–C covalent bonds.27 It has been reported that direct synthesis or sonication can coil CNT bundles into ring structures.28,29 However, the production efficiency of the ring structure is low and the size cannot be precisely controlled. Here we introduce a modified oil-in-water double emulsion method to prepare a CNTR with high yield (Figure 1 and Figure S1).30 Briefly, the hydrophobic single-walled CNT (0.5–2 μm) (Figure S1) was first dispersed in dimethylformamide (DMF) containing 1% toluene by volume, followed by the addition of water, forming the toluene droplet containing CNTs. With the diffusion of DMF into water, the volume of the DMF/toluene droplet was continuously decreased, inducing the coiling of CNTs. After DMF was completely diffused into water, the CNTR was formed and readily dispersed in aqueous solution. Differing from the coils of biopolymers stabilized by hydrogen bonding or ionic interactions, the structure of the CNTR is confined through van der Waals forces. Thus, the CNTR is very stable in solvents amenable for CNT, such as DMF and N-methylpyrrolidone (NMP), even under strong sonication conditions. More interestingly, the hydrophobic CNT becomes hydrophilic after being changed to a CNTR. The CNT used in the current study was prepared by the chemical vapor deposition (CVD) method, which contains hydroxyl groups and defects on the surface. It is likely that, in the CNTR, the hydroxyl groups are better exposed to the aqueous environment. Furthermore, the CNTR would have a smaller size than the straight CNT, which is also helpful for the dispersion of the CNTR in water. The CNTR can thus be dispersed well in aqueous solution and be further surface functionalized using water-soluble molecules, such as proteins, DNAs, and polymers. We found that the ring size of the CNTR can be adjusted by the volume ratio of toluene and DMF and the length of the CNT used. For example, when the volume ratios of toluene to DMF were 1/100, 2.5/100, and 4/100, the diameters of the obtained CNTRs were ~90, 180, and 290 nm, respectively. If the toluene to DMF volume ratio was 1/100 and the lengths of the CNT were increased to 0.5–5 μm and 5–9 μm, the obtained CNTRs were ~230 nm and ~720 nm, respectively (Figures S3 and S4). So, the size of the CNT ring can be easily tuned by changing the toluene-to-DMF ratio or using different lengths of CNT.
Figure 1.
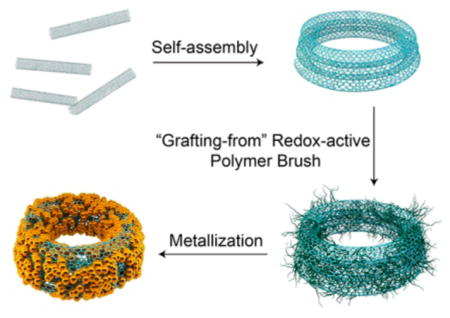
Schematic illustration of the self-assembly of carbon nanotubes (CNT) into a CNT ring (CNTR) and further growth of redox-active poly(4-vinylphenol) (PvPH) brushes by a surface-initiated atom-transfer radical-polymerization (SI-ATRP) method to reduce Au3+ to Au0 and to coat gold nanoparticles onto the CNTR.
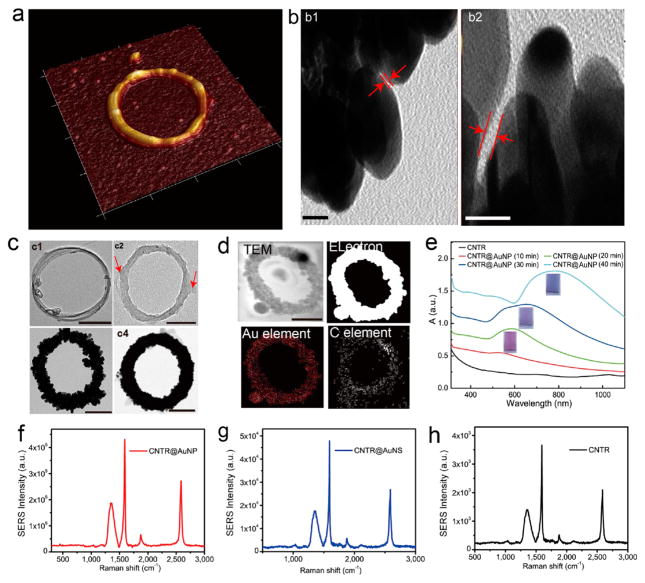
It was reported that plasmonic metal nanocrystals can act as local nanoantenna to enhance the optical energy absorption of graphene at a selected plasmon frequency.8,31 More importantly, the interaction between plasmonic nanoparticles and carbon-based materials has been found to enhance the photocurrent of plasmonic nanostructures applied to the surface of graphene.9,32–34 In order to study the interaction between gold and CNTR, we introduced either gold shell or gold nanoparticles onto the CNTR surface (Figure 2a–c). To form a uniform AuNP nanoshell on the CNTR surface, a redox-active polymer, poly(4-vinylphenol) (PvPH), attached on the CNTR surface (CNTR@PvPH) was employed to serve as a reducing agent.21 For the synthesis of CNTR@PvPH, the CNTR was first coated with an atom transfer radical polymerization (ATRP) initiator containing a pyrene group by “π–π” stacking,35 followed by polymerization of 4-vinylphenol using the ATRP method, as displayed in Figure 1 and Figure S1. This “graft from” method provides the possibility to precisely control the molecular weight of the polymer brushes and to increase the graft density as compared to the “graft to” method (Figure S5). The weight fraction of the polymer brushes of PvPH can reach over 80%, as measured by thermogravimetric analysis (TGA) (Figure S6), which suggests high polymerization efficiency of the surface ATRP method, favoring the next step of AuNP growth. Compared with the TEM image of CNTR [Figure 2c(c1)], a thick layer of polymer can be seen in the TEM image of CNTR@PvPH [Figure 2c(c2)]. Thus, this method can also be used to modify other functional polymers on the CNT surface with adjustable polymer brush weight and density.
Figure 2.
(a) Representative AFM images of CNTR@AuNP. (b) High resolution TEM images of CNTR@AuNP with a gold nanogap among closely attached gold nanoparticles (scale bar: 5 nm). (c) CNTR (c1), CNTR@PvPH (c2) (Arrow: PvPH layer coated on the CNTR surface), CNTR@AuNP (c3), and CNTR@AuNS (c4) obtained at different time points of reducing Au3+. (d) TEM image and elemental mapping of CNTR@AuNP. (e) UV–vis–NIR absorption spectra of CNTR and CNTR@AuNP coated with different densities of AuNP nanoshell. Scale bar, 40 nm. SERS spectra of CNTR@AuNP (f), CNTR@AuNS (g), and CNTR (h) illuminated with a 808 nm laser, respectively.
The strong reducing activity of the phenol group of PvPH in an alkaline environment, in combination with the high graft density of the PvPH on the CNTR surface, suggests that it can be used as an excellent reducing agent and template to form AuNP by reducing Au3+ in pH = 11 NaOH solution (Figure S7 and S8).21 By controlling the reaction time, CNTRs coated with a series of different sized AuNPs were obtained (Figure S8). To grow AuNPs on the surface of CNTR@PvPH, 5 mL of KAuCl4 solution (0.1 mg/mL) was added into 4 mL of CNTR@PvPH (0.01 mg/mL). The diameters of the coated AuNPs were 2 ± 0.8 nm, 4 ± 1.6 nm, 5 ± 3 nm, and 6 ± 3 nm after reducing the Au3+ ions for 10, 20, 30, and 40 min, respectively. After reaction for 40 min, the AuNPs were closely packed on the CNTR surface with the interparticle distance of 0.85 ± 0.45 nm, as shown in Figure 2b, c and Figure S9. Figure S8 showed that AuNPs were first grown onto the surface of the CNTR as small Au seeds and finally formed closely attached AuNPs over time. The diameter of the coated AuNP also increased with increasing amount of Au3+. When the added volume of the KAuCl4 solution (0.1 mg/mL) was increased to 10 and 15 mL, the according thicknesses of the AuNS were ~8 and ~12 nm, respectively. This procedure is highly reproducible with controllable morphology and absorption spectra (Figure S10). The core–shell structure and composition of CNTR@AuNP were further verified by elemental mapping (Figure 2d). Both HR-SEM and AFM images of the CNTR@AuNP further confirmed that gold nanoparticles were coated on the surface of the CNTR (Figure S11 and S12). The average diameter of the obtained CNTR@AuNP was about ~125 nm (Figure S13), and the gold nanoparticle shell thickness was 5 ± 3 nm. When the amount of initially added KAuCl4 solution (0.1 mg/mL) was increased to 20 mL, a CNTR coated with a complete gold nanoshell (CNTR@ AuNS) was obtained, as shown in Figure 2c(c4) and Figure S11 and S12.
As most of the interparticle distances were larger than 0.5 nm, the quantum tunneling effect played a negligible role in the plasmonic coupling among nanoparticles of CNTR@AuNP. The SPR peak was red-shifted with increased AuNP size, because of the enhanced plasmonic coupling among the particles.20,36,37 Similarly, the color of the solution was also changed from red to blue (Figure 2e), which was consistent with the red-shift of the SPR peak. The extinction intensity of CNTR@AuNP at 808 nm was increased by about 120-fold over CNTR (Figure S14). The SPR was red-shifted when the diameter of CNTR@AuNP was increased (Figure S14). All the CNTR@AuNP samples exhibited more red-shift than CNT@ AuNP with the same AuNP nanoshell thickness (Figure S15 and S16). These results were attributed to the plasmon resonance of the AuNP nanoshell and electromagnetic enhancement caused by the plasmonic coupling between the shells and the inside region of the ring structure. The CNTR@ AuNP with the size of ~125 nm exhibited bright yellow color in dark-field imaging (Figure S17). The single particle level dark-field light scattering spectra of different ring sized CNTR@AuNPs were consistent with those of the bulky samples (Figure S18). The dark-field scattering spectra of the CNTR@AuNP before and after incubation in water for 5 days showed no obvious change or shift, indicating the optical stability of the CNTR@AuNP.
Surface Enhanced Raman Scattering Property of the CNTR@AuNP
Carbon nanomaterial can be used as the substrate for Raman enhancement.38 As shown in Figure 2f–h, the typical Raman spectra of CNT are presented, where the peaks at 1354, 1594, 1874, and 2580 cm−1 are attributed to the D band, G band, radial breathing mode (RBM) + G band, and G′ band, respectively. The Raman enhancement of the hybrid CNTR@AuNP was measured by illumination with a 808 nm laser. Our experimental results in Figure 2f–h showed that the SERS signal of CNTR@AuNP was increased by 110 times compared with CNTR due to the strong electromagnetic field in the cavity of the AuNP shell originating from the surface AuNP intercoupling. It was assumed that the CNT was placed in the strong electromagnetic field of the AuNP nanoshell, which can increase the resonance frequency of the CNT. To further confirm the prodigious Raman enhancement effect of CNTR@AuNP, wavelength dependent Raman signal measurement was also conducted with lasers at 514 and 632.8 nm. The Raman tests using 514 and 632.8 nm lasers showed much weaker signals, as these wavelengths are not close to the extinction peak of the AuNP nanoshell. This confirms that it is the plasmonic resonance of the AuNP nanoshell that strongly enhances the Raman signal of the CNTR (Figure 2f–h). The calculated Raman enhancement factor of the ~125 nm CNTR@AuNP was 1.6 × 10⁶, and was dropped to 1.3 × 10⁵ and 1.8 × 10³ for the 240 and 340 nm samples, respectively. Note that the CNTR coated with a complete gold nanoshell (CNTR@AuNS) exhibited a relatively weak Raman enhancement compared with CNTR@AuNP (Figure 2g), presumably due to the disappearance of the plasmonic coupling effect between the AuNP particles and, thus, no significantly enhanced electromagnetic field in the region of CNTR. Another interesting finding was that CNTR@AuNP showed a much stronger Raman signal than the straight CNT@AuNP based on the same concentrations of CNT and AuNP (Figure S19), most likely due to the extra coupling in the inner space of the ring nanostructure of CNTR@AuNP. This coupling is not available for CNTR@AuNS. It is also of note that the Raman enhancement of CNTR@AuNP decreases with increasing ring size, as the inner space coupling effect is decreased.
Enhanced Optical Properties of the CNTR@AuNP
Due to localized surface plasmon and strong plasmonic coupling of the conjugated AuNP and whole gold shell, there is an enhanced oscillation of conduction electrons that arises in the AuNP nanoshell when excited by a NIR laser.39,40 With this electron oscillation, light is trapped around the surface of the AuNP nanoshell and the hollow cavity of the AuNP nanoshell, inducing a greatly enhanced local electrical field near CNTR that can dramatically increase the overall total light absorption of CNTR.11 We next compared the optical properties of CNTR@AuNP, CNTR, and CNTR@AuNS, including the photothermal effect and photoacoustic (PA) performance.
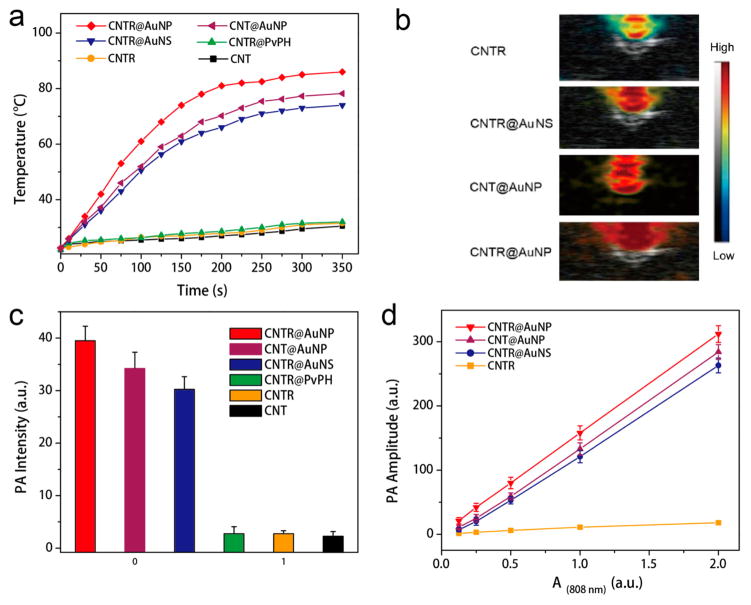
The light absorption conversion properties of CNTR@ AuNP, CNT@AuNS, and CNTR were examined in the solution state upon irradiation with a 808 nm laser (Figure 3). Figure 3a showed that the temperature of CNTR@AuNP and CNT@AuNP solutions underwent a rapid increase from 25 °C to more than 70 °C in 5 min under a 808 nm laser at a power density of 0.5 W/cm2. In contrast, a very minor temperature increase of CNTR, CNT, and PBS solution was detected, indicating the high photothermal effect of the hybrid nanomaterials of CNTR@AuNP and CNT@AuNP. It was noticed that the temperature increase of CNTR@AuNP solution was much higher than that of CNT@AuNP under the same conditions. The result demonstrated highly efficient photothermal conversion of CNTR@AuNP, which should be attributed to the strong interparticle plasmonic coupling of the AuNP nanoshell, resulting in increased light absorption efficiency of the embedded CNTR. The CNTR@AuNP also exhibited a laser power density dependent photothermal (PTT) effect at the same concentration (Figure S20). The photo-thermal conversion efficiency of the CNTR@AuNP was estimated to be 76% (Figure S21), which was higher than those of most previously reported gold nanomaterials, such as gold nanorod (22%), gold nanoshell (13%), gold hexapod (29.6%), and gold nanocage (63%).
Figure 3.
(a) Temperature variation of CNTR@AuNP, CNT@AuNP, CNT@AuNS, CNTR@PvPH, CNTR, and CNT as a function of laser irradiation time at 0.5 W/cm2. (b) Overlaid ultrasound and PA images of the CNTR@AuNP, CNT@AuNP, CNTR@AuNS, and CNTR illuminated with a 808 nm laser. (c) PA intensity of CNTR@AuNP, CNT@AuNP, CNTR@AuNS, CNTR@PvPH, CNTR, and CNT at the same optical intensity illuminated with a 808 nm laser. (d) PA amplitude of CNTR, CNTR@AuNP, CNT@AuNP, and CNTR@AuNS with increasing optical density at 808 nm.
The high light absorption efficiency and photothermal effect of CNTR@AuNP can be further explored as properties of a photoacoustic (PA) contrast agent. As shown in Figure 3b, CNTR with a AuNP nanoshell had about 2 orders of magnitude higher PA intensity than those without gold nanoshell at the same OD value (Figure 3c). The PA signal of CNTR@AuNP is linearly correlated with its optical density at 808 nm (OD808) (Figure 3d). Also of note is the better performance of the CNTR@AuNP than CNTR@AuNS at the same value of OD808, again due to the gold shell plasmonic coupling in the case of CNTR@AuNP.
Theoretical Calculation of Electromagnetic Interactions of the CNTR and AuNP Shell
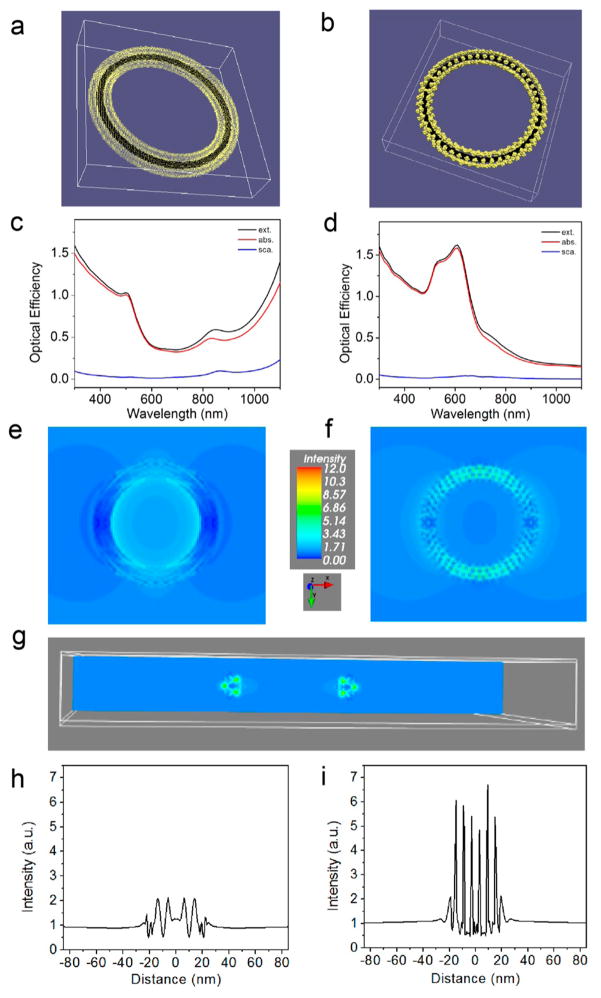
To explain these experimental observations, the optical properties were calculated according to the discrete dipole approximation (DDA) using the DDSCAT 7.3 program. In this formalism, the structure was regarded as an array of dipole moments residing within its volume. Each structure was represented as a dielectric continuum with the complex dielectric response function of bulk Au and graphite. Two models were built to study the optical response of the ring structure: one made of continuous Au surrounding a carbon nanotube (CNT) ring, namely CNTR@AuNS (Figure 4a), and the other composed of Au nanoparticles (AuNPs) surrounding a carbon CNT ring, namely CNTR@AuNP (Figure 4b). In both cases, the dimensions of the CNT rings are the same, with an inner diameter of 85 nm and an outer diameter of 125 nm. For CNTR@AuNS, the thickness of Au coated on a CNT ring is 5 nm. For CNTR@AuNP, a layer of AuNPs with a diameter of 5 nm was assembled on a CNT ring. The AuNP assembly consisted of 6 rings containing different numbers of AuNPs, that is, 52 (outmost), 50, 44, 42 (innermost), 44, and 50 AuNPs, respectively. The spacing between the centers of two adjacent AuNPs in each ring is ~6 nm, which provides a gap of ~ 1 nm between the adjacent AuNPs in a ring.
Figure 4.
(a) CNTR@AuNS with a 5 nm thick Au layer has an inner radius of 37.5 nm and outer radius of 52.5 nm. (b) CNTR@AuNP with 6 rings of 5 nm AuNPs surrounding the CNTR and interparticle distance of 1 nm. (c–d) Optical spectra calculated by the DDA simulation: (c) CNTR@ AuNS, and (d) CNTR@AuNP. Near-field distribution in an x–y cross-section of the ring calculated by the DDA simulation: (e) CNTR@AuNS; and (f) CNTR@AuNP. (g) A cross-section in the y–z plane showing a strong electric field between CNTR@AuNP nanoparticles. (h–i) Line scan of near-field strength along the white dashed line: (h) CNTR@AuNS, and (i) CNTR@AuNP.
A linear polarized light was propagated along the direction normal to each ring structure (z-direction). The optical cross-sections were averaged over the two orthogonal polarization directions of the incident light. The optical efficiency, Q, is reported as the ratio of the respective optical cross-section to , where the effective radius, aeff,, is defined as the radius of a sphere whose volume is equal to that of the structure. The optical maximum could be located beyond 1200 nm in the infrared region for CNTR@AuNS (Figure 4e), whereas the LSPR peak of CNTR@AuNP is located at ~600 nm (Figure 4f). In both cases, the optical absorption was dominant over scattering. The near-field enhancement of each structure was calculated at the incident light of 808 nm with the polarization along the x direction (Figure 4e and f). It is worth noting the cross-section in the y–z plane showed a strong electric field between the AuNPs in CNTR@AuNP (Figure 4g). However, similar enhancement was not found for CNTR@AuNS. The corresponding line scans along the upper part of each structure as indicated by white dashed lines were plotted in Figure 4h and i, respectively. The electromagnetic field enhancement for CNTR@AuNP was much stronger than that for CNTR@ AuNS. In the simulated optical spectra of CNTR, however, the extinction curve overlaps with the absorption curve since the scattering is very close to zero (Figure S22). The simulation results were consistent with the experimental data. The strong electromagnetic field induced by the CNTR@AuNP accounts for the stronger Raman signal than that for CNTR@AuNS.
In Vitro Imaging, Spectroscopic Detection, and Therapy by CNTR@AuNP
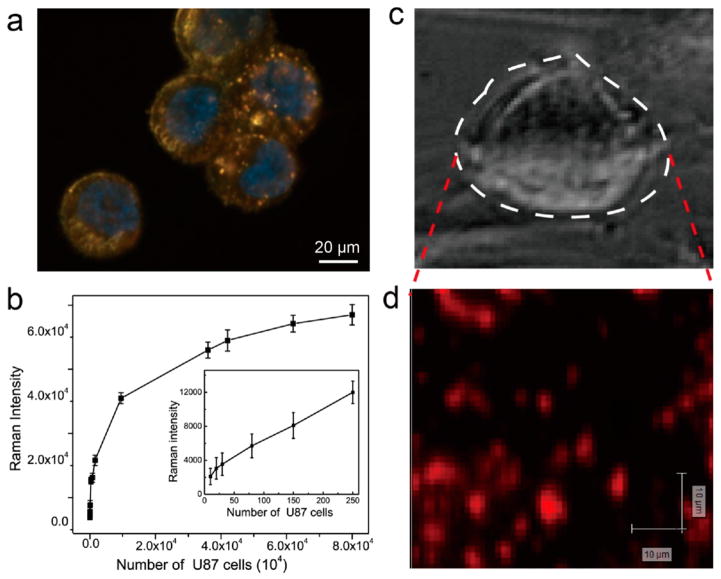
Plasmonic coupling between AuNPs and the interaction of the AuNPs and CNTR lead to spectral red-shifts of the scattering light and great scattering cross-sections, which can be used for single cell scattering imaging.9,34,41 Herein, the U87MG cancer cell line was used to investigate the bioapplication of CNTR@AuNP. In order to increase the biosafety and stability of the CNTR@AuNP, the surface of CNTR@AuNP was conjugated with PEG5000 through the Au–S covalent bond. The PEGylated CNTR@ AuNP showed high stability in various media (Figure S23). Dark-field imaging42 of U87MG cells clearly showed strong yellow scattering color of CNTR@AuNP, indicating efficient uptake of PEGylated CNTR@AuNP (Figure 5a).
Figure 5.
(a) Dark-field images of U87MG cells treated with PEGylated CNTR@AuNP. The cell nuclei were counterstained with Hoechst 3342, exhibiting blue fluorescence. (b) Raman intensity at 1588 cm−1 as a function of cell density (cells/mL). (c) Bright-field image and (d) Raman mapping of a single U87MG cancer cell incubated with PEGylated CNTR@AuNP.
An ideal SERS probe for biosensing applications should generate a reproducible and uniform response, induce a high signal enhancement, have a stable half-life, and be easily synthesized.1,43,44 Our experimental results showed high cell uptake of CNTR@AuNP (Figure S24) with stable and strong Raman signals, suitable for spectroscopic detection of cancer cells. The detection limit of U87MG cells labeled with CNTR@AuNP can reach as low as 20 cells/mL (Figure 5b and Figure S25). Strong punctate Raman signals were detected in U87MG cells after 4 h of incubation with PEGylated CNTR@AuNP (Figure 5c, d). The strong Raman signal and low detection limit of cancer cells for CNTR@AuNP enable future application for ultrasensitive measurement of circulating tumor cells in blood.45,46 Furthermore, the photothermal therapy (PTT) efficacy of PEGylated CNTR@AuNP was also demonstrated with U87MG cancer cells (see Supporting Information, Figure S26).
In Vivo Imaging and Cancer Therapy by PEGylated CNTR@AuNP
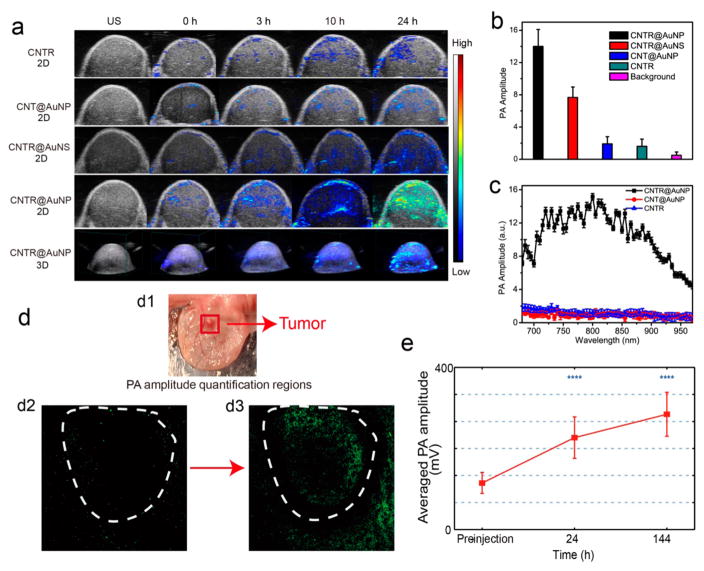
Carbon-based nanomaterials, such as carbon nanotube (CNT) and rGO with light absorption wavelength from UV to NIR region and photothermal conversion through nonradiative decay, have been widely used in PA imaging and thermal therapy.47 The enhanced PA signal of CNTR@AuNP in the NIR region motivated us to investigate its further application for tumor imaging to trace the in vivo delivery and tumor accumulation of PEGylated CNTR@AuNP. As shown in Figure 6a, 2D and 3D PA and ultrasound images of the whole tumor region were acquired before and at 3, 10, and 24 h post-intravenous injection of the CNTR, CNTR@AuNS, and CNTR@AuNP. Mice injected with CNTR@AuNP showed much stronger PA signal in the tumor compared with the control mice treated with CNTR and CNT@AuNS (Figure 6b), suggesting the strong PA signal of CNTR@AuNP and high accumulation of CNTR@AuNP in the tumor region. The weak tumor PA signal in the tumor region of CNT@AuNP treated mice was mainly due to the low accumulation efficiency of the long CNT@AuNP. Clearly, PA spectra of the tumor (Figure 6c) were in good agreement with the extinction spectra of CNTR@AuNP in solution, confirming that the optical performance of CNTR@AuNP is stable after intravenous injection.
Figure 6.
(a) Overlaid 2D and 3D ultrasound and photoacoustic (PA) images of the U87MG tumor mice treated with CNTR, CNT@AuNP, CNTR@AuNS, and CNTR@AuNP, respectively, at different time points after intravenous injection. Average PA amplitude (b) and PA spectra (c) of the tumor tissues treated with CNTR, CNT@AuNP, CNTR@AuNS, and CNTR@AuNP, respectively, at different time points after intravenous injection. (d) Photoacoustic microscopy (PAM) image of a tumor grown on the mouse ear. (d1) Photograph of the UVA-C2 renal cell carcinoma (RCC) xenograft tumor model on the mouse ear. PAM image of the tumor before (d2) and 140 h after the administration of CNTR@AuNP and being illuminated with a 808 nm laser (d3). (e) PA intensity of the tumor region before and at 24 and 140 h post-injection of CNTR@AuNP.
To further evaluate the performance of PEGlaylated CNTR@AuNP for high resolution in vivo photoacoustic microscopy (PAM) imaging of the tumor region, another UVA-C2 renal cell carcinoma (RCC) xenograft tumor model was established using tissue from a 52-year-old male with pT4N0M1 clear cell RCC (Figure 6d1). RCC tumor cells (1 million per 20 μL PBS) were injected into the ear of 6 week old Nu/Nu athymic nude female mice. Mice were monitored for tumor development, which occurred approximately 20 days following injection. Two laser wavelengths, 532 and 808 nm, were used respectively to acquire the anatomic structure image and the distribution of the injected samples. As shown in Figure 6d and Figure S27a, b, the tumor region was imaged at three time points. Abnormal vasculatures were clearly resolved through the anatomic imaging. Before PEGlaylated CNTR@ AuNP was injected, PA signals induced by using the 532 and 808 nm lasers were acquired at random locations. The signals could come from dust and weak responses from blood (Figure 6d2). An obvious accumulation of PEGlaylated CNTR@AuNP around the tumor was observed at 24 h after the injection (Figure 6d, e, and Figure S27). It also can be seen in Figure 6e that, for the in vivo test, the samples can provide PA signals with quite high signal-to-noise ratio and have a much stronger response than blood, so that it can be easily detected and distinguished from other endogenous markers. Finally, the samples were well accumulated throughout the tumor region at 140 h after the injection. The average PA intensity showed significant increases over time (Figure 6e). The results further demonstrate that the CNTR@AuNP could provide a highly detectable and quantitative indicator for in vivo PA microscopy imaging.
To accurately investigate the biodistribution and tumor accumulation efficiency of PEGylated CNTR@AuNP, in vivo PET imaging was performed. Radioactive metal 64Cu was deposited onto the surface of PEGylated CNTR@AuNP using Na-ascorbate as a reducing agent at 37 °C (see Supporting Information for details, and Figure S28).48 Stability experiment showed that the 64Cu labeled CNTR@AuNP ([64Cu]-CNTR@AuNP) is very stable in PBS and medium, suitable for in vivo experiment. Whole-body PET imaging was carried out after intravenous injection of 150 μCi of [64Cu]-CNTR@AuNP into each U87MG tumor mouse (n = 3) when the tumor size reached ~60 mm3. The region-of-interest (ROI) analysis showed tumor accumulation of ~2.6%ID/g at 4 h post-injection, which increased to ~7%ID/g at 24 h (Figure S28a). Ex vivo tissue sampling confirmed the in vivo imaging results (Figure S28b). The tumor accumulation of the CNTR@AuNP is mainly attributed to the enhanced permeability and retention (EPR) effect. The clearance of CNTR@AuNP in the blood followed a simple exponential decay curve, with a half-life of ~19 h (Figure S29). The whole body distribution of CNTR@ AuNP was shown in Figure S30.
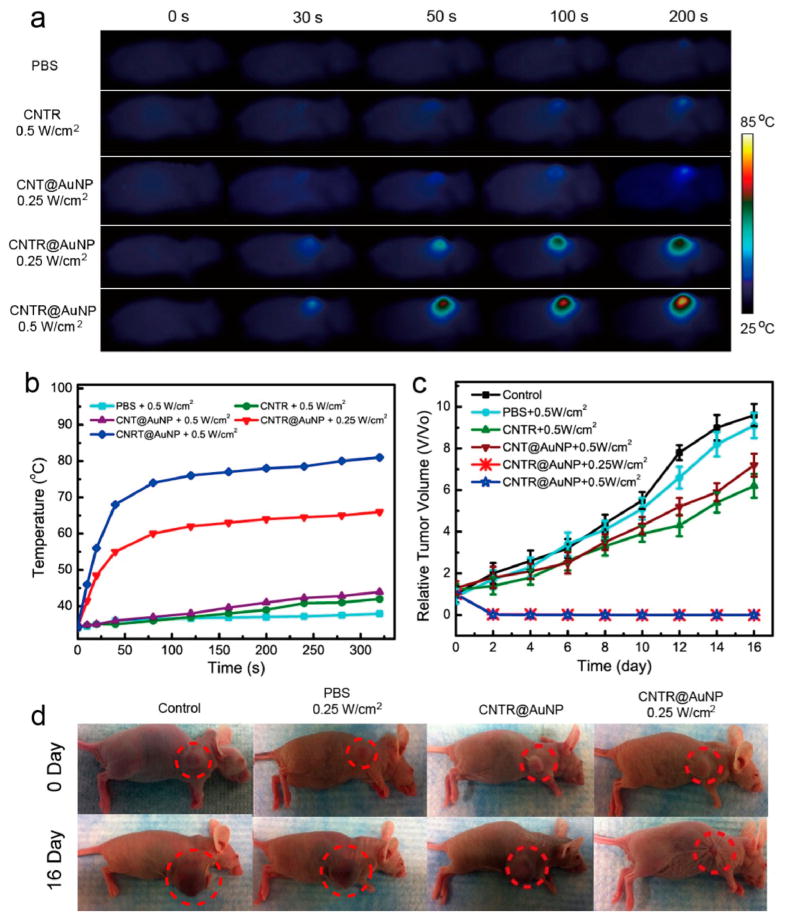
To explore the in vivo therapeutic potential of CNTR@ AuNP, an aqueous solution of CNTR@AuNP was administered by a single intravenous injection to mice bearing U87MG tumor (~60 mm3). CNT@AuNP, CNTR, and PBS served as controls. The photothermal treatment was performed at 24 h post-injection, at which maximum tumor accumulation of CNTR@AuNP was reached, as indicated by PA and PET imaging results. The tumor region was then irradiated by an 808 nm laser of 0.25 or 0.5 W/cm2 power density for 5 min. An infrared camera was employed to monitor the temperature increase of the tumor tissue after laser illumination. Figure 7a showed the temperature mapping of the mice injected with CNTR and CNTR@AuNP irradiated with lasers of different power densities. Compared with the PBS and CNTR groups treated with laser at 0.5 W/cm2, which showed an increase of ~3 and 5 °C of the tumor region, the temperature of the tumor region in the CNTR@AuNP group showed an increase of ~40 °C and finally reached about 70 °C (Figure 7b), which is sufficient to effectively kill cancer cells. Statistical analysis was performed on five groups by comparing the average tumor sizes before and at day 16 post-treatment (Figure 7c). The results demonstrated that the tumor growth in the CNTR@AuNP group was completely abrogated, in contrast to the continued growth of the tumors in CNT@AuNP and CNTR groups. At 50 days after treatment, all CNTR@AuNP injected mice showed nearly no scar and no evidence of tumor regrowth, whereas the other three control groups harbored thriving tumors (Figure S31 and S32). These results manifest the high tumor accumulation and effective photothermal therapy of the CNTR@AuNP. While the mice in the PBS and CNTR@AuNP without laser groups had almost no inflammatory cell infiltration, the group injected with CNTR@AuNP followed by laser irradiation showed prominent cell death, inflammatory cell infiltration, and tissue structure damage (Figure S33). Taken together, the results that no significant body weight loss and no obvious inflammation or damage of major organs of mice (including heart, liver, spleen, lung, and kidneys) were observed after CNTR@AuNP-PTT treatment suggest no side effects and low cytotoxicity and biocompatibility of the CNTR@AuNP (see Supporting Information, Figures S34 and S35).
Figure 7.
Infrared imaging (a) and heating curve (b) within the tumor region of the 808 nm laser irradiated U87MG tumor mice. (c) Tumor inhibition rate after various treatments. (d) Photographs of the four groups of mice before and at day 16 after laser irradiation.
CONCLUSION
We have developed a new type of SERS sensor consisting of CNTR with closely packed AuNPs on the CNTR surface through a templated growth of redox-active polymers PvPH and the use of the polymer for localized reduction of Au3+ in an alkaline environment. The thickness and diameter of the coated AuNPs can be tuned by the reaction time and added amount of Au3+. The size of the CNTR@AuNP can be facilely adjusted by using different lengths of CNT to form CNTR with diameter ranging from 80 to 400 nm. Due to the strong plasmonic coupling between the AuNPs and the inside region of the gold nanoring, the CNTR@AuNP exhibits much greater Raman and PA signals, and better PTT effect than CNTR@AuNS and straight CNT@AuNP. Experimental observations were further supported by numerical simulations and perturbation theory analysis. Modifying the nanoscopic domains of surface attached redox-active polymer brushes through localized reduction provides an enabling method for designing diverse functional metal nanostructures on the surface of CNTR with customized plasmonic and electronic properties.
EXPERIMENTAL SECTION
Preparation of CNTR@AuNP and CNTR@AuNS
To prepare CNTR, single-walled hydrophobic CNT was first dispersed in DMF solution at a concentration of 0.04 mg/mL using tip sonicator. Next, 10 μL of toluene was added into 1 mL CNT solution under sonication. Then, 5 mL water was injected into the mixture to trigger the emulsification process, inducing the coiling of CNT. After 20 min, the CNTR with the size of ~90 nm were formed and obtained by centrifugation at 12,000g for 10 min and dispersed in DMF. When the added volume of toluene was increased to 25 and 40 μL, the diameters of the obtained CNTR was increased to ~180 and 290 nm, respectively (Figure S2). When the volume ratio of toluene to DMF was 1 to 100, the CNTR ring with the average diameters of ~230 nm and ~720 nm were obtained by using 0.5–5 μm and 5–9 μm long CNT, respectively (Figure S3).
For the growth of PvPH onto the surface of CNTR, ATRP initiator of BiBEP (5 mg) was first added into the solution of CNTR in DMF and sonicated for 1 h using tip sonicator (see Supporting Information for the synthesis of BiBEP, Scheme S1). CNTR@BiBEP was isolated by centrifugation at 16,000 g for 20 min and washed three times to remove the free BiBEP. For the synthesis of CNTR@PvPH, 2 mg CNTR@BiBEP in a mixture of 10 mL anisol and 10 mL DMF, 0.1 g 4-acetoxystyrene (AS), and 20 PL PMDETA were mixed in a flask and flushed with nitrogen for 30 min. Then 14 mg CuBr was added and again flushed with nitrogen for another 10 min. The mixture was stirred for 9 h at 70 °C. The CNTR attached with poly(4-acetoxystyrene) (CNTR@PAS) was isolated by centrifugation. Removal of the acetyl protecting groups from the poly(4-acetoxystyrene) (PAS) was carried out by treating PAS with hydrazine hydrate in 1,4-dioxane at room temperature. Typically, 5 mg CNTR@ PAS was dissolved in 10 mL 1,4-dioxane, then hydrazine hydrate (0.1 mL) was added via a syringe. The reaction was maintained at room temperature under a nitrogen atmosphere for 3 h. The CNTR@PvPH was obtained by centrifugation and dispersed in pH = 11 NaOH solution. For the synthesis of CNT@PvPH, CNT was first modified with BiBEP by adding BiBEP (5 mg) into the solution of CNT in DMF and sonicated for 1 h using tip sonicator. PvPH was grown on the surface of CNT using the same method as CNTR@PvPH.
To grow gold nanoparticles onto CNTR, 5 mL of KAuCl4 solution (0.1 mg/mL) was slowly added into the solution of 4 mL CNTR@ PvPH (0.01 mg/mL) and 1 mL 1% polyvinylpyrolidone (PVP). The reaction mixture was gently stirred for 1 h at room temperature. During the reaction process, 0.2 mL solution was taken out every 10 min for TEM characterization to trace the gold nanoparticle growth process. After centrifugation, CNTR@AuNP was dispersed in 5 mL water, followed by adding 5 mg PEG-SH (Mn = 5 kDa) to stabilize the particles for subsequent biomedical applications. When the added volume of KAuCl4 solution (0.1 mg/mL) was increased to 10 and 15 mL, the thicknesses of the gold nanoparticle shell would increase to ~8 and ~12 nm, respectively. CNT@AuNP was synthesized by adding 5 mL of KAuCl4 solution (0.1 mg/mL) into the solution of 4 mL CNT@PvPH (0.01 mg/mL) and 1 mL 1% PVP. For preparation of CNTR@AuNS, the volume of of KAuCl4 solution (0.1 mg/mL) was increased to 20 mL. Similarly, CNT@AuNP and CNTR@AuNS were modified with PEG-SH to stabilize the particles with high water solubility. Phospholipid-polyethylene glycol (MW = 5000) was employed to modify CNTR to allow water dispersity.
Characterization of Optical Properties of CNTR@AuNP and CNTR@AuNS
The aqueous solutions of PBS, CNT, CNTR, CNT@ AuNS, and CNTR@AuNP were each irradiated by 808 nm laser for 6 min at 0.5 W/cm2. Infrared camera (SC300) was employed to monitor the temperature increase of the solution. To measure the laser power density-dependent photothermal property of CNTR@AuNP, 0.125, 0.25, 0.5, and 1 W/cm2 were separately used to irradiate the solution of CNTR@AuNP at the same concentration.
Photoacoustic imaging of CNTR, CNTR@AuNS and CNTR@ AuNP were performed using a VisualSonic Vevo LAZR system equipped with a 40 MHz, 256-element linear array transducer and illuminated with 808 nm laser.
Dark-field Imaging and SERS Detection of Cancer Cells Using CNTR@AuNP
U87MG cells were cultured in medium supplemented with 10% fetal bovine serum and 1% streptomycin for 2 to 3 days (37 °C, 5% CO2). The live cells were transferred onto glass coverslips (treated with polylysine) in a 60 mm dish and allowed to grow for 2 days. Next, the medium was replaced with fresh culture medium containing PEG conjugated CNTR@AuNP. After incubation for 4 h, the glass slides were washed with PBS and the cells were maintained in fresh medium before microscopic observation.
For SERS detection of cancer cells, preseeded U87MG cells were exposed to PEGylated CNTR@AuNP for 2 h. Afterward, the U87MG cells were washed with PBS three times and collected by centrifugation after trypsinization. The CNTR@AuNP treated U87MG cells were counted and redispersed in 200 μL of PBS at different concentrations for Raman detection.
SERS mapping experiment was performed using a RENISHAW Raman microscope system with a laser beam directed to the sample through a 20× objective lens. The glass slides covered with U87MG cancer cells were treated with CNTR@AuNP and Raman mapping was done under the excitation of 808 nm laser. The laser focal spot was 1 μm and mapping measurements at 1588 cm−1 were carried out as raster scans in 1 μm steps with 1 s as the integration time per step.
In Vivo Photoacoustic and PET imaging of CNTR@AuNP
In vivo imaging using the CNTR@AuNP was carried out using the U87MG tumor xenograft model. All animal experiments were approved by the animal care and use committee of the National Institutes of Health Clinical Center. The U87MG tumor-bearing nude mice were prepared by inoculating cells (1 × 10⁶ cells in 100 μL PBS) into the right shoulder of each mouse (female, 7 weeks old) under anesthesia and the tumor was allowed to grow for about 15 days, when the volume was approximately 60 mm3. The CNTR@AuNP solution in PBS (200 μL, 500 μg/mL) was then injected intravenously into the tumor-bearing nude mice and the tumor region of the mice was scanned with VisualSonic Vevo LAZR system equipped with a 40 MHz, 256-element linear array transducer at different time points (n = 4/group). As control experiments, CNT@AuNP, CNTR@AuNS and CNTR at the same amount as CNTR@AuNP were also injected into the tumor-bearing mice for PA imaging.
For in vivo PET imaging, 150 μCi of [64Cu]-labeled-CNTR@AuNP was injected intravenously into each mouse tumor when the tumor size reached ~60 mm3. PET scans and image analysis were conducted using an Inveon microPET scanner (Siemens Medical Solutions) at 0, 1, 10, 24, and 48 h post injection (n = 4).
In Vivo Imaging-Guided Phototherml Cancer Therapy
When the U87MG tumor volume was approximately 60 mm3, an aliquot (200 μL) of CNTR, CNTR@AuNP, and CNTR@AuNS, based on the same concentration of CNT or PBS were intravenously injected into the mice under anesthesia (n = 5/group). At 24 h after the injection, the entire region of the tumor was irradiated with 808 nm laser guided by PA imaging at 0.25 or 0.5 W/cm2 for 5 min. During irradiation, real-time thermal images of the tumor region were acquired using a SC300 infrared camera (FLIR). The average temperature of the tumor region was analyzed using FLIR analyzer professional software. After 808 nm laser irradiation, the dimensions of the tumor were measured by a caliper at predetermined time points. The volume V (mm3) of the tumor was calculated by using the formula: V = LW2/2, where W and L represent the width and length of tumor in millimeters, respectively.
Supplementary Material
Acknowledgments
This work was supported by the Intramural Research Program of the National Institute of Biomedical Imaging and Bioengineering (NIBIB), National Institutes of Health (NIH), and the Arkansas Breast Cancer Research Program and the Arkansas Bioscience Institute.
Footnotes
The authors declare no competing financial interest.
- 1H NMR, GPC, TEM, TGA, and optical measurements and properties analysis of the gold nanoparticle coated carbon nanotube ring. (PDF)
References
- 1.Banholzer MJ, Millstone JE, Qin L, Mirkin CA. Chem Soc Rev. 2008;37:885. doi: 10.1039/b710915f. [DOI] [PMC free article] [PubMed] [Google Scholar]
- 2.Xu W, Ling X, Xiao J, Dresselhaus MS, Kong J, Xu H, Liu Z, Zhang J. Proc Natl Acad Sci U S A. 2012;109:9281. doi: 10.1073/pnas.1205478109. [DOI] [PMC free article] [PubMed] [Google Scholar]
- 3.Ling X, Huang S, Deng S, Mao N, Kong J, Dresselhaus MS, Zhang J. Acc Chem Res. 2015;48:1862. doi: 10.1021/ar500466u. [DOI] [PubMed] [Google Scholar]
- 4.Liu Z, Cai W, He L, Nakayama N, Chen K, Sun X, Chen X, Dai H. Nat Nanotechnol. 2007;2:47. doi: 10.1038/nnano.2006.170. [DOI] [PubMed] [Google Scholar]
- 5.Dhar S, Liu Z, Thomale J, Dai H, Lippard SJ. J Am Chem Soc. 2008;130:11467. doi: 10.1021/ja803036e. [DOI] [PMC free article] [PubMed] [Google Scholar]
- 6.Kumar R, Pillai RG, Pekas N, Wu Y, McCreery RL. J Am Chem Soc. 2012;134:14869. doi: 10.1021/ja304458s. [DOI] [PubMed] [Google Scholar]
- 7.Antaris AL, Robinson JT, Yaghi OK, Hong G, Diao S, Luong R, Dai H. ACS Nano. 2013;7:3644. doi: 10.1021/nn4006472. [DOI] [PubMed] [Google Scholar]
- 8.Liu Y, Cheng R, Liao L, Zhou H, Bai J, Liu G, Liu L, Huang Y, Duan X. Nat Commun. 2011;2:579. doi: 10.1038/ncomms1589. [DOI] [PMC free article] [PubMed] [Google Scholar]
- 9.Gilbertson AM, Francescato Y, Roschuk T, Shautsova V, Chen Y, Sidiropoulos TPH, Hong M, Giannini V, Maier SA, Cohen LF, Oulton RF. Nano Lett. 2015;15:3458. doi: 10.1021/acs.nanolett.5b00789. [DOI] [PubMed] [Google Scholar]
- 10.Zhu X, Shi L, Schmidt MS, Boisen A, Hansen O, Zi J, Xiao S, Mortensen NA. Nano Lett. 2013;13:4690. doi: 10.1021/nl402120t. [DOI] [PubMed] [Google Scholar]
- 11.Lim DK, Barhoumi A, Wylie RG, Reznor G, Langer RS, Kohane DS. Nano Lett. 2013;13:4075. doi: 10.1021/nl4014315. [DOI] [PubMed] [Google Scholar]
- 12.Fang Z, Thongrattanasiri S, Schlather A, Liu Z, Ma L, Wang Y, Ajayan PM, Nordlander P, Halas NJ, García de Abajo FJ. ACS Nano. 2013;7:2388. doi: 10.1021/nn3055835. [DOI] [PubMed] [Google Scholar]
- 13.Ye J, Wen F, Sobhani H, Lassiter JB, Dorpe PV, Nordlander P, Halas NJ. Nano Lett. 2012;12:1660. doi: 10.1021/nl3000453. [DOI] [PubMed] [Google Scholar]
- 14.Heeg S, Oikonomou A, Fernandez-Garcia R, Lehmann C, Maier SA, Vijayaraghavan A, Reich S. Nano Lett. 2014;14:1762. doi: 10.1021/nl404229w. [DOI] [PMC free article] [PubMed] [Google Scholar]
- 15.Wang C, Astruc D. Chem Soc Rev. 2014;43:7188. doi: 10.1039/c4cs00145a. [DOI] [PubMed] [Google Scholar]
- 16.Li W, Chen X. Nanomedicine. 2015;10:299. doi: 10.2217/nnm.14.169. [DOI] [PMC free article] [PubMed] [Google Scholar]
- 17.Song J, Huang P, Duan H, Chen X. Acc Chem Res. 2015;48:2506. doi: 10.1021/acs.accounts.5b00059. [DOI] [PMC free article] [PubMed] [Google Scholar]
- 18.Murphy CJ, Gole AM, Stone JW, Sisco PN, Alkilany AM, Goldsmith EC, Baxter SC. Acc Chem Res. 2008;41:1721. doi: 10.1021/ar800035u. [DOI] [PubMed] [Google Scholar]
- 19.Halas NJ, Lal S, Chang WS, Link S, Nordlander P. Chem Rev. 2011;111:3913. doi: 10.1021/cr200061k. [DOI] [PubMed] [Google Scholar]
- 20.Klinkova A, Choueiri RM, Kumacheva E. Chem Soc Rev. 2014;43:3976. doi: 10.1039/c3cs60341e. [DOI] [PubMed] [Google Scholar]
- 21.Song J, Duan B, Wang C, Zhou J, Pu L, Fang Z, Wang P, Lim TT, Duan H. J Am Chem Soc. 2014;136:6838. doi: 10.1021/ja502024d. [DOI] [PubMed] [Google Scholar]
- 22.Lim DK, Jeon KS, Hwang JH, Kim H, Kwon S, Suh YD, Nam JM. Nat Nanotechnol. 2011;6:452. doi: 10.1038/nnano.2011.79. [DOI] [PubMed] [Google Scholar]
- 23.Lal S, Clare SE, Halas NJ. Acc Chem Res. 2008;41:1842. doi: 10.1021/ar800150g. [DOI] [PubMed] [Google Scholar]
- 24.Ayala-Orozco C, Liu JG, Knight MW, Wang Y, Day JK, Nordlander P, Halas NJ. Nano Lett. 2014;14:2926. doi: 10.1021/nl501027j. [DOI] [PMC free article] [PubMed] [Google Scholar]
- 25.Stewart AF, Lee A, Ahmed A, Ip S, Kumacheva E, Walker GC. ACS Nano. 2014;8:5462. doi: 10.1021/nn4044589. [DOI] [PubMed] [Google Scholar]
- 26.Lin D, Qin T, Wang Y, Sun X, Chen L. ACS Appl Mater Interfaces. 2014;6:1320. doi: 10.1021/am405396k. [DOI] [PubMed] [Google Scholar]
- 27.Takenobu T, Takano T, Shiraishi M, Murakami Y, Ata M, Kataura H, Achiba Y, Iwasa Y. Nat Mater. 2003;2:683. doi: 10.1038/nmat976. [DOI] [PubMed] [Google Scholar]
- 28.Martel R, Shea HR, Avouris P. Nature. 1999;398:299. [Google Scholar]
- 29.Zou S, Maspoch D, Wang Mirkin CA, Schatz GC. Nano Lett. 2007;7:276. doi: 10.1021/nl062258e. [DOI] [PubMed] [Google Scholar]
- 30.Chen L, Yu S, Wang H, Xu J, Liu C, Chong WH, Chen H. J Am Chem Soc. 2013;135:835. doi: 10.1021/ja310405d. [DOI] [PubMed] [Google Scholar]
- 31.Echtermeyer TJ, Britnell L, Jasnos PK, Lombardo A, Gorbachev RV, Grigorenko AN, Geim AK, Ferrari AC, Novoselov KS. Nat Commun. 2011;2:458. doi: 10.1038/ncomms1464. [DOI] [PubMed] [Google Scholar]
- 32.Wang L, Sun Q, Wang X, Wen T, Yin JJ, Wang P, Bai R, Zhang XQ, Zhang LH, Lu AH, Chen C. J Am Chem Soc. 2015;137:1947. doi: 10.1021/ja511560b. [DOI] [PubMed] [Google Scholar]
- 33.Sreejith S, Ma X, Zhao Y. J Am Chem Soc. 2012;134:17346. doi: 10.1021/ja305352d. [DOI] [PubMed] [Google Scholar]
- 34.Cai X, Sushkov AB, Jadidi MM, Nyakiti LO, Myers-Ward RL, Gaskill DK, Murphy TE, Fuhrer MS, Drew HD. Nano Lett. 2015;15:4295. doi: 10.1021/acs.nanolett.5b00137. [DOI] [PubMed] [Google Scholar]
- 35.Song Z, Xu T, Gordin ML, Jiang YB, Bae IT, Xiao Q, Zhan H, Liu J, Wang D. Nano Lett. 2012;12:2205. doi: 10.1021/nl2039666. [DOI] [PubMed] [Google Scholar]
- 36.Song J, Pu L, Zhou J, Duan B, Duan H. ACS Nano. 2013;7:9947. doi: 10.1021/nn403846v. [DOI] [PubMed] [Google Scholar]
- 37.Sun C, Yang H, Yuan Y, Tian X, Wang L, Guo Y, Xu L, Lei J, Gao N, Anderson GJ, Liang XJ, Chen C, Zhao Y, Nie G. J Am Chem Soc. 2011;133:8617. doi: 10.1021/ja200746p. [DOI] [PubMed] [Google Scholar]
- 38.Liu Z, Tabakman S, Welsher K, Dai H. Nano Res. 2009;2:85. doi: 10.1007/s12274-009-9009-8. [DOI] [PMC free article] [PubMed] [Google Scholar]
- 39.Halas NJ, Lal S, Chang WS, Link S, Nordlander P. Chem Rev. 2011;111:3913. doi: 10.1021/cr200061k. [DOI] [PubMed] [Google Scholar]
- 40.Kneipp J, Kneipp H, Kneipp K. Chem Soc Rev. 2008;37:1052. doi: 10.1039/b708459p. [DOI] [PubMed] [Google Scholar]
- 41.Jiang K, Eitan A, Schadler LS, Ajayan PM, Siegel RW, Grobert N, Mayne M, Reyes-Reyes M, Terrones H, Terrones M. Nano Lett. 2003;3:275. [Google Scholar]
- 42.Song J, Zhou J, Duan H. J Am Chem Soc. 2012;134:13458. doi: 10.1021/ja305154a. [DOI] [PubMed] [Google Scholar]
- 43.Abramczyk H, Brozek-Pluska B. Chem Rev. 2013;113:5766. doi: 10.1021/cr300147r. [DOI] [PubMed] [Google Scholar]
- 44.Qian X, Peng XH, Ansari DO, Yin-Goen Q, Chen GZ, Shin DM, Yang L, Young AN, Wang MD, Nie S. Nat Biotechnol. 2008;26:83. doi: 10.1038/nbt1377. [DOI] [PubMed] [Google Scholar]
- 45.Wang X, Qian XM, Beitler JJ, Chen ZG, Khuri FR, Lewis MM, Shin HJC, Nie SM, Shin DM. Cancer Res. 2011;71:1526. doi: 10.1158/0008-5472.CAN-10-3069. [DOI] [PMC free article] [PubMed] [Google Scholar]
- 46.Mohs AM, Mancini MC, Singhal S, Provenzale JM, Leyland-Jones B, Wang MD, Nie S. Anal Chem. 2010;82:9058. doi: 10.1021/ac102058k. [DOI] [PMC free article] [PubMed] [Google Scholar]
- 47.Murakami T, Nakatsuji H, Inada M, Matoba Y, Umeyama T, Tsujimoto M, Isoda S, Hashida M, Imahori H. J Am Chem Soc. 2012;134:17862. doi: 10.1021/ja3079972. [DOI] [PubMed] [Google Scholar]
- 48.Song J, Yang X, Jacobson O, Huang P, Sun X, Lin L, Yan X, Niu G, Ma Q, Chen X. Adv Mater. 2015;27:4910. doi: 10.1002/adma.201502486. [DOI] [PubMed] [Google Scholar]
Associated Data
This section collects any data citations, data availability statements, or supplementary materials included in this article.


