Abstract
Shielding nanoparticles from nonspecific interactions with normal cells/tissues before they reach and after they leave tumors is crucial for the selective delivery of NPs into tumor cells. By utilizing the reversible protonation of weak electrolytic groups to pH changes, long-chain amine/carboxyl-terminated polyethylene glycol (PEG) decorated gold nanostars (GNSs) are designed, exhibiting reversible, significant, and sensitive response in cell affinity and therapeutic efficacy to the extracellular pH (pHe) gradient between normal tissues and tumors. This smart nanosystem shows good dispersity and unimpaired photothermal efficacy in complex bioenvironment at pH 6.4 and 7.4 even when their surface charge is neutral. One PEGylated mixed-charge GNSs with certain surface composition, GNS-N/C 4, exhibits high cell affinity and therapeutic efficacy at pH 6.4, and low affinity and almost “zero” damage to cells at pH 7.4. Remarkably, this significant and sensitive response in cell affinity and therapeutic efficacy is reversible as local pH alternated. In vivo, GNS-N/C 4 shows higher accumulation in tumors and improved photothermal therapeutic efficacy than pH-insensitive GNSs. This newly developed smart nanosystem, whose cell affinity reversibly transforms in response to pHe gradient with unimpaired biostability, provides a novel effective means of tumor-selective therapy.
1. Introduction
On-demand delivery of nanoparticles (NPs) into tumor cells remains an important challenge in the field of nanomedicine.[1–3] Though receptor-ligand pairing is the most popularly used strategy,[4–9] its effectiveness is greatly influenced by the heterogeneous nature of tumor and the dynamic expression of receptors during treatment.[10–12] Hence, ongoing efforts are keenly focused on exploiting the characteristic acidic extracellular pH (pHe) of solid tumors (typically one unit of pH lower than that of normal tissues[13] to trigger enhanced cellular internalization.[14–17] The key challenge of this strategy is the complete shielding of NPs from nonspecific interaction during circulation (both before NPs reach and after NPs leave tumors into circulation).[1–3,18] Toward this challenge, numerous efforts have been made to develop pHe-responsive strategies. Typical examples include polymeric micelles containing ionizable groups, which present demicellization at acidic environment due to strong charge repulsion between ionized groups and release their cargoes; Alternative strategy is shielding the cell-affinitive or positively charged moieties of NPs with acid-labile bonds, which would be hydrolyzed at tumoral pHe and re-emerge the shielded moieties to promote the cellular uptake of NPs in tumors.[4–9,19–23] Although these designs offered excellent shielding of NPs before they reach tumors, few of them can re-shield NPs after they leaked out from tumors because of the irreversible nature of demicellization and bonds-hydrolysis. This limitation raises great concerns about the potential toxicity of therapeutic NPs to major organs in their following excretion process once they were activated in the slightly acidic tumors.[10–12,24] Therefore, a reversibly pHe controlled targeting strategy that only enhances endocytosis of NPs at acidic tumoral environment and inhibits their cellular interaction both before and after pHe activation is vital in view of maximizing the tumor selectivity and minimizing the side effects of therapeutic NPs.
Functionalizing NPs with mixed-charge surfaces is one of the most effective ways to shield NPs from nonspecific interaction during circulation.[13,25–28] However, the pH-reversible controllability over the cell affinity of mixed-charge nanoparticles (MCNPs) remains scarcely investigated. It has been reported that the net charge of MCNPs plays an important role in their interactions with cells in vitro,[14–17,29] but the applications of MCNPs in pHe-selective delivery are still hindered for two reasons. First, for MCNPs decorated with zwitterionic or oppositely charged strong electrolytic ligands,[26,30] the net charge of MCNPs has little response to pH changes. Second, for MCNPs decorated with oppositely charged weak electrolytic ligands, the stability of MCNPs is rather poor when their net charge is neutralized at isoelectric point.[29,31] The poor stability would result in rapid aggregation of MCNPs, which is obviously undesirable for the applications of NPs with well-designed shapes or structures in vivo.
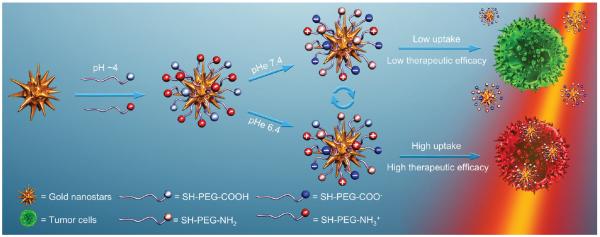
Addressing these issues, we reported herein a new strategy to target tumor by reversibly controlling the cell affinity of PEGylated MCNPs as a function of pHe. We delicately decorated gold nanostars (GNSs) with long-chain amine-terminated (positively charged) and carboxyl-terminated (negatively charged) polyethylene glycol (PEG) (Scheme 1). The dense assembled PEG chains provided an additional strongly hydrophilic layer, which protected GNSs from aggregation even when their net charge was neutralized. Meanwhile, the weak electrolytic terminated groups granted reversible response in the net charge of GNSs to the change of pH. We found that by optimizing the surface composition of PEGylated mixed-charge GNSs, a reversible, significant, and sensitive response in cell affinity to the pHe gradient between tumor and normal tissues could be achieved. Since our previous work showed GNSs could generate heat upon irradiation of near infrared laser,[32,33] we could easily translate this response into therapeutic effect and perform reversibly pHe controlled photothermal therapy (PTT) for the first time.
Scheme 1.
Schematic illustration of the preparation of PEGylated mixed-charge GNSs and their pH-reversible cell affinity and photothermal therapeutic efficacy.
2. Results and Discussion
2.1. Synthesis and Characterization of PEGylated Mixed-Charge GNSs
GNSs used in this study were prepared following a cetyltrimethylammonium bromide (CTAB) free method to avoid potential cytotoxicity.[34] Transmission electron microscopy (TEM) images well illustrated the multi-branch shape of GNSs with size around 70 nm (Figure 1A and Figure S1, Supporting Information). The localized surface plasmon resonance (LSPR) of bare GNSs was at 762 nm (Figure S2A, Supporting Information). Dynamic light scattering (DLS) measurement showed the hydrodynamic diameter of bare GNSs was 77.5 ± 3.2 nm. To obtain PEGylated mixed-charge GNSs, these bare GNSs were conjugated to thiol PEG (M.W. ≈ 1000) terminated with positively charged amine group (NH2-PEG-SH) and negatively charged carboxyl group (COOH-PEG-SH) at various NH2/COOH ratios (3:1, 4:1, 5:1, 6:1, and 7:1). The products were purified and termed as GNS-N/C 3, GNS-N/C 4, GNS-N/C 5, GNS-N/C 6, and GNS-N/C 7. The exact compositions of the two ligands assembled on the surface of GNSs were determined to be γsurf= cNH2/cCOOH= 0.52, 0.73, 1.05, 2.30, 3.08 indirectly by measuring the concentration of unbound amine and sulfhydryl groups. As controls, GNSs decorated with complete NH2-PEG-SH (GNS-NH2) or COOH-PEG-SH (GNS-COOH) were also synthesized. In all these experiments, the total concentration of PEG was kept constant. After PEGylation, the localized surface plasmon resonance of PEGylated GNSs slightly red shifted from 762 to 780 nm without significant broadening of peaks (Figure 1B and Figure S2A, Supporting Information). The relationship between the concentration of PEGylated GNSs and absorbance of LSPR was depicted in Figure S2B, Supporting Information. DLS measurements showed the increase of hydrodynamic diameter of GNSs from 77.5 ± 3.2 to 94.3 ± 4.3 nm after PEGylation. No significant difference was observed between the sizes of GNSs decorated with various composition of PEG (Table S1, Supporting Information). Zeta potentials of PEGylated GNSs were determined in a series of buffer solutions from pH ≈3 to ≈11. It is noteworthy that the isoelectric point of mixed-charge GNSs could be regulated continuously by adjusting the proportion of NH2-PEG-SH and COOH-PEG-SH (Figure 1C).
Figure 1.
(A) Typical transmission electron microscopic image of GNSs. Scale bar: 50 nm. B) UV–vis spectra of GNS-NH2, GNS-COOH, and GNS-N/C 3–7. C) Zeta potentials of GNS-NH2, GNS-COOH, and GNS-N/C 3–7 in a series of buffer solutions from pH ≈3 to ≈11.
2.2. pH-Independent Biostability and Photothermal Efficacy of PEGylated Mixed-Charge GNSs in Bioenvironment
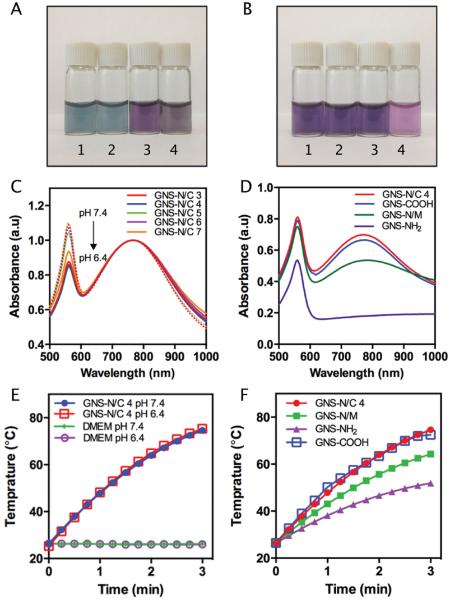
Biostability is critical for the applications of NPs in vivo. To test the biostability of PEGylated mixed-charge GNSs, we chose Dulbecco's Modified Eagle's Medium (DMEM, all DMEM used in this paper were supplemented with 10% fetal bovine serum unless otherwise stated) at pH 7.4 and 6.4 to mimic the environment of circulation and tumor respectively. After being resuspended in DMEM, the color of PEGylated mixed-charge GNSs solutions turned from blue to dark purple at pH 7.4, or to yellowish at pH 6.4. (The difference of color came from the effect of phenol red. When suspended in DMEM without phenol red, the color of PEGylated mixed-charge GNSs solutions remained blue, Figure 2A.) UV–vis measurement did not show any significant change in the shape of LSPR in GNS-N/C 3–7 solutions after three days of incubation in DMEM at pH 7.4 and 6.4 (Figure 2C). Notice that the zeta potentials of GNS-N/C 4–7 were close to zero at pH 7.4 or 6.4, which means the long hydrophilic PEG chains can prevent neutralized GNSs from rapid aggregation. This feature was not observed in gold NPs protected by short weak electrolytic ligands without PEGylation,[29,35] indicating the important role of PEGylation in the preservation of dispersity of MCNPs near isoelectric point.
Figure 2.
A) Digital photos of GNS-N/C 4 suspended in H2O (1), DMEM at pH 7.4 without phenol red (2), DMEM at pH 7.4 (3), and DMEM at pH 6.4 (4). B) Digital photos of GNS-N/C 4 (1), GNS-COOH (2), GNS-N/M (3), and GNS-NH2 (4) suspended in DMEM at pH 7.4. C) Normalized UV–vis spectra of GNS-N/C 3–7 incubated in DMEM at pH 7.4 (dashed lines) or 6.4 (solid lines) after 3 days. The peaks at 560 nm come from phenol red. D) UV–vis spectra of GNS-N/C 4, GNS-COOH, GNS-N/M, and GNS-NH2 incubated in DMEM at pH 7.4 after three days. E) Heating curves of DMEM at pH 7.4 or 6.4 with or without GNS-N/C 4 upon 808 nm laser irradiation (2 W cm−2, 3 min). GNS-N/C 4 was incubated in DMEM for three days. F) Heating curves of GNS-N/C 4, GNS-N/M, GNS-COOH, and GNS-NH2 upon 808 nm laser irradiation (2 W cm−2, 3 min) after incubation in DMEM for three days.
To further understand the effect of the PEG-terminated groups to the dispersity of GNSs, we compared the biostability of GNS-N/C 4 in culture medium with that of GNSs-NH2 and GNS-COOH and GNSs decorated with a mixture of NH2-PEG-SH and mPEG-SH (GNS-N/M). As shown in Figure 2B, when dissolved in DMEM at pH 7.4, the color of GNS-NH2 solution turned to light purple, whereas other solutions appeared dark purple, indicating that aggregation occurred in GNS-NH2 solution. After three days of incubation, the UV–vis spectra showed that both GNS-N/C 4 and GNS-COOH had excellent colloidal biostability in DMEM, while the absorbance peak of GNS-N/M slightly red shifted, and the peak of GNS-NH2 almost disappeared (Figure 2D). In addition, the hydrodynamic diameters of GNS-N/C 4 and GNS-COOH were close to their initial sizes in water, whereas the hydrodynamic diameters of GNS-N/M and GNS-NH2 increased to 125.3 ± 8.9 and 343.2 ± 14.8 nm, respectively (Table S2, Supporting Information). The poor biostability of GNS-NH2 and GNS-N/M was most likely attributed to the strong interaction between the cationic groups of NPs and serum proteins.[36] The superior biostability of GNS-N/C 4 suggested that the assembled mixed-charge monolayer may shield the cross-linking between serum proteins and positively charged groups on NPs, providing a novel way to anchor the cell affinitive cationic moieties on the surface of NPs without sacrificing their dispersity in complex bioenvironment.
To evaluate the photothermal efficacy of PEGylated mixed-charge GNSs in bioenvironment at different pH, the laser-heating curves of GNS-N/C 4 incubated in DMEM (pH 6.4 or 7.4) for three days were recorded. An increase of temperature up to ≈75 °C was clearly observed in DMEM solutions with GNS-N/C 4 upon 808 nm laser irradiation at 2 W cm−2 for 3 min at pH 6.4 and 7.4, while the DMEM solutions without GNSs under the same irradiation exhibited almost no change in temperature (Figure 2E). The photothermal efficacy of GNS-N/C 4 was close to that of GNS-COOH due to their similar dispersity in culture medium. In stark contrast, the photothermal efficacy of GNS-N/M and GNS-NH2 was significantly decreased after incubation in DMEM because of their insufficient biostability (Figure 2F). These results demonstrated that the mixed-charge PEG monolayer may help GNSs maintain their unique photothermal conversion capability in complex bioenvironment regardless changes in pH, which is necessary for their therapeutic applications in vivo.
Other factors related to the photothermal efficacy of PEGylated mixed-charged GNSs were investigated. A concentration-dependent (from 2.5 × 10⁻¹² m to 80 × 10−12 m) and laser power-dependent (form 0.5 to 2 W cm−2) photothermal efficacy of GNS-N/C 4 was determined (Figure S3, Supporting Information). Furthermore, the GNSs showed superior photothermal stability over gold nanorods (GNRs) though five repeated cycles of laser heating (Figure S4, Supporting Information), which was consistent with previous report that GNSs were more resistant to melting under laser irradiation than other gold nanostructures.[37]
2.3. pHe Controllable Cell Affinity and Therapeutic Efficacy of PEGylated Mixed-Charge GNSs
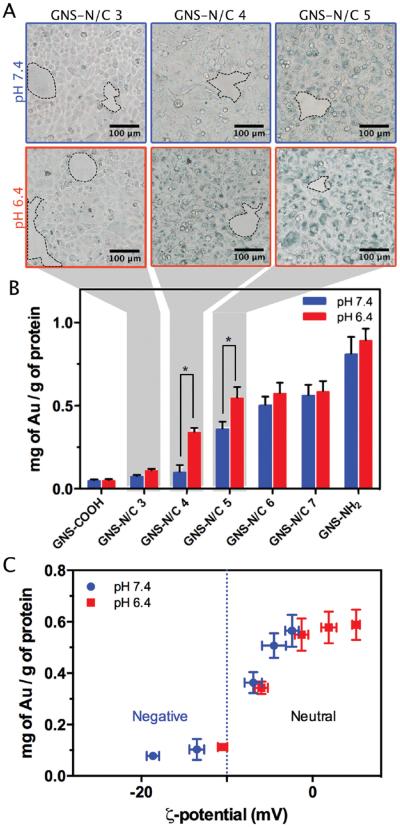
We next investigated the cell affinity of PEGylated GNSs. Figure 3 summarizes the experimental results in which GNS-NH2, GNS-COOH, and GNS-N/C 3–7 were incubated with HeLa cells at pH 6.4 or 7.4 for 4 h. The degree of cellular uptake was determined by optical microscopy and inductively coupled plasma (ICP) measurement. As shown in Figure 3A,B and Figure S5, Supporting Information, the degree of cellular uptake of GNS-N/C 4 and 5 at pH 6.4 is significantly higher than that at pH 7.4. Note that the degree of cellular uptake of GNS-NH2 and GNS-COOH was similar at both pH 6.4 and 7.4, suggesting that the decrease in pH itself may not enhance cellular uptake by affecting cell membrane permeability. The clean background of optical microscopy images demonstrated the great biostability of PEGylated mixed-charge GNSs. In stark contrast, the GNS-NH2 aggregated and attached to the substrate of cultural dish (Figure S6, Supporting Information). This result also suggested that the response in cell affinity of GNS-N/C 4 and 5 was less likely caused by size change due to aggregation.
Figure 3.
A) Optical microscopy images of HeLa cells after incubation with 80 × 10−12 m GNS-N/C 3–5 for 4 h. Scale bar: 100 μm. The clean background circled in dashed lines indicates the excellent biostability of PEGylated mixed-charge GNSs. B) Cellular uptake of PEGylated GNSs determined by ICP after incubation with 80 × 10−12 m GNS-NH2, GNS-COOH, and GNS-N/C 3–7 for 4 h. Statistical difference has been indicated by asterisks. C) Plot of ICP data quantifying the degree of cellular uptake as a function of the zeta potential of PEGylated mixed-charge GNSs.
To further understand the mechanism behind this response, the relationship between the zeta potential and the degree of cellular uptake of PEGylated mixed-charge GNSs was described in Figure 3C. We found that the degree of uptake depends on the zeta potential of PEGylated mixed-charge GNSs. When the zeta potential of PEGylated mixed-charge GNSs is negative (< −10 mV), the degree of uptake is low, probably caused by the strong repulsion between the negatively charged carboxyl groups and the cell membranes. When the zeta potential is neutral (−10 to +10 mV), the degree of cellular uptake remarkably increases. Numerous studies have shown that cells typically do not internalize the neutral PEGylated nanoparticles,[38] which is not the case in our system. We suspected that the positively charged amine groups on the surface of GNSs may serve as “fuse” to trigger cellular internalization when the net charge of PEGylated GNSs is still neutral. This ability of boosting cellular uptake of neutral NPs is significantly important because the highly positively charged NPs are prone to aggregate in vivo and have several unwanted side effects, including hemolysis and platelet aggregation.[39]
To evaluate the relationship between the photothermal effect and the degree of uptake, the temperature change of HeLa cells suspensions (incubated with GNS-NH2, GNS-COOH, or GNS-N/C 3–7) upon 808 nm laser irradiation at 2 W cm−2 was monitored. As shown in Figure S7, Supporting Information, for PEGylated mixed-charge GNSs, there was a good linear relationship between the magnitude of temperature change and the intracellular concentration of gold (R2 = 0.94). Note that the GNS-NH2 showed higher cellular uptake than GNS-N/C 7 but similar temperature increase in cellular suspensions. We suspected that the high degree of aggregation limited its photothermal efficacy in complex bioenvironment.
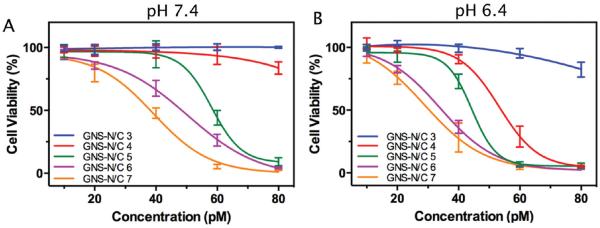
To investigate the therapeutic efficacy of PEGylated mixed-charge GNSs at different pH, HeLa cells were incubated with different concentration of GNS-NH2, GNS-COOH, or GNS-N/C 3–7 for 4 h and irradiated by an 808 nm laser for 3 min. The cell viability was measured by MTT assay. As shown in Figure 4, GNS-N/C 4 (80 × 10−12 m) showed the greatest response to pH change among all PEGylated mixed-charge GNSs, promoting a drop from 83.7% viability to 5.4% when pH of culture medium decreased from 7.4 to 6.4 (p-value <0.001). This result was in line with the observation that GNS-N/C 4 turned from negative to neutral when pH decreased. The change in pH itself had no effect on the growth of HeLa cells with or without laser irradiation (Figure S8, Supporting Information), thus the response in therapeutic efficacy is unlikely induced by the pH decrease. GNS-NH2 and GNS-COOH also showed similar therapeutic efficacy when pH altered (Figure S9, Supporting Information), further suggesting the necessary of assembled mixed-charge monolayers for pH-sensitivity.
Figure 4.
Cell viability of HeLa cells incubated with different concentration of GNS-N/C 3–7 for 4 h at pH 7.4. A) or pH 6.4. B) after laser irradiation (808 nm, 2 W cm−2, 3 min).
We also noticed that, for normal cells (293T cells), the degree of uptake of GNS-N/C 4 was remarkably lower than that of GNS-NH2 when the cells were incubated with GNSs at pH 7.4. After 3 min of laser irradiation, the viability of cells incubated with GNS-NH2 dropped to 13.45%, while the viability of GNS-N/C 4 treated cells maintained above 95%. (Figure S10, Supporting Information). This observation further confirmed that the pHe selectivity of GNS-N/C 4 may greatly reduce the off-target photothermal damage to normal tissues.
2.4. Reversibly pHe Controlled PTT In Vitro
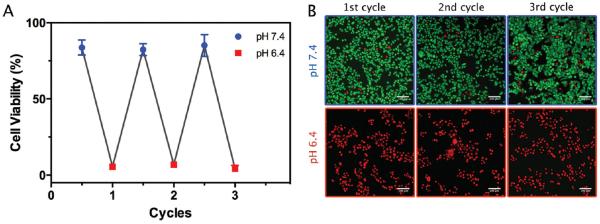
Encouraged by the response of GNS-N/C 4 to the change in pH, this formula was chosen to explore the possibility of reversibly pHe controlled PTT. To the best of our knowledge, this is the first attempt at reversibly pHe controlled PTT. First, GNS-N/C 4 was preincubated in culture medium whose pH alternated from 7.4 to 6.4 for cycles and then added to cells. Considering the reversible protonation of amine/carboxyl groups, the therapeutic efficacy of GNS-N/C 4 should only be determined by the final pH at which the cells were cultured. As shown in Figure 5, the viability of cells after laser irradiation was above 80% when the final pH was 7.4, and dropped to less than 10% when the final pH was 6.4. The preincubation in culture medium of alternate pH had negligible effect on the therapeutic efficacy of GNS-N/C 4. The fluorescent live/dead cell staining also agreed well with the result of MTT assay. This reversible response in therapeutic efficacy may re-shield GNS-N/C 4 after they leak out from tumors, thus reduce their potential off-target damage to major organs in the following circulation.
Figure 5.
A) Cell viability of HeLa cells cultured with 80 × 10−12 m GNS-N/C 4 (preincubated in DMEM whose pH alternated from 6.4 to 7.4 for cycles) for 4 h after laser irradiation (808 nm, 2 W cm−2, 3 min). B) The corresponding fluorescence images of calcein AM (green, live cells)/propidium iodide (red, dead cells) costained HeLa cells for each cycle of pH reversible PTT. Scale bar: 100 μm.
2.5. Biocompatibility of PEGylated Mixed-Charge GNSs
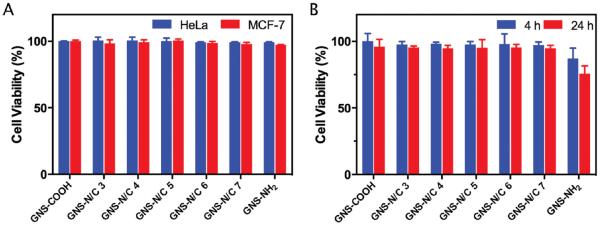
Biocompatibility is another critical factor for the biomedical applications of NPs. To study this, GNS-NH2, GNS-COOH, and GNS-N/C 3–7 were incubated with HeLa cells, MCF-7 cells or 293T cells without exposure to laser. GNS-N/C 3–7 and GNS-COOH showed negligible cytotoxicity to both malignant (HeLa and MCF-7) and normal (293T) cells, while GNS-NH2 showed slight cytotoxicity to 293T cells (Figure 6). It is known that positive charged NPs may destruct cell membrane by inducing membrane depolarization,[40,41] but the positively charged amine groups on the surface of PEGylated mixed-charge GNSs did not induce any significant toxicity to cells. We suspected that the negatively charged carboxyl groups may “mask” the depolarization effect of amine groups, thus improve the biocompatibility of PEGylated mixed-charge GNSs.
Figure 6.
A) Cell viability of HeLa cells and MCF-7 cells incubated with 80 × 10−12 m GNS-NH2, GNS-COOH, or GNS-N/C 3–7 at pH 7.4 for 24 h without laser irradiation. B) Cell viability of 293T cells incubated with 80 × 10−12 m GNS-NH 2, GNS-COOH, or GNS-N/C 3–7 at pH 7.4 for 4 or 24 h without laser irradiation.
2.6. Biodistribution of PEGylated Mixed-Charge GNSs and Reversibly pHe Controlled PTT In Vivo
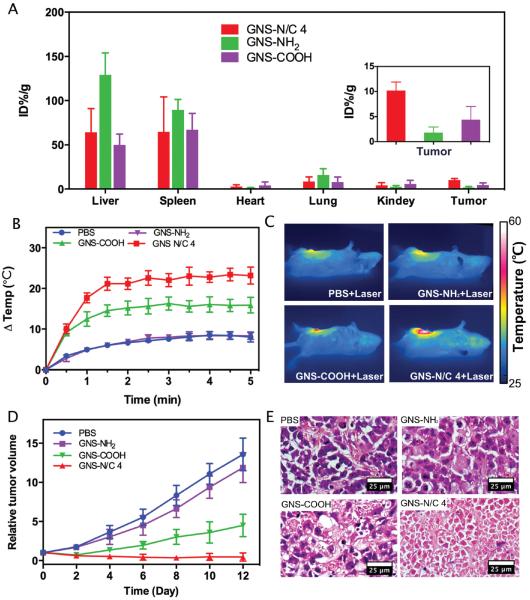
We finally examined the in vivo biodistribution of PEGylated mixed-charge GNSs on tumor-bearing mice. Considering the potential clinical applications of PEGylated mixed-charge GNSs, orthotopic mouse model of breast cancer was established. The mice were intravenously injected with GNS-N/C 4, GNS-NH2, GNS-COOH or PBS. As shown in Figure 7A, in liver and lung, the accumulation of GNS-NH2 was remarkably higher than that of GNS-N/C 4 and GNS-NH2 24 h postinjection. This observation may be explained by the positive charge and larger size of GNS-NH2 aggregations, which make them easier to be engulfed by Kuffer's cells. As for tumors, GNS-N/C 4 showed the highest accumulation of 10.19% injected dose per gram (ID%/g) of tumor, which is 1.3 times higher than that of GNS-COOH (4.36% ID/g, p = 0.024) and 4.8 times higher than that of GNS-NH2 (1.77% ID/g, p = 0.0043).
Figure 7.
A) The biodistribution of GNS-N/C 4, GNS-COOH, and GNS-NH2 in orthotopic mouse model of breast cancer (three mice per group). B) The change in temperature of tumors upon 808 nm laser irradiation (1 W cm−2, 5 min) 24 h post intravenous injection of PBS, GNS-NH2, GNS-COOH, or GNS-N/C 4. C) Representative thermal images of mice at the end of laser irradiation. The average starting body temperature was 33.0 °C. D) Change of relative tumor volume after 808 nm laser irradiation at 1 W cm−2 for 5 min. Data are means ± s.d. (6 mice per group). E) H&E staining of tumor histological sections of different groups at six days after laser irradiation. Scale bar: 25 μm.
Since the tumor accumulation of GNSs is critical to their photothermal therapeutic efficacy, we irradiated tumors with 808 nm laser at 1 W cm−2 for 5 min 24 h postinjection. Thermal images were taken to measure the tumor temperature over the course of treatment. Mice treated with GNS-N/C 4 experienced an average 23 °C temperature increase during laser irradiation, reaching an average temperature of 56 °C after 5 min of treatment. Conversely, mice treated with GNS-COOH showed a 15 °C temperature increase, and mice treated with GNS-NH2 or PBS had a temperature rise less than 8 °C (Figure 7B,C). The therapeutic efficacy of PTT was assessed by the growth of tumor depicted in Figure 7D. The mice treated with GNS-N/C 4 showed a significant inhibition of tumor growth when compared to the mice treated with GNS-NH2, GNS-COOH, and PBS, which was in line with the intense photothermal effect of this group. The therapeutic efficacy was also evaluated by haematoxylin and eosin (H&E) staining on tumor tissue sections (Figure 7E). Extensive coagulative necrosis was observed in histological sections from group treated with GNS-N/C 4, indicating the effective destruction of tumor cells after laser irradiation. While groups treated with GNS-NH2, GNS-COOH, and PBS showed large areas of neoplastic cells with nuclear atypia, revealing insufficient damage to the tumors.
3. Conclusion
We have demonstrated that GNSs with pH-independent biostability and pH-reversible cell affinity could be prepared by surface modification with amine/carboxyl-terminated PEG. The dense PEG chains offered strongly hydrophilic layers that protected mixed-charge GNSs from aggregation even when they are neutralized in complex bioenvironment. By optimizing the composition of amine/carboxyl-terminated PEG, GNS-N/C 4 exhibited high cell affinity and therapeutic efficacy at tumoral pHe, and low cell affinity and nearly “zero” damage at pHe of normal tissues. In mice model, intravenous injection of GNS-N/C 4 showed significantly increased tumor accumulation and complete ablation of orthotopic breast cancer xenograft under laser irradiation. Considering the excellent biocompatibility of GNS-N/C 4 and its reversal, significant, and sensitive response to pHe gradient, this smart nanosystem would be promising for tumor-targeted therapy and imaging.
4. Experimental Section
Materials and Reagents
HAuCl4·3H2O, AgNO3, sodium citrate, ascorbic acid, thiazolyl blue tetrazolium bromide (MTT), and dimethyl sulphoxide (DMSO) were purchased from Sigma-Aldrich. Amine-PEG-thiol (NH2-PEG-SH, M.W. ≈ 1000 Da), carboxymethyl-PEG-thiol (COOH-PEG-SH, M.W. ≈ 1000 Da), and methoxy-PEG-thiol (mPEG-SH, M.W. ≈ 1000 Da) were purchased from Laysan Bio Inc. LIVE/DEAD viability/cytotoxicity kit was purchased from Invitrogen. Protein assay dye reagent was purchased from BIO-RAD. HeLa cells (human cervical cancer cells), MCF-7 cells (human breast cancer cells), 293T cells (human embryonic kidney cells), and 4T1 cells (mouse breast cancer cells) were purchased from American type culture collection. Dulbecco's modified eagle medium (DMEM) was prepared from dry powder (Invitrogen) with 3.7 g L−1 NaHCO3 (pH 7.4) or 0.37 g L−1 NaHCO3 and 2.31 g L−1 NaCl (pH 6.4) and supplemented with 10% fetal bovine serum (FBS). RPMI-1640 medium was purchased from Invitrogen. The deionized water (≥18 m Ω cm) was obtained from a Millipore water purification system. All chemicals were analytical grade and used without further purification.
Surface Modification of GNSs
Bare GNSs were prepared by a modified seed-mediated method. To obtain PEGylated mixed-charge GNSs, a mixed solution of NH2-PEG-SH and COOH-PEG-SH was added to the solution of bare GNSs. The molar ratios of NH2-PEG-SH and COOH-PEG-SH used were 3, 4, 5, 6, and 7. To obtain GNS-NH2, NH2-PEG-SH was added to the solution of bare GNSs. To obtain GNS-N/M, a mixed solution of NH2-PEG-SH and mPEG-SH at molar ratio of 4:1 was added to the solution of bare GNSs. To obtain GNS-COOH, the pH of solution of bare GNSs was firstly adjusted to ≈10 by NaOH (1 m), then COOH-PEG-SH was added. The PEG was used in large excess and their final concentration was kept constant at ≈37.6 × 10⁻⁶ m in all experiments. The solutions were kept under vigorous stir for 1 h.
Characterization of GNSs
To determine the compositions of the two ligands on the surface of PEGylated mixed-charge GNSs, the solutions were centrifuged at 130 000 rpm for 10 min after stirring. The concentration of unbound sulfhydryl groups in the supernatant (cfreeSH) was measured by Ellman's test. The concentration of unbound amine group in the supernatant (cfreeNH2) was measured via a chromogenic reaction with 2,4,6-trinitrobenzene-sulfonate (TNBS) by comparison with standard curve generated by a serious of known concentration of SH-PEG-NH2. Then the surface concentration of sulfhydryl (cSH) and amine groups (cNH2) was calculated by subtracting cfreeSH and cfreeNH2 from initial concentration of sulfhydryl and amine groups. The compositions of the two ligands on the surface of PEGylated mixed-charge GNSs were calculated as γsurf = cNH2/cCOOH = cNH2/(cSH-cNH2).
To characterize the physical properties of PEGylated GNSs, these GNSs were centrifuged, washed (3 × 10 mL H2O), and resuspended in pure water. The morphology of GNSs was recorded by a JEOL JEM-2100 transmission electronic microscope (Japan). Hydrodynamic diameter and Zeta potential were measured with Zeta/PALS particle size and surface potential analyzer (Brookhaven Instruments). For Zeta potential measurement, the PEGylated GNSs were diluted in 0.1X PBS whose pH was titrated by 1 m NaOH or 1 m HCl to 3.1, 5.2, 6.4, 7.4, 8.7, 9.9, and 10.9. The gold concentration in solution was determined by inductively coupled plasma-atomic emission spectroscopy (ICP-AES) using a PerkinElmer Optima-5300DV spectrometer. The corresponding concentration of GNSs was calculated by a sphere model of 70 nm diameter.[32] UV–vis spectra were measured by a Lambda 35 UV–vis spectrophotometer (PerkinElmer Instruments). For phantom studies of photothermal effect of PEGylated GNSs, 1 mL of GNS-N/C 4 solution (concentration from 2.5 × 10⁻¹² m to 80 × 10−12 m) was irradiated by an 808 nm laser (power density from 0.5 W cm−2 to 2 W cm−2) for 3 min. For phantom studies of photothermal stability of gold nanostructures, 1 mL of GNS-N/C 4 solution (80 × 10−12 m, ≈0.7 OD) was irradiated by an 808 laser (2 W cm−2) for five ON-OFF cycles (ON: 1.5 min, OFF: 15.5 min). The excitation source was an 808 nm diode-pumped solid-state laser system (Hi-Tech Optoelectronics Co., Ltd, China). The thermal images were captured by a MAGNITY f15F1 infrared camera (Wuhan VST Light & Technology Co., Ltd, China).
Cellular Uptake Studies
HeLa cells were cultured in DMEM supplemented with 10% FBS in 6-well plate at pH 7.4 or 6.4 followed by addition of PEGylated GNSs suspended in DMEM solutions. The final concentration of PEGylated GNSs (GNS-NH2, GNS-COOH, GNS-N/C 3–7) was 80 × 10−12 m. After incubation at 37 °C and 5% CO2 for 4 h, cells were visualized by bright field microscopy. Cells were then detached from the substrate with trypsin, moved to separate vials, centrifuged and dispensed in 1.2 mL PBS. 0.2 mL of this suspension was collected and used to determine the amount of protein by Bradford method. Then the suspension was digested by freshly prepared aqua regia following by dilution with 2% HNO3. The amount of gold was determined by ICP-AES. The uptake of GNSs was calculated as the ratio of the weight of gold to the weight of protein.
In Vitro PTT Studies
HeLa cells were cultured in DMEM supplemented with 10% FBS in 96-well plate at pH 7.4 or 6.4 followed by addition of PEGylated GNSs suspended in DMEM solutions. The final concentration of PEGylated GNSs (GNS-NH2, GNS-COOH, GNS-N/C 3–7) was 10 × 10−12, 20 × 10−12, 40 × 10−12, 60 × 10−12, and 80 × 10−12 m. After incubation at 37 °C and 5% CO2 for 4 h, cells were washed by cold PBS for three times and irradiated by an 808 nm laser at 2 W cm−2 for 3 min. The cells were then incubated for 2 h with DMEM containing 250 μg mL−1 of MTT. After discarding the culture medium, 200 μL of DMSO was added to dissolve the precipitates, and the resulting solution was measured for absorbance at 570 nm. To exclude the interference from the absorption of GNSs, the final absorbance value was adjusted to calculate cellular viability by subtracting the absorbance of background (cells underwent the same treatment but without incubation with MTT).
Reversibly pHe Controlled PTT In Vitro
HeLa cells were cultured in DMEM supplemented with 10% FBS in 96-well plate at pH 7.4 or 6.4. GNS-N/C 4 was preincubated in DMEM whose pH alternated from 7.4 to 6.4 for cycles. In detail, cycle 1: GNS-N/C 4 suspended in DMEM (pH 7.4) was added to HeLa cells cultured at pH 7.4; cycle 2: GNS-N/C 4 suspended in DMEM (pH 6.4) was added to HeLa cells cultured at pH 6.4; cycle 3: GNS-N/C 4 was pre-incubated in DMEM (pH 6.4) for 1 h, then centrifuged, resuspended in DMEM (pH 7.4), and added to HeLa cells cultured at pH 7.4; cycle 4: GNS-N/C 4 was preincubated in DMEM (pH 7.4) for 1 h, then centrifuged, resuspended in DMEM (pH 6.4) and added to HeLa cells cultured at pH 6.4; cycle 5: GNS-N/C 4 was pre-incubated in DMEM (pH 7.4) for 1 h, then centrifuged and incubated in DMEM (pH 6.4) for 1 h. After that, these GNSs were centrifuged, resuspended in DMEM (pH 7.4), and added to HeLa cells cultured at pH 7.4; cycle 6: GNS-N/C 4 was preincubated in DMEM (pH 6.4) for 1 h, then centrifuged and incubated in DMEM (pH 7.4) for 1 h. After that, these GNSs were centrifuged and incubated in DMEM (pH 6.4) and added to HeLa cells cultured at pH 6.4. In all cycles, the final concentration of GNS-N/C 4 was ≈80 × 10−12 m. After incubation with cells at 37 °C and 5% CO2 for 4 h, cells were washed by cold PBS for three times and irradiated by an 808 nm laser at 2 W cm−2 for 3 min. The cell viability was determined by MTT assay as protocol described in the previous section. Cell live/dead staining was performed following the manufacturer's instruction (Invitrogen). The fluorescence imaging was captured by an IX71 microscopy (Olympus).
Biocompatibility Studies
HeLa cells, MCF-7 cells and 293T cells were cultured in DMEM supplemented with 10% FBS in 96-well plate at pH 7.4 followed by addition of PEGylated GNSs suspended in DMEM solutions. The final concentration of PEGylated GNSs (GNS-NH2, GNS-COOH, GNS-N/C 3–7) was 80 × 10−12 m. After incubation at 37 °C and 5% CO2 for 4 h or 24 h, the cell viability was determined by MTT assay as protocol described in the previous section.
In Vivo Biodistribution and PTT Studies
All procedures involving animals were approved by the Institutional Animal Care and Use Committee of Jinling hospital. Female Balb/c mice (6–8 weeks old) were maintained in a pathogen-free environment. 4T1 cells were cultured in RPMI-1640 medium supplemented with 10% FBS. Orthotopic mice models of breast cancer were established by injection of 4T1 cells (1 × 10⁵) into the fat pads in right abdominal mammary gland of female Balb/c mice. When the tumor size reached ≈60 mm3, the mice were subjected to four different treatments: group 1, intravenous (i.v.) injection of PBS following laser irradiation; group 2, i.v. injection of GNS-NH2 following laser irradiation; group 3, i.v. injection of GNS-COOH following laser irradiation; group 4, i.v. injection of GNS-N/C 4 following laser irradiation. 100 μL of ≈200 × 10−9 m GNS-N/C 4, GNS-COOH, GNS-NH2 or PBS were intravenously injected into the tumor-bearing mice. Tumors and major organs from mice of group 2, 3, and 4 were collected 24 h post-injection (three mice per group) and washed by PBS. The tissues were then digested by freshly prepared aqua regia to determine the gold concentration by ICP-AES.
For PTT studies, the tumors were exposed to 808 nm irradiation at 1 W cm−2 for 5 min 24 h post-injection. Tumors from the four groups (one mouse per group) were harvested six days after treatment for histological study by haematoxylin-eosin (H&E) staining. The volumes of tumors were monitored by caliper every two days after treatment and calculated by its greatest longitudinal diameter (length) and greatest transverse diameter (width) as this equation: volume = length × width2 × 0.5 (six mice per group).
In total, 40 mice were used for animal studies, including 12 mice for biodistribution studies, 24 mice for tumor growth studies, and 4 mice for H&E staining studies.
Statistical Analysis
The difference in cellular uptake and photothermal therapeutic efficacy of PEGylated GNSs between pH 6.4 and 7.4 was analyzed with two-sample t-test. The difference in biodistribution and tumor growth inhibition effect among GNS-COOH, GNS-NH2, and GNS-N/C 4 was analyzed with ANOVA followed by post hoc TukeyHSD test. All statistical analysis was performed using R statistical software (3.0.1).
Supplementary Material
Acknowledgements
S.W. and T.Z. contributed equally to this work. This project is financially supported by the National Key Basic Research Program of the P.R. China (Program Nos. 2014CB744504 and 2011CB707700), the Major International (Regional) Joint Research Program of China (Program No. 81120108013), the National Natural Science Foundation of China (Program Nos. 30930028 and 81201175), and the Natural Science Foundation of Jiangsu Province (Program No. BK20140734).
Footnotes
Supporting Information Supporting Information is available from the Wiley Online Library or from the author.
References
- [1].Thakor AS, Gambhir SS. Ca-Cancer J. Clin. 2013;63:395. doi: 10.3322/caac.21199. [DOI] [PubMed] [Google Scholar]
- [2].Smith BR, Ghosn EEB, Rallapalli H, Prescher JA, Larson T, Herzenberg LA, Gambhir SS. Nat. Nanotechnol. 2014;9:481. doi: 10.1038/nnano.2014.62. [DOI] [PMC free article] [PubMed] [Google Scholar]
- [3].Lee D-E, Koo H, Sun I-C, Ryu JH, Kim K, Kwon IC. Chem. Soc. Rev. 2012;41:2656. doi: 10.1039/c2cs15261d. [DOI] [PubMed] [Google Scholar]
- [4].Huang P, Bao L, Zhang C, Lin J, Luo T, Yang D, He M, Li Z, Gao G, Gao B, Fu S, Cui D. Biomaterials. 2011;32:9796. doi: 10.1016/j.biomaterials.2011.08.086. [DOI] [PubMed] [Google Scholar]
- [5].Wang J, Zhu G, You M, Song E, Shukoor MI, Zhang K, Altman MB, Chen Y, Zhu Z, Huang CZ, Tan W. ACS Nano. 2012;6:5070. doi: 10.1021/nn300694v. [DOI] [PMC free article] [PubMed] [Google Scholar]
- [6].Gao J, Chen K, Xie R, Xie J, Yan Y, Cheng Z, Peng X, Chen X. Bioconjugate Chem. 2010;21:604. doi: 10.1021/bc900323v. [DOI] [PMC free article] [PubMed] [Google Scholar]
- [7].Lee S, Xie J, Chen X. Chem. Rev. 2010;110:3087. doi: 10.1021/cr900361p. [DOI] [PMC free article] [PubMed] [Google Scholar]
- [8].Smith BR, Zavaleta C, Rosenberg J, Tong R, Ramunas J, Liu Z, Dai H, Gambhir SS. Nano Today. 2013;8:126. doi: 10.1016/j.nantod.2013.02.004. [DOI] [PMC free article] [PubMed] [Google Scholar]
- [9].Zhou B, Li J, Feng B-J, Ouyang Y, Liu Y-N, Zhou F. J. Inorg. Biochem. 2012;116:19. doi: 10.1016/j.jinorgbio.2012.06.014. [DOI] [PubMed] [Google Scholar]
- [10].Bedard PL, Hansen AR, Ratain MJ, Siu LL. Nature. 2013;501:355. doi: 10.1038/nature12627. [DOI] [PMC free article] [PubMed] [Google Scholar]
- [11].Huang X, Peng X, Wang Y, Wang Y, Shin DM, El-Sayed MA, Nie S. ACS Nano. 2010;4:5887. doi: 10.1021/nn102055s. [DOI] [PMC free article] [PubMed] [Google Scholar]
- [12].Marusyk A, Almendro V, Polyak K. Nat. Rev. Cancer. 2012;12:323. doi: 10.1038/nrc3261. [DOI] [PubMed] [Google Scholar]
- [13].Gerweck LE, Seetharaman K. Cancer Res. 1996;56:1194. [PubMed] [Google Scholar]
- [14].Du J-Z, Mao C-Q, Yuan Y-Y, Yang X-Z, Wang J. Biotechnol. Adv. 2014;32:789. doi: 10.1016/j.biotechadv.2013.08.002. [DOI] [PubMed] [Google Scholar]
- [15].Mura S, Nicolas J, Couvreur P. Nat Mater. 2013;12:991. doi: 10.1038/nmat3776. [DOI] [PubMed] [Google Scholar]
- [16].Liu J, Huang Y, Kumar A, Tan A, Jin S, Mozhi A, Liang X-J. Biotechnol. Adv. 2014;32:693. doi: 10.1016/j.biotechadv.2013.11.009. [DOI] [PubMed] [Google Scholar]
- [17].Min KH, Kim J-H, Bae SM, Shin H, Kim MS, Park S, Lee H, Park R-W, Kim I-S, Kim K, Kwon IC, Jeong SY, Lee DS. J. Controlled Release. 2010;144:259. doi: 10.1016/j.jconrel.2010.02.024. [DOI] [PubMed] [Google Scholar]
- [18].Gullotti E, Yeo Y. Mol. Pharm. 2009;6:1041. doi: 10.1021/mp900090z. [DOI] [PMC free article] [PubMed] [Google Scholar]
- [19].Yuan Y-Y, Mao C-Q, Du X-J, Du J-Z, Wang F, Wang J. Adv. Mater. 2012;24:5476. doi: 10.1002/adma.201202296. [DOI] [PubMed] [Google Scholar]
- [20].Huang S, Shao K, Liu Y, Kuang Y, Li J, An S, Guo Y, Ma H, Jiang C. ACS Nano. 2013;7:2860. doi: 10.1021/nn400548g. [DOI] [PubMed] [Google Scholar]
- [21].Jin E, Zhang B, Sun X, Zhou Z, Ma X, Sun Q, Tang J, Shen Y, Van Kirk E, Murdoch WJ, Radosz M. J. Am. Chem. Soc. 2013;135:933. doi: 10.1021/ja311180x. [DOI] [PubMed] [Google Scholar]
- [22].Du J-Z, Du X-J, Mao C-Q, Wang J. J. Am. Chem. Soc. 2011;133:17560. doi: 10.1021/ja207150n. [DOI] [PubMed] [Google Scholar]
- [23].Ling D, Park W, Park S-J, Lu Y, Kim KS, Hackett MJ, Kim BH, Yim H, Jeon YS, Na K, Hyeon T. J. Am. Chem. Soc. 2014;136:5647. doi: 10.1021/ja4108287. [DOI] [PubMed] [Google Scholar]
- [24].Velema WA, Szymanski W, Feringa BL. J. Am. Chem. Soc. 2014;136:2178. doi: 10.1021/ja413063e. [DOI] [PubMed] [Google Scholar]
- [25].Yang W, Zhang L, Wang S, White AD, Jiang S. Biomaterials. 2009;30:5617. doi: 10.1016/j.biomaterials.2009.06.036. [DOI] [PubMed] [Google Scholar]
- [26].Jiang S, Cao Z. Adv. Mater. 2010;22:920. doi: 10.1002/adma.200901407. [DOI] [PubMed] [Google Scholar]
- [27].Yang W, Xue H, Li W, Zhang J, Jiang S. Langmuir. 2009;25:11911. doi: 10.1021/la9015788. [DOI] [PubMed] [Google Scholar]
- [28].Murthy AK, Stover RJ, Hardin WG, Schramm R, Nie GD, Gourisankar S, Truskett TM, Sokolov KV, Johnston KP. J. Am. Chem. Soc. 2013;135:7799. doi: 10.1021/ja400701c. [DOI] [PMC free article] [PubMed] [Google Scholar]
- [29].Pillai PP, Huda S, Kowalczyk B, Grzybowski BA. J. Am. Chem. Soc. 2013;135:6392. doi: 10.1021/ja4001272. [DOI] [PubMed] [Google Scholar]
- [30].Liu X, Huang H, Jin Q, Ji J. Langmuir. 2011;27:5242. doi: 10.1021/la2002223. [DOI] [PubMed] [Google Scholar]
- [31].Liu X, Chen Y, Li H, Huang N, Jin Q, Ren K, Ji J. ACS Nano. 2013;7:6244. doi: 10.1021/nn402201w. [DOI] [PubMed] [Google Scholar]
- [32].Wang S, Huang P, Nie L, Xing R, Liu D, Wang Z, Lin J, Chen S, Niu G, Lu G, Chen X. Adv. Mater. 2013;25:3055. doi: 10.1002/adma.201204623. [DOI] [PMC free article] [PubMed] [Google Scholar]
- [33].Nie L, Wang S, Wang X, Rong P, Ma Y, Liu G, Huang P, Lu G, Chen X. Small. 2014;10:1585. doi: 10.1002/smll.201302924. [DOI] [PubMed] [Google Scholar]
- [34].Yuan H, Khoury CG, Hwang H, Wilson CM, Grant GA, Vo-Dinh T. Nanotechnology. 2012;23:075102. doi: 10.1088/0957-4484/23/7/075102. [DOI] [PMC free article] [PubMed] [Google Scholar]
- [35].Nam J, Won N, Jin H, Chung H, Kim S. J. Am. Chem. Soc. 2009;131:13639. doi: 10.1021/ja902062j. [DOI] [PubMed] [Google Scholar]
- [36].Nel AE, Mädler L, Velegol D, Xia T, Hoek EMV, Somasundaran P, Klaessig F, Castranova V, Thompson M. Nat. Mater. 2009;8:543. doi: 10.1038/nmat2442. [DOI] [PubMed] [Google Scholar]
- [37].Wang Y, Black KC, Luehmann H, Li W, Zhang Y, Cai X, Wan D, Liu S-Y, Li M, Kim P. ACS Nano. 2013;7:2068. doi: 10.1021/nn304332s. [DOI] [PMC free article] [PubMed] [Google Scholar]
- [38].Verma A, Stellacci F. Small. 2010;6:12. doi: 10.1002/smll.200901158. [DOI] [PubMed] [Google Scholar]
- [39].Albanese A, Tang PS, Chan WCW. Annu. Rev. Biomed. Eng. 2012;14:1. doi: 10.1146/annurev-bioeng-071811-150124. [DOI] [PubMed] [Google Scholar]
- [40].Arvizo RR, Miranda OR, Thompson MA, Pabelick CM, Bhattacharya R, Robertson JD, Rotello VM, Prakash YS, Mukherjee P. Nano Lett. 2010;10:2543. doi: 10.1021/nl101140t. [DOI] [PMC free article] [PubMed] [Google Scholar]
- [41].Goodman CM, McCusker CD, Yilmaz T, Rotello VM. Bioconjugate Chem. 2004;15:897. doi: 10.1021/bc049951i. [DOI] [PubMed] [Google Scholar]
Associated Data
This section collects any data citations, data availability statements, or supplementary materials included in this article.


