

Abstract
As one of the most abundant RNA post-transcriptional modifications, N6-methyladenosine (m6A) involves in a broad spectrum of biological and physiological processes ranging from mRNA splicing and stability to cell differentiation and reprogramming. However, experimental identification of m6A sites is expensive and laborious. Therefore, it is urgent to develop computational methods for reliable prediction of m6A sites from primary RNA sequences. In the current study, a new method called RAM-ESVM was developed for detecting m6A sites from Saccharomyces cerevisiae transcriptome, which employed ensemble support vector machine classifiers and novel sequence features. The jackknife test results show that RAM-ESVM outperforms single support vector machine classifiers and other existing methods, indicating that it would be a useful computational tool for detecting m6A sites in S. cerevisiae. Furthermore, a web server named RAM-ESVM was constructed and could be freely accessible at http://server.malab.cn/RAM-ESVM/.
Among the ~150 kinds of RNA modifications identified in cellular RNA1, N6-methyladenosine (m6A) is the most abundant one and is catalyzed by N6-adenosyl methyltransferases including METTL3, METTL14 and WTAP2. Since it was discovered in 1970s, m6A has been found from bacteria to Homo sapiens1. Recent studies have suggested that m6A joined a series of molecular processes such as protein translation and localization3, and even contributed to obesity4, brain development abnormalities and other diseases5. As indicated in a recent study6, m6A is non-randomly distributed in the genome. Thus, the knowledge about the positions of m6A site is important for understanding its biological functions.
Attribute to the high-throughput experimental techniques, the genome-wide distribution of m6A are now available for several species, such as Saccharomyces cerevisiae6, Arabidopsis thaliana7, Mus musculus8 and Homo sapiens8. Recently, Jaffrey and his colleagues provided the single-nucleotide resolution map of the m6A sites across human transcriptome by using the miCLIP technique9. However, the resolution of m6A sites for other species is not fully satisfactory, i.e. they couldn’t pick out the modified adenosine residue sites. Moreover, wet experiments are laborious in performing genome-wide m6A sites detections. So it is essential and necessary to employ novel computational approaches for detecting m6A sites. In silico approaches would also do the detection in genome-wide scale and could help to save the wet experiments cost.
The high-resolution experimental data provided unprecedented opportunities and made it feasible to develop computational methods for accurately predicting m6A sites. Depending on these data, various computational methods have been proposed to identify m6A sites. By encoding RNA sequence using nucleotide chemical property and pseudo nucleotide composition, Chen et al. have proposed two yeast-specific m6A site prediction webservers10,11. Inspired by Chen et al.’s works10,11, Zhou and his co-workers also proposed a mammalian m6A site predictor named SRAMP12. Subsequently, a webserver called MethyRNA was proposed to identify m6A sites in H. sapiens and M. musculus13. Although the performances of existing methods are satisfactory for identifying m6A site in mammalian transcriptomes13, they fails to accurately identify m6A site in yeast12. This may be due to the fact that the information around the yeast m6A site has not been fully characterized12. More recently, Zhang et al. improved the performance of identifying m6A site in yeast by introducing the heuristic nucleotide physical-chemical property selection algorithm14. However, the performance for identifying m6A site in yeast transcriptome is still not satisfactory and should be improved further.
Keeping this in mind, in the present study, we proposed an ensemble classifier, called RAM-ESVM, for detecting m6A sites in S. cerevisiae. RAM-ESVM combined three basic classifiers, namely SVM-PseKNC, SVM-motif and GkmSVM15, which were constructed by using PseKNC16,17, motif features, and optimized K-mer as the features, respectively. The predictive results obtained on the benchmark dataset demonstrate that RAM-ESVM can obviously improve the predictive performance by combining various features and also outperforms the existing methods.
Result and Discussion
Comparison of different feature extraction strategies
In order to demonstrate the effectiveness of PseDNC and motif features for m6A sites prediction, we compared the performance of PseDNC and motif features with other RNA sequence features. Xue et al.18 have proposed 32-D (dimensional) triplet features for microRNA precursor identification. The 32-D features include RNA secondary structure information and are proved to represent RNA sequence well. More recently, Wei et al.19 developed the RNA sequence numeric fingerprints to 98-D, which was proved to be more robust for human microRNA detection. The 98-D features not only include Xue’s 32-D features and but also include free energy features. Therefore, we employed the SVM to perform the comparisons between the models based on our PseDNC and motif features with that based on the 32D and 98D features. Their jackknife test results are showed in Table 1. We can see that the model based on motif features yielded the best predictive accuracy. The performance of the model based on PseDNC is comparable with that based on the 98D features. However, the PseDNC could include local and global sequence order information with a lower dimension. Therefore, PseDNC and motif features were used to encode the samples in the current work.
Table 1. Comparison of different parameters for identifying m6A sites.
| Parameters | Sn (%) | Sp (%) | Acc (%) | MCC |
|---|---|---|---|---|
| 32D | 64.27 | 55.78 | 60.02 | 0.20 |
| 98D | 70.00 | 63.42 | 66.71 | 0.33 |
| motif | 66.25 | 78.56 | 72.41 | 0.45 |
| PseDNC | 71.08 | 60.21 | 65.65 | 0.31 |
Comparison of SVM and other classifiers
To demonstrate the superiority of using SVM for identifying m6A sites, we compared its performance with that of other methods, such as Random Forest (RF), K-Nearest Neighbor (KNN), J48 and Naïve Bayes. Inspired by a previous study11, the other classifiers were implemented in WEKA20 with their default parameters. Table 2 showed the jackknife test comparison of m6A sites prediction accuracy in the benchmark dataset. We noticed that the predictive accuracy (Acc) and mathew’s correlation coefficient (MCC) of SVM are superior to those of other methods by using the PseDNC and motif features, respectively. Therefore, the SVM was used to build computational models in the followings.
Table 2. Comparison of SVM with other classifiers for identifying m6A sites.
| Classifiers | Parameters | Sn (%) | Sp (%) | Acc (%) | MCC |
|---|---|---|---|---|---|
| Naïve Bayes | motif | 84.92 | 50.49 | 67.71 | 0.38 |
| PseDNC | 74.98 | 51.87 | 63.43 | 0.27 | |
| Random Forest | motif | 66.64 | 75.59 | 71.11 | 0.42 |
| PseDNC | 65.72 | 60.52 | 63.12 | 0.26 | |
| J48 | motif | 62.74 | 68.94 | 65.84 | 0.32 |
| PseDNC | 62.89 | 51.26 | 57.08 | 0.14 | |
| KNN | motif | 32.36 | 86.91 | 59.64 | 0.23 |
| PseDNC | 57.84 | 54.39 | 56.12 | 0.12 | |
| SVM | motif | 66.25 | 78.56 | 72.41 | 0.45 |
| PseDNC | 71.08 | 60.21 | 65.65 | 0.31 |
Comparison of ensemble SVM with single SVM
Several works suggested that ensemble classifier would improve the performance21,22,23. Here, we employed PseDNC features together with SVM, motif features together with SVM, and GkSVM as three basic classifiers. They vote for the final results. Table 3 shows the performance comparison in detail. We found that the ensemble SVM worked better and improved nearly 10 percent from the basic classifiers for identifying m6A sites. Therefore, a m6A site predictor, called RAM-ESVM, was developed based on the ensemble SVM, where “R” stands for RNA, “A” stands for N6-adenosine, “M” stands for methylation, “E” stands for Ensemble, “SVM” stands for Support Vector Machine.
Table 3. Performance of ensemble SVM and the single SVMs.
| Parameters | Sn (%) | Sp (%) | Acc (%) | MCC |
|---|---|---|---|---|
| motif | 66.25 | 78.56 | 72.41 | 0.45 |
| PseDNC | 71.08 | 60.21 | 65.65 | 0.31 |
| gksvm | 72.03 | 77.39 | 74.71 | 0.49 |
| Ensemble SVM | 78.93 | 77.78 | 78.35 | 0.57 |
Comparison of RAM-ESVM with existing method
To the best of our knowledge, M6A-HPCS14 is the best predictor for identifying m6A sites in yeast. In order to further verify the power of RAM-ESVM on the m6A prediction task, we compared its performance with that of M6A-HPCS by using the same benchmark dataset as that used in the current work. From Table 4 we could conclude that the rates for Sn, Sp, Acc and MCC of RAM-ESVM are all higher than that of M6A-HPCS, indicating that RAM-ESVM is quite promising for identifying m6A sites.
Table 4. Comparative results for identifying m6A sites between different methods.
| Predictor | Sn (%) | Sp (%) | Acc (%) | MCC |
|---|---|---|---|---|
| M6A-HPCS | 77.35 | 67.41 | 72.38 | 0.45 |
| RAM-ESVM | 78.93 | 77.78 | 78.35 | 0.57 |
Web server description
In order for the conveniences of scientific community, a freely accessible online web-server of RAM-ESVM was established, which could benefit for the biological researchers. Its top-page is shown in Fig. 1.
Figure 1. A semi-screenshot for the top-page of the RAM-ESVM web-server at http://server.malab.cn/RAM-ESVM/.

The users can either paste or type their query RNA sequences for submission, which should be with FASTA format. By clicking the “Submit” button, the predictive results will be shown in a new page and the detected m6A sites will be indicated in red. For the user’s convenience, the results can also be saved in tab-delimited text format by clicking the “Fasta Format Result” button.
Conclusions
m6A plays important roles in many biological processes. With the rapid increase in amount of transcriptome data, there is a growing need for developing efficient and reliable computational methods to accurately identify m6A sites. In the present work, a new predictor, called RAM-ESVM, was developed to identify m6A sites, which is based on an ensemble of support vector machine classifiers. Although SVM was chosen as the classifier, the features are heterogeneous. The first one employed PseKNC features, which are always used in RNA/DNA classification. The second one is motif features, which is proposed first time in this work. The third one is a string classifier. It avoided feature extraction for RNA sequences. They modified the kernel computation and deal with the strings as vectors. The jackknife test results demonstrate that RAM-ESVM is very promising and outperforms M6A-HPCS which is the best of the existing web servers for m6A sites detection in S. cerevisiae.
The better performance of RAM-ESVM could be attributed to the following reasons. In RAM-ESVM, not only the sequence local and global sequence information was included by encoding RNA sequences using PseKNC, but also the sequence motifs were considered. Since the m6A is catalyzed by N6-adenosyl methyltransferases, the sequence motifs determined by MEME and DMINDA may be the binding targets of the N6-adenosyl methyltransferases.
In order to benefit for the vast majority of biology scientists, a user-friendly web server named RAM-ESVM has been established at http://server.malab.cn/RAM-ESVM/, by which users can easily obtain their desired results. It is anticipated that RAM-ESVM will become an essential software tool for identifying m6A in yeast.
Materials and Methods
Dataset
The benchmark dataset in this paper was obtained from our previous work10, which contains 1,307 positive sequences (containing m6A sites) and 1,307 negative sequences (non m6A sites). The 1,307 positive samples were experimentally identified m6A sites. In order to balance the training set, the 1,307 negative samples were randomly picked out from the 33,280 non-m6A sites. All the positive and negative samples are 51-nt with the sequence similarity less than 85%.
Sequence encoding schemes
The merits of multi view learning have been demonstrated in several weak classification problems. Therefore, in order to include the genomic information as much as possible, two kinds of features were used to build SVM classifiers. The first kind of feature is pseudo nucleotide composition. The other one is the gapped sequence motif features. These two kinds of features were extracted with different views. Their definitions are as following.
Pseudo nucleotide composition
In order to formulate the sequences using a mathematical expression that can truly reflect their intrinsic correlation with the target to be predicted, the pseudo nucleotide composition (PseKNC) has been proposed16,17. By using PseKNC, both the local and global sequence order information could be included24. Accordingly, the pseudo dinucleotide composition (PseDNC) was used to represent the RNA sequences in the benchmark dataset and can be defined as,
 |
where
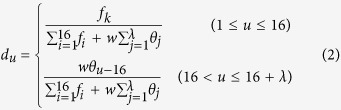 |
where fk
 is the normalized occurrence frequency of the non-overlapping dinucleotides in RNA sequence. λ is the number of the total counted ranks (or tiers) of the correlations along a RNA sequence, and
  is the weight factor; while the correlation factor θj represents the j-tier structural correlation factor between all the j-th most contiguous dinucleotide Di = RiRi+1 and is defined as,
 |
The correlation function Θ(Di, Dj) is given by
 |
where v is the number of RNA physicochemical properties.
Since the formation of RNA secondary structure decreases the m6A methylation6, the following three physicochemical properties, namely enthalpy25, entropy25 and free energy26 that can quantify the RNA secondary structures, are used to calculate the global or long-range sequence-order effects. Hence, v equals to 3 and indicates three kinds of physicochemical properties were considered in the current study. The concrete values of the three physicochemical properties are listed in Table 5. Note that before substituting them into Eq. 4, all the original values were subjected to a standard conversion, as described by the following equation
Table 5. The original enthalpy, entropy and free energy values of the dinucleotides.
| Dinucleotide | Enthalpy | Entropy | Free energy |
|---|---|---|---|
| GG | −12.2 | −29.7 | −3.26 |
| GA | −13.3 | −35.5 | −2.35 |
| GC | −14.2 | −34.9 | −3.42 |
| GU | −10.2 | −26.2 | −2.24 |
| AG | −7.6 | −19.2 | −2.08 |
| AA | −6.6 | −18.4 | −0.93 |
| AC | −10.2 | −26.2 | −2.24 |
| AU | −5.7 | −15.5 | −1.10 |
| CG | −8.0 | −19.4 | −2.36 |
| CA | −10.5 | −27.8 | −2.11 |
| CC | −12.2 | −29.7 | −3.26 |
| CU | −7.6 | −19.2 | −2.08 |
| UG | −7.6 | −19.2 | −2.11 |
| UA | −8.1 | −22.6 | −1.33 |
| UC | −10.2 | −26.2 | −2.35 |
| UU | −6.6 | −18.4 | −0.93 |
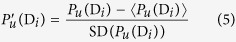 |
where the symbol < > means taking the average of the quantity therein over the 16 different dinucleotides, and SD means the corresponding standard deviation.
In order to reduce the computational time, the 10-fold cross-validation approach was used to optimize the two parameters. We found that the optimal values for  and
and  are 0.9 and 6, respectively.
Motif features
Motifs are considered as sequence signal for several genomic elements, such as gene Transcription Starting Sites (TSS), Transcription Factor Binding Sites (TFBS). There are also some works considering that weak motifs also appears in the upstream regions of miRNAs27,28. Sequence motifs can be detected from software tools, including MEME29, DMINDA30. Here we try to analyze the motifs around the m6A sites, and then employ them as classification features.
Positive and negative sequences were inserted into a general suffix tree. Then all the substrings were listed if it only appeared in the positive sequences or negative ones. We set the least length as 4. So the appearance of these substrings was selected as motif features. If it appeared in one sequence, the feature value was set as 1. Otherwise, the value is 0. Following this process, every sequence was represented as a Boolean vector.
Ensembles of Support Vector Machine classifiers
Ensemble classifiers were considered to work well on the weak classification problems. However, if the training set was not big enough, ensemble classifiers may cause over-fitting and had weak generalization. Support vector machine (SVM) was always employed for the “small sample size problem”. Structural risk minimization brings good generalization for support vector machine. In order to improve the prediction performance and avoid the over-fitting problem, we proposed a novel ensemble support vector machine strategy for m6A prediction.
Ensemble classifier consists of several basic classifiers, and outputs the voting results of the basic classifiers. Research works have agreed that diversity of basic classifiers would improve the voting performance. Here we employed three different SVM classifiers and combined them as an ensemble one. Diversity of the three different SVM classifiers ought to be as more as possible, while accuracy of every SVM classifier need be maintained.
The first two classifiers, namely SVM-PseKNC and SVM-motif, were built based on SVM by using PseKNC and motif features as the inputs, respectively. Although these proper sequence features could be helpful for DNA/protein function prediction, it is believed that numerical features would miss sequence information. Finding good features for the DNA/protein sequence is still empirically difficult and a challenge for the weak classification problems. So some researchers proposed string kernel SVM for the DNA/protein sequence classification problems. Optimized gapped kmers were embedded in the kernel computation, and numerical feature extraction was avoided before SVM classification. GkmSVM15 is a software tool, which can deal with DNA sequences directly as training samples. Here we employed GkmSVM as the third basic classifier.
Figure 2 shows the prediction process with the ensemble SVM classifiers. The three basic classifiers votes for the final result. We set different weights to the three basic classifiers as following,
Figure 2. The workflow of RAM-ESVM.

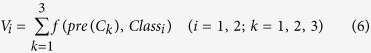 |
where Vi is the voting score for the RNA sample belonging to the classi (m6A sites or non- m6A sites), f(pre(Ck), Classi) is the score function defined as
 |
The final prediction is determined by.
 |
Sgn(i) is argument that maximizes the voting score Vi.
Why and when will voting win?
Here we try to analyze the 3 classifiers’ voting strategy. Suppose that the accuracies of the 3 classifiers are p1, p2, p3 (0.5 < {p1, p2, p3} < 1), respectively. So the accuracy of the voted ensemble independent classifiers would be
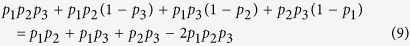 |
If p1 ≈ p2 ≈ p3 = q, the accuracy of ensemble classifier would be 3q2 − 2q3. It is easy to prove that 3q2 − 2q3 > q. Since 0.5 < q < 1, q(2q − 1)(q − 1) < 0, it’s obvious 3q2 − 2q3 > q. Therefore, we can conclude that if the three basic classifiers are independent and approximately equally accuracy, the voting result would be better than the single classifier. In this work, our three basic classifiers employed different features and performed among ~70% accuracy. So the voting strategy could improve the performance.
Performance evaluation
All the methods were evaluated with sensitivity (Sn), specificity (Sp), Accuracy (Acc) and the Mathew’s correlation coefficient (MCC), which are expressed as
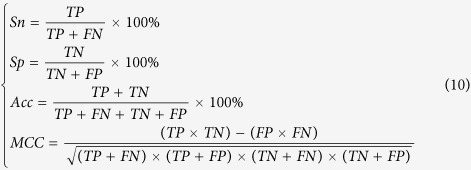 |
where TP, TN, FP, and FN represent true positive, true negative, false positive, and false negative, respectively.
Additional Information
How to cite this article: Chen, W. et al. Detecting N6-methyladenosine sites from RNA transcriptomes using ensemble Support Vector Machines. Sci. Rep. 7, 40242; doi: 10.1038/srep40242 (2017).
Publisher's note: Springer Nature remains neutral with regard to jurisdictional claims in published maps and institutional affiliations.
Acknowledgments
The work was supported by the Natural Science Foundation of China (No. 61370010), the State Key Laboratory of Medicinal Chemical Biology in China, Program for the Top Young Innovative Talents of Higher Learning Institutions of Hebei Province (No. BJ2014028), the Outstanding Youth Foundation of North China University of Science and Technology (No. JP201502).
Footnotes
Author Contributions W.C. and Q.Z. conceived and designed the experiments; P.X., W.C. and Q.Z. implemented SVM and created the webserver; W.C. and Q.Z. performed the analysis and wrote the paper. All authors read and approved the final manuscript.
References
- Cantara W. A. et al. The RNA Modification Database, RNAMDB: 2011 update. Nucleic acids research 39, D195–201, doi: 10.1093/nar/gkq1028 (2011). [DOI] [PMC free article] [PubMed] [Google Scholar]
- Liu J. & Jia G. Methylation modifications in eukaryotic messenger RNA. Journal of genetics and genomics = Yi chuan xue bao 41, 21–33, doi: 10.1016/j.jgg.2013.10.002 (2014). [DOI] [PubMed] [Google Scholar]
- Meyer K. D. & Jaffrey S. R. The dynamic epitranscriptome: N6-methyladenosine and gene expression control. Nature reviews. Molecular cell biology 15, 313–326, doi: 10.1038/nrm3785 (2014). [DOI] [PMC free article] [PubMed] [Google Scholar]
- Nilsen T. W. Molecular biology. Internal mRNA methylation finally finds functions. Science 343, 1207–1208, doi: 10.1126/science.1249340 (2014). [DOI] [PubMed] [Google Scholar]
- Meyer K. D. et al. Comprehensive analysis of mRNA methylation reveals enrichment in 3′ UTRs and near stop codons. Cell 149, 1635–1646, doi: 10.1016/j.cell.2012.05.003 (2012). [DOI] [PMC free article] [PubMed] [Google Scholar]
- Schwartz S. et al. High-resolution mapping reveals a conserved, widespread, dynamic mRNA methylation program in yeast meiosis. Cell 155, 1409–1421, doi: 10.1016/j.cell.2013.10.047 (2013). [DOI] [PMC free article] [PubMed] [Google Scholar]
- Luo G. Z. et al. Unique features of the m6A methylome in Arabidopsis thaliana. Nature communications 5, 5630, doi: 10.1038/ncomms6630 (2014). [DOI] [PMC free article] [PubMed] [Google Scholar]
- Dominissini D. et al. Topology of the human and mouse m6A RNA methylomes revealed by m6A-seq. Nature 485, 201–206, doi: 10.1038/nature11112 (2012). [DOI] [PubMed] [Google Scholar]
- Linder B. et al. Single-nucleotide-resolution mapping of m6A and m6Am throughout the transcriptome. Nature methods 12, 767–772, doi: 10.1038/nmeth.3453 (2015). [DOI] [PMC free article] [PubMed] [Google Scholar]
- Chen W., Feng P., Ding H., Lin H. & Chou K. C. iRNA-Methyl: Identifying N(6)-methyladenosine sites using pseudo nucleotide composition. Analytical biochemistry 490, 26–33, doi: 10.1016/j.ab.2015.08.021 (2015). [DOI] [PubMed] [Google Scholar]
- Chen W., Tran H., Liang Z., Lin H. & Zhang L. Identification and analysis of the N(6)-methyladenosine in the Saccharomyces cerevisiae transcriptome. Scientific reports 5, 13859, doi: 10.1038/srep13859 (2015). [DOI] [PMC free article] [PubMed] [Google Scholar]
- Zhou Y., Zeng P., Li Y. H., Zhang Z. & Cui Q. SRAMP: prediction of mammalian N6-methyladenosine (m6A) sites based on sequence-derived features. Nucleic acids research 44, e91, doi: 10.1093/nar/gkw104 (2016). [DOI] [PMC free article] [PubMed] [Google Scholar]
- Chen W., Tang H. & Lin H. MethyRNA: a web server for identification of N6-methyladenosine sites. Journal of biomolecular structure & dynamics. 1–5, doi: 10.1080/07391102.2016.1157761 (2016). [DOI] [PubMed] [Google Scholar]
- Zhang M. et al. Improving N(6)-methyladenosine site prediction with heuristic selection of nucleotide physical-chemical properties. Analytical biochemistry 508, 104–113, doi: 10.1016/j.ab.2016.06.001 (2016). [DOI] [PubMed] [Google Scholar]
- Ghandi M. et al. gkmSVM: an R package for gapped-kmer SVM. Bioinformatics 32, 2205–2207 (2016). [DOI] [PMC free article] [PubMed] [Google Scholar]
- Chen W., Lei T. Y., Jin D. C., Lin H. & Chou K. C. PseKNC: a flexible web server for generating pseudo K-tuple nucleotide composition. Analytical biochemistry 456, 53–60, doi: 10.1016/j.ab.2014.04.001 (2014). [DOI] [PubMed] [Google Scholar]
- Chen W. et al. PseKNC-General: a cross-platform package for generating various modes of pseudo nucleotide compositions. Bioinformatics 31, 119–120, doi: 10.1093/bioinformatics/btu602 (2015). [DOI] [PubMed] [Google Scholar]
- Xue C. et al. Classification of real and pseudo microRNA precursors using local structure-sequence features and support vector machine. BMC bioinformatics 6, 1 (2005). [DOI] [PMC free article] [PubMed] [Google Scholar]
- Wei L. et al. Improved and Promising Identification of Human MicroRNAs by Incorporating a High-quality Negative Set. IEEE/ACM Transactions on Computational Biology and Bioinformatics 11, 192–201 (2014). [DOI] [PubMed] [Google Scholar]
- Frank E., Hall M., Trigg L., Holmes G. & Witten I. H. Data mining in bioinformatics using Weka. Bioinformatics 20, 2479–2481, doi: 10.1093/bioinformatics/bth261 (2004). [DOI] [PubMed] [Google Scholar]
- Zou Q. et al. Improving tRNAscan-SE annotation results via ensemble classifiers. Molecular Informatics 34, 761–770 (2015). [DOI] [PubMed] [Google Scholar]
- Lin C. et al. Hierarchical Classification of Protein Folds Using a Novel Ensemble Classifier. PLoS One 8, e56499 (2013). [DOI] [PMC free article] [PubMed] [Google Scholar]
- Zou Q. et al. An approach for identifying cytokines based on a novel ensemble classifier. BioMed research international 2013, 686090 (2013). [DOI] [PMC free article] [PubMed] [Google Scholar]
- Chen W., Lin H. & Chou K. C. Pseudo nucleotide composition or PseKNC: an effective formulation for analyzing genomic sequences Molecular Biosystems, doi: 10.1039/C5MB00155B (2015). [DOI] [PubMed] [Google Scholar]
- Xia T. et al. Thermodynamic parameters for an expanded nearest-neighbor model for formation of RNA duplexes with Watson-Crick base pairs. Biochemistry 37, 14719–14735, doi: 10.1021/bi9809425 (1998). [DOI] [PubMed] [Google Scholar]
- Freier S. M. et al. Improved free-energy parameters for predictions of RNA duplex stability. Proceedings of the National Academy of Sciences of the United States of America 83, 9373–9377 (1986). [DOI] [PMC free article] [PubMed] [Google Scholar]
- Huang Y., Shen X., Zou Q. & Tang S. Genomic analysis of silkworm microRNA promoters and clusters. Molecular Biology 45, 197–203 (2011). [PubMed] [Google Scholar]
- Wang G. et al. Identification of transcription factor and microRNA binding sites in responsible to fetal alcohol syndrome. BMC genomics 9, 1 (2008). [DOI] [PMC free article] [PubMed] [Google Scholar]
- Bailey T. L. et al. MEME SUITE: tools for motif discovery and searching. Nucleic acids research. gkp335 (2009). [DOI] [PMC free article] [PubMed] [Google Scholar]
- Ma Q. et al. DMINDA: an integrated web server for DNA motif identification and analyses. Nucleic acids research 42, W12–W19 (2014). [DOI] [PMC free article] [PubMed] [Google Scholar]