

Abstract
Background. Transgender individuals have a gender identity that differs from the sex they were assigned at birth. The population size of transgender individuals in the United States is not well-known, in part because official records, including the US Census, do not include data on gender identity. Population surveys today more often collect transgender-inclusive gender-identity data, and secular trends in culture and the media have created a somewhat more favorable environment for transgender people.
Objectives. To estimate the current population size of transgender individuals in the United States and evaluate any trend over time.
Search methods. In June and July 2016, we searched PubMed, Cumulative Index to Nursing and Allied Health Literature, and Web of Science for national surveys, as well as “gray” literature, through an Internet search. We limited the search to 2006 through 2016.
Selection criteria. We selected population-based surveys that used probability sampling and included self-reported transgender-identity data.
Data collection and analysis. We used random-effects meta-analysis to pool eligible surveys and used meta-regression to address our hypothesis that the transgender population size estimate would increase over time. We used subsample and leave-one-out analysis to assess for bias.
Main results. Our meta-regression model, based on 12 surveys covering 2007 to 2015, explained 62.5% of model heterogeneity, with a significant effect for each unit increase in survey year (F = 17.122; df = 1,10; b = 0.026%; P = .002). Extrapolating these results to 2016 suggested a current US population size of 390 adults per 100 000, or almost 1 million adults nationally. This estimate may be more indicative for younger adults, who represented more than 50% of the respondents in our analysis.
Authors’ conclusions. Future national surveys are likely to observe higher numbers of transgender people. The large variety in questions used to ask about transgender identity may account for residual heterogeneity in our models.
Public health implications. Under- or nonrepresentation of transgender individuals in population surveys is a barrier to understanding social determinants and health disparities faced by this population. We recommend using standardized questions to identify respondents with transgender and nonbinary gender identities, which will allow a more accurate population size estimate.
PLAIN-LANGUAGE SUMMARY
We used data from national surveys to estimate the population size of transgender people in the United States. Estimates of the number of transgender adults significantly increased over the past decade, with a current best estimate of 390 per 100 000 adults. That is about 1 in every 250 adults, or almost 1 million Americans. These numbers may be more typical of younger adults than of the entire US population. We expect that future surveys will find higher numbers of transgender people and recommend that standardized questions be used, which will allow a more accurate population size estimate.
FIGURE 3—
Meta-Regression Showing the Proportion of Transgender Adults Against Survey Year
Transgender individuals have a gender identity that differs from the sex they were assigned at birth.1 Research has shown that transgender individuals around the world and in the United States are exposed to widespread social stigma, discrimination, harassment, and physical and sexual abuse.2,3 Compared with the general population, a national survey conducted in the United States in 2008 found that transgender individuals were 4 times more likely to live in extreme poverty, had double the rate of unemployment, and had almost double the rate of being homeless.4 In terms of health, transgender individuals had 4 times the rate of being HIV-infected and 28% postponed medical care because of discrimination. Particularly alarming is that 41% of survey respondents reported at least 1 suicide attempt. A barrier to understanding social determinants and health disparities faced by transgender people is the under- or nonrepresentation in a range of demographic and health-monitoring activities,5 which may result from a lack of transgender-inclusive data collection with regard to gender identity.
Accurate representation of the transgender population is complicated by the diversity within the community with regard to language and subcultures.6,7 Moreover, the clinical literature has long conflated transgender identity with homosexuality.8,9 Although a relationship between gender identity and sexual orientation may exist, the American Psychological Association (APA) recognizes that “Transgender people, like cis-gender people, may be sexually oriented toward men, women, both sexes, or neither sex. . . .”10,11 Current best practice for collecting transgender-inclusive gender identity data is the 2-step method, which has been shown to optimize accurate identification of transgender people in a population.12 This method records current gender identity as well as the sex assigned at birth; transgender people are those who identify as such and those whose current gender identity and sex assigned at birth differ.13 This method allows the capture of people who identify with a binary gender (male or female), such as a transgender man who identifies only as male,14 as well as others who may be considered transgender from a demographic perspective, even if they do not identify with the term “transgender,” such as people who identify as genderqueer, agender, or having no gender.15,16
The US Census and other official records kept by such agencies as the National Archives or state departments of motor vehicles report sex, typically based on the sex assigned at birth or the legal sex, but they do not report current gender identity. They are also not able to record whether the legal sex differs from the sex assigned at birth. As a result, at the most basic level, the population size of transgender individuals in the United States is not well-known.
On the basis of a limited number of sources in 2009, the APA estimated the number of transgender individuals in the United States at 115 000 to 450 000, or 38 to 147 per 100 000 by using US Census data for that year’s total population size.11 The value of these numbers is limited, as the lower limit was based on members of a lesbian, gay, bisexual, and transgender (LGBT) Web site who identified as transgender, which is unlikely to be representative of the US general population, and the upper limit was based on an older and in part nonprobability sample of North Americans,17 which may not reflect current numbers in the United States. More recent US population-based surveys have reported transgender population sizes that are higher, ranging from 153 to 1647 per 100 000.18 These estimates may not generalize to the United States as a whole, as they were based on data collected in Massachusetts adults19 and 9th to 12th graders in Boston public schools.20 Perhaps the best current estimate is provided by Flores et al. who estimated that 0.6% of US adults, approximately 560 per 100 000, identify as transgender.21 They used data from the Behavioral Risk Factor Surveillance System (BRFSS), which is administered annually to randomly selected adults across the United States.
Because contemporary surveys more often collect transgender-inclusive gender-identity data, and secular trends in culture and the media have created a somewhat more favorable environment for transgender people, it is possible that the measured size of the transgender population has increased over time, rendering previous reports of population size even less applicable today. The primary aim of this study was to estimate the number of transgender individuals in the United States by performing a meta-analysis of population-based national surveys. A secondary aim was to evaluate for any trend over time. We hypothesized that the estimates of transgender population size would increase over time. Knowledge of the transgender population size can support the development of social policy that aims to protect transgender individuals against stigma and discrimination. From a health perspective, knowledge of the size of the transgender population can inform the development of health care programs to benefit transgender people, as well as inform insurance companies on how to best provide coverage for such care.
METHODS
We systematically searched for national surveys in PubMed, Cumulative Index to Nursing and Allied Health Literature, and Web of Science. The search was limited to 2006 to 2016, as older surveys are unlikely to contain transgender-inclusive gender-identity data. Eligible surveys were population-based and nonclinical, as recommended by Deutsch,18 and collected data on transgender identity in probability samples. The search combined the terms “national” and “survey” in titles or abstracts with “gender identity” anywhere in the publication and was performed on July 5, 2016. Knowing that large national surveys often have dedicated Web pages that report methods and data (e.g., the BRFSS, the National Health Interview Survey [NHIS]), we also searched the Internet for “gray” literature with the search terms “survey,” “gender,” and “health” in the Internet domains “.gov,” “.edu,” and “.us,” which are the domains affiliated with the United States. We performed this search with the Google search engine between June 1 and 13, 2016. We included the search term “health” to narrow these Internet search results, assuming that surveys with transgender-inclusive gender-identity data would most likely be health-related.
With the Internet search results ordered by relevance, we identified US surveys among the first 500 hits. We revisited Web sites for recurring surveys to check for new data until November 9, 2016. Across both searches, we excluded satisfaction surveys, surveys that were not based on self-report (e.g., parents reporting about children), surveys that were not about humans (e.g., tobacco-free colleges, health plans or health insurance, LGBT curriculum content), surveys that were not based on national samples (e.g., surveys covering state, county, or cities only), and reviews and meta-analyses of multiple surveys. We further excluded surveys that did not specifically report transgender identities (e.g., surveys that reported counts for “another gender” or counts for a response option that combined “transgender” and “other”). We collected gender-identity data for each unique survey located through either the Internet search or search in traditional scientific databases from the original search result or reports on the survey’s Web site.
We completed an investigator-developed data extraction form for each eligible survey with data on survey year, population, sampling design, question(s) used to assess transgender identity, and the total sample size and number who self-reported as transgender. The first author extracted and double-checked all data.
We conducted random-effects meta-analyses based on the proportion of transgender individuals. Pooling of multiple survey samples, including multiple waves for recurring surveys, has been used before to estimate population size in gender and sexual minorities.22,23 Random-effects analysis is appropriate when study heterogeneity can be expected.24 We present plots and calculated the I2 statistic to estimate residual heterogeneity. This statistic indicates whether variation is more likely attributable to study heterogeneity or to chance.25 To assess potential bias we conducted subsample analysis and leave-one-out analysis to test whether single surveys had a disproportionally large effect. We used meta-regression to assess our hypothesis regarding a trend in estimated population size over time. We used the Knapp–Hartung method to control type-I error in meta-regressions.26 We used R version 3.2.2 (R Foundation, Vienna, Austria) for all statistical analyses.
RESULTS
We initially identified 65 surveys. After we excluded duplicates and surveys that did not meet our eligibility criteria, 5 surveys remained for analysis, spanning 2006 to 2016 (Figure 1). Accounting for data from multiple waves of recurring surveys (4 out of 5), our final analysis included 20 samples. Table 1 describes each of these samples in more detail. Among them, 6 samples (30%) were drawn from the general population and 14 (70%) from college and university students and adult inmates. It is worth mentioning that only the BRFSS samples and the 2016 wave of the National College Health Assessment (NCHA) collected data on gender identities not captured by the terms male, female, or transgender (e.g., genderqueer, gender-nonconforming), and that only the 2014 wave of the National Adult Tobacco Survey (NATS) and the 2016 NCHA inquired after sex assigned at birth.27–30
FIGURE 1—

Selection of Population-Based Surveys That Reported Transgender Identity: United States, 2006–2016
TABLE 1—
Characteristics of Samples in Surveys That Reported Transgender Identity Included in the Analysis: United States, 2006–2016
| Survey Name and Year | Sample Size | Self-Identified Transgender | Age Range, Years | Sample Description | Categorized as |
| Behavioral Risk Factor Surveillance System | |||||
| 2015a | 165 299 | 598 | ≥18 | General-population adults | Gender identity |
| 2014b | 154 062 | 575 | ≥18 | General-population adults | Gender identity |
| National Adult Tobacco Survey | |||||
| 2014c | 75 233 | 19 | ≥18 | General-population adults | Sexual orientation |
| 2013 | 60 221 | 17 | ≥18 | General-population adults | Sexual orientation |
| 2010 | 118 581 | 96 | ≥18 | General-population adults | Sexual orientation |
| National College Health Assessment | |||||
| 2016d | 94 376 | 1685 | 18–31 | Students of colleges and universities | Gender identity |
| 2015 | 93 034 | 416 | 18–31 | Students of colleges and universities | Gender identity |
| 2014 | 79 266 | 271 | 18–31 | Students of colleges and universities | Gender identity |
| 2013 | 123 078 | 299 | 18–31 | Students of colleges and universities | Gender identity |
| 2012 | 90 666 | 214 | 18–31 | Students of colleges and universities | Gender identity |
| 2011 | 105 781 | 226 | 18–31 | Students of colleges and universities | Gender identity |
| 2010 | 95 712 | 204 | 18–31 | Students of colleges and universities | Gender identity |
| 2009 | 87 101 | 131 | 18–31 | Students of colleges and universities | Gender identity |
| 2008 | 78 551 | 82 | 18–31 | Students of colleges and universities | Sexual orientation |
| 2007 | 69 965 | 75 | 18–31 | Students of colleges and universities | Sexual orientation |
| 2006 | 92 133 | 82 | 18–31 | Students of colleges and universities | Sexual orientation |
| National Health Interview Survey: 2013 | 33 784 | 3 | ≥18 | General-population adults | Sexual orientation |
| National Inmate Survey | |||||
| 2012 | 91 117 | 230 | ≥18 | Adult inmates in local jails and state and federal prisons | Gender identity |
| 2009 | 76 459 | 186 | ≥18 | Adult inmates in local jails and state and federal prisons | Gender identity |
| 2007 | 63 817 | 149 | ≥18 | Adult inmates in local jails and state and federal prisons | Gender identity |
154 endorsed “not male, female, or transgender.”
116 endorsed “not male, female, or transgender.”
233 with a different sex assigned at birth not included in self-identified transgender number.
1243 with a different sex assigned at birth not included in self-identified transgender number.
Survey Questions
Questions used to collect data on transgender identity varied greatly. A majority of surveys (n = 13 or 65%) asked about being transgender in the context of gender identity, in accordance with current understanding that transgender is a gender identity that is different from a person’s sex assigned at birth.1 These surveys included the 2014 and 2015 BRFSS,27,28 the NCHA starting with the 2009 wave of data collection,30–37 and the National Inmate Survey.38–42 The remaining surveys (n = 7 or 35%) offered “transgender” as a response option in the context of sexual-orientation questions. These surveys included the 2013 NHIS,43 the NATS,29,44,45 and the NCHA before the 2009 wave of data collection.46–48 Although transgender as sexual orientation does not reflect current understanding of transgender as a gender identity, and sexual orientation and gender identity are distinct phenomena,8,11,14 we conducted separate meta-analyses for “transgender” collected as gender identity and “transgender” as sexual orientation for the sake of comparison.
Questions that probed gender identity included “Do you consider yourself to be transgender?”; “Do you identify as transgender?”; “Are you male, female, or transgender?”; and “What is your gender?” In addition to male or female gender options, response options included “transgender”31,38 and “male-to-female,” “female-to-male,” and “gender-nonconforming.”27 Sexual-orientation questions with transgender response options included “Which of the following best describes you?”; “Which of the following best represents how you think of yourself?”; and “Do you consider yourself to be. . . ?” or “Do you think of yourself as. . .?” Response options included “transgender,”45 “transgendered,”46 and “You are transgender, transsexual, or gender variant.”29,43
Transgender Population Size
The estimated proportion of transgender individuals based on surveys that categorized transgender as gender identity was 0.39% (95% confidence interval [CI] = 0.16, 0.62; I2 = 99.8%; k = 13). In terms of overall sample proportion, college and university students represented the majority (58%), followed by general-population adults (24%) and adult inmates (18%). Leave-one-out analysis of these surveys showed a marked effect on the population estimate when the 2016 NCHA was left out (0.28%; 95% CI = 0.23, 0.32; I2 = 96.4%). Figure 2 shows a forest plot with the individual survey contributions. To assess the effect of including recurring surveys, we reanalyzed the data while including only the latest wave and leaving out the 2016 NCHA as a potential outlier. The estimated proportion of transgender individuals when we used this reduced data set spanning 2012 to 2015 was 0.35% (95% CI = 0.24, 0.46; I2 = 96.8%; k = 3). The 2014 NATS and the 2016 NCHA respectively reported that 0.31% and 1.3% of respondents had indicated a sex assigned at birth that differed from their current gender identity. These respondents were not included in our population-size estimates.29,30
FIGURE 2—

Proportion of Transgender Adults in Surveys That Categorized Transgender as a Gender Identity: United States, 2007–2016
Note. BRFSS = Behavioral Risk Factor Surveillance System; N = total sample size; NCHA = National College Health Assessment; NIS = National Inmate Survey.
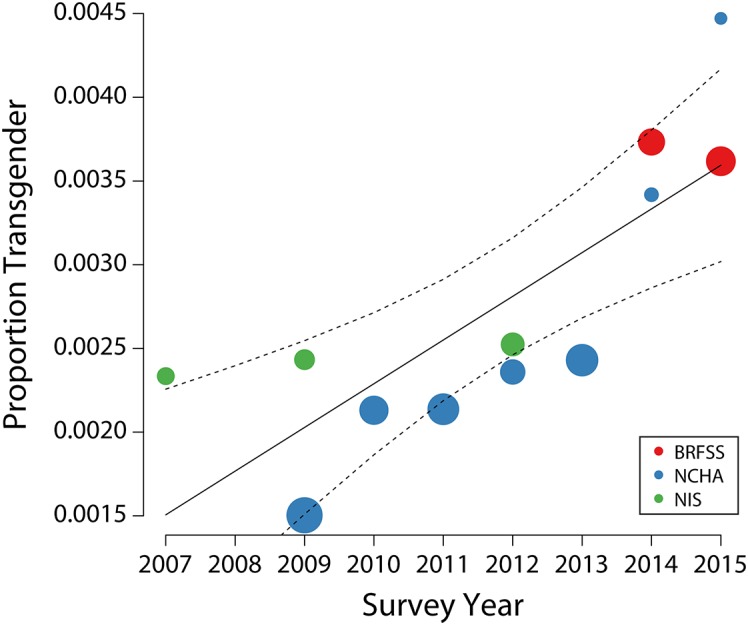
To test the hypothesis for changes over time, we conducted a meta-regression with the estimated proportion of transgender individuals as a dependent variable for surveys that categorized transgender as gender identity, but leaving out the 2016 NCHA as a potential outlier. A meta-regression model that included the year of the survey as predictor, centered with respect to 2007, explained 62.5% of model heterogeneity, with a significant effect for each unit increase in survey year (F = 17.122; df = 1,10; b = 0.026%; P = .002). A test for residual heterogeneity was also significant (QE = 99.687; df = 10; P < .001). Figure 3 visualizes the results of this meta-regression. Not surprisingly, the annual increase was considerably larger when we included 2016 NCHA (F = 4.944; df = 1,11; b = 0.086%; P = .048).
FIGURE 3—

Meta-Regression Showing the Proportion of Transgender Adults Against Survey Year, Based on Surveys That Categorized Transgender as Gender Identity: United States, 2007–2015
Note. BRFSS = Behavioral Risk Factor Surveillance System; NCHA = National College Health Assessment; NIS = National Inmate Survey. The 2016 NCHA was omitted as a potential outlier. Data points are scaled, with larger circles indicating smaller standard errors. The dashed lines indicate the 95% confidence interval about the regression line.
The estimated proportion of transgender individuals based on surveys that categorized transgender as sexual orientation was 0.06% (95% CI = 0.03, 0.09; I2 = 96.6%; k = 7). It should be noted that presenting transgender in the context of sexual orientation does not reflect our current understanding of what it means to be transgender. We include these data for comparison only and doing so should not be taken as validation that presenting transgender as a sexual orientation is in any way appropriate. Leave-one-out analysis showed no disproportionate effect of single surveys. A direct comparison of estimates showed that the proportion for transgender categorized as sexual orientation was significantly lower than the overall proportion for transgender categorized as gender identity (0.06% vs 0.28%; t = 7.317; P < .001, corrected for unequal variances).
DISCUSSION
Our meta-regression of US population-based surveys indicated a substantial annual increase in the number of transgender adults in the United States. As a consequence, meta-analyses that pool data across several years, including our own, will likely underestimate their numbers. A conservative estimate extrapolating our meta-regression results, while excluding the latest NCHA wave of data as a potential outlier, suggests that the proportion of transgender adults in the United States is 0.39%, or 390 per 100 000, and almost 1 million adults nationally. It should be noted that this estimate may be more indicative for younger adults and that national surveys in the near future may observe higher numbers of transgender people. We speculate that the observed annual increase is not an increase of the true population size, but the result of people feeling freer to report that they are or identify as transgender. This may result from societal changes, such as increased public visibility, awareness, and acceptance of transgender individuals.49 The fact that US society is more aware of transgender issues is also reflected in public interest in the search term “transgender,” which, according to Google Trends, has steadily increased since 2011. PubMed results for the number of publications found with the search term “transgender” show a similar phenomenon, with relatively small increases since 2005, but large increases in the number of publications since 2011.
Comparison of our population-size estimate with international numbers is not straightforward because, even within a single country, differences in social acceptance affect the number of individuals who are willing to self-report a transgender identity.50 This is why we based our analysis on US national samples only. Our estimate of 0.39% is not quite as high as the 1% that was posited on the basis of a qualitative review of international studies.51 However, this high number was supported by new data from a Dutch population sample aged 15 to 70 years, which found that 1.1% of men and 0.8% of women experienced a gender identity incongruent with their sex assigned at birth.52 Our estimate is also lower than the 0.6% reported by Flores et al., who applied a rigorous statistical technique to extrapolate data from a single survey administered in 19 states to a national level.21
“Transgender” as a Label
The label “transgender” is often used as an umbrella term, but does not fully capture the larger gender-nonconforming or gender-variant population, as surveys in our analysis illustrated. In both waves of the BRFSS included in our analysis, more than 20% of respondents endorsed “gender-nonconforming.” Other surveys that were not eligible for our analysis showed an even starker contrast between “transgender” and other nonbinary options. In a recent national nonprobability sample, the number of respondents who endorsed “genderqueer or gender nonconforming” was about 1.5 times the number who endorsed “transgender.”53 In the 2013 and 2015 Minnesota College Student Health Survey, twice as many respondents endorsed “genderqueer” or “another gender” than “transgender.”54,55
Other surveys that were not included in our analysis because they specifically recruited LGBT individuals also indicated a sizable proportion of respondents who endorsed other gender options. For example, 6th- to 12th-grade students in a national sample endorsed “genderqueer” more often than “transgender,” and the number who endorsed “another gender” was almost half of those who endorsed “transgender.”15 In a national survey of LGBT individuals in science, technology, engineering, and mathematics, again, more endorsed “genderqueer” than “transgender,” whereas the number who endorsed “androgynous” was slightly more than half of those who endorsed “transgender.”16
Also, not all transgender people identify with the term “transgender” (e.g., a transgender woman who identifies as female only).14,56 As such, surveys that include “transgender” as the only option other than male or female are likely to underestimate the population size under the transgender umbrella. The available evidence suggests that the size of the gender-nonconforming or gender-variant population may be twice as large as our best estimate for the transgender population size.
According to our analysis, surveys that considered transgender a sexual orientation resulted in at least a 4-fold underestimate of the number of transgender individuals. This underestimate should not come as a surprise, because transgender as sexual orientation does not reflect current understanding of transgender as gender identity.11,14 It is striking, therefore, that national surveys such as the NHIS and NATS, and state surveys such as the Illinois and Idaho BRFSS,57,58 until recent years, have categorized transgender as a sexual orientation rather than a gender identity. This practice misrepresents the number of transgender people in the United States and sustains misconceptions about what it means to be transgender. Of note, as of 2015, the NHIS no longer lists transgender as an option under sexual orientation.
Strengths and Limitations
Several considerations should be made when one is interpreting the results of our study. First, transgender people differ greatly and not all transgender individuals desire or have the resources to seek surgeries, hormone therapy, or change their name or sex designation on legal documents.1 We believe that our analysis based on self-reported data provides a more accurate estimate of the number of transgender individuals than estimates based on characteristics that represent subsamples of the transgender population only (e.g., only those who seek surgery).
Second, only about a quarter of the included surveys reported on the general population. More than half of the surveys on which our population-size estimate was based reported on younger adults (college and university students), and research has shown that individuals aged 18 to 24 years are more likely to identify as transgender.21 Also, the incarceration rate among transgender individuals is disproportionally high,4 especially among transgender women, and as such they may be overrepresented in samples drawn from the inmate population, which represented 20% of respondents in our analyses. Both aspects may lead to higher population size estimates and may not generalize to US adults as a whole.
Third, evidence from surveys that asked about sex assigned at birth suggested that the number of adults whose sex assigned at birth differs from their current gender identity could be as large as our current estimate of the transgender population size. As such, our analysis may not have captured all individuals who are considered transgender from a demographic perspective, but who do not identify explicitly with the term “transgender.” How the sum of these factors that may have affected our estimate ultimately add up is a complex question that perhaps can be answered when more accurate general population data become available. Also, survey errors with respect to data recording, although they are expected to be small, may have affected our estimate, especially because the base rate of the transgender population is small.
Lastly, our analysis indicated significant amounts of residual heterogeneity, which can potentially be explained by differences in respondent characteristics (e.g., general population, students, inmates) and the types of questions used to assess transgender identity.59 For example, the 2015 wave of the NCHA asked about respondents’ gender with 0.45% endorsing transgender, whereas respondents in the 2016 wave were asked whether they identified as transgender (1.8% responded yes). The small number of surveys in our analysis did not allow for testing more than 1 model predictor.
Conclusions
We aimed to estimate the current transgender population size in the United States. On the basis of our analysis of national probability samples, 390 per 100 000 adults are estimated to be transgender in 2016, but the evidence suggests that future surveys will likely observe higher numbers. Our analysis also found that surveys use a variety of questions to ask about transgender identity and may still miscategorize transgender as a sexual orientation. This categorization does not reflect current understanding of transgender as a gender identity, and we recommend using standardized questions to identify respondents with transgender and nonbinary gender identities in future population surveys. Best practices regarding questions that can be used for transgender-inclusive data collection have already been published.13
ACKNOWLEDGMENTS
This study was supported by the National Institute of Nursing Research grant T32 NR07088.
The authors gratefully acknowledge Madeline Deutsch, MD, MPH, at the University of California, San Francisco, for sharing her thoughts on an initial manuscript.
HUMAN PARTICIPANT PROTECTION
Institutional review board approval was not required because the study did not involve human participants.
Footnotes
See also Landers and Kapadia, p. 205.
REFERENCES
- 1.Coleman E, Bockting W, Botzer M et al. Standards of care for the health of transsexual, transgender, and gender-nonconforming people, version 7. Int J Transgenderism. 2012;13(4):165–232. [Google Scholar]
- 2.White Hughto JM, Reisner SL, Pachankis JE. Transgender stigma and health: a critical review of stigma determinants, mechanisms, and interventions. Soc Sci Med. 2015;147:222–231. doi: 10.1016/j.socscimed.2015.11.010. [DOI] [PMC free article] [PubMed] [Google Scholar]
- 3.Winter S, Diamond M, Green J et al. Transgender people: health at the margins of society. Lancet. 2016;388(10042):390–400. doi: 10.1016/S0140-6736(16)00683-8. [DOI] [PubMed] [Google Scholar]
- 4.Grant JM, Mottet LA, Tanis J, Harrison J, Herman JL, Keisling M. Injustice at Every Turn: A Report of the National Transgender Discrimination Survey. Washington, DC: National Center for Transgender Equality and National Gay and Lesbian Task Force; 2011. [Google Scholar]
- 5.Bauer GR, Hammond R, Travers R, Kaay M, Hohenadel KM, Boyce M. “I don’t think this is theoretical; this is our lives”: how erasure impacts health care for transgender people. J Assoc Nurses AIDS Care. 2009;20(5):348–361. doi: 10.1016/j.jana.2009.07.004. [DOI] [PubMed] [Google Scholar]
- 6.Haas AP, Eliason M, Mays VM et al. Suicide and suicide risk in lesbian, gay, bisexual, and transgender populations: review and recommendations. J Homosex. 2011;58(1):10–51. doi: 10.1080/00918369.2011.534038. [DOI] [PMC free article] [PubMed] [Google Scholar]
- 7.American Psychological Association. Guidelines for psychological practice with transgender and gender nonconforming people. Am Psychol. 2015;70(9):832–864. doi: 10.1037/a0039906. [DOI] [PubMed] [Google Scholar]
- 8.Drescher J. Queer diagnoses: parallels and contrasts in the history of homosexuality, gender variance, and the Diagnostic and Statistical Manual. Arch Sex Behav. 2010;39(2):427–460. doi: 10.1007/s10508-009-9531-5. [DOI] [PubMed] [Google Scholar]
- 9.Drescher J. Queer diagnoses revisited: the past and future of homosexuality and gender diagnoses in DSM and. ICD. Int Rev Psychiatry. 2015;27(5):386–395. doi: 10.3109/09540261.2015.1053847. [DOI] [PubMed] [Google Scholar]
- 10.American Psychological Association. Guidelines for psychological practice with lesbian, gay, and bisexual clients. Am Psychol. 2012;67(1):10–42. doi: 10.1037/a0024659. [DOI] [PubMed] [Google Scholar]
- 11. Report of the APA Task Force on Gender Identity and Gender Variance. Washington, DC: American Psychological Association; 2009. Available at: http://www.apa.org/pi/lgbt/resources/policy/gender-identity-report.pdf. Accessed July 21, 2016.
- 12.Tate CC, Ledbetter JN, Youssef CP. A two-question method for assessing gender categories in the social and medical sciences. J Sex Res. 2013;50(8):767–776. doi: 10.1080/00224499.2012.690110. [DOI] [PubMed] [Google Scholar]
- 13.The GenIUSS Group. Best Practices for Asking Questions to Identify Transgender and Other Gender Minority Respondents on Population-Based Surveys. 2014. Available at: http://williamsinstitute.law.ucla.edu/wp-content/uploads/geniuss-report-sep-2014.pdf. Accessed August 13, 2015.
- 14.Meier SC, Labuski CM. The demographics of the transgender population. In: Baumle AK, editor. International Handbook on the Demography of Sexuality. Vol 5. International Handbooks of Population. Dordrecht, Netherlands; Springer Netherlands: 2013. pp. 289–330. [Google Scholar]
- 15.Kosciw JG, Greytak EA, Palmer NA, Boesen MJ. The 2013 National School Climate Survey: the experiences of lesbian, gay, bisexual and transgender youth in our nation’s schools. 2014. Available at: http://www.glsen.org/article/2013-national-school-climate-survey. Accessed February 19, 2016.
- 16.Yoder JB, Mattheis A. Queer in STEM: workplace experiences reported in a national survey of LGBTQA individuals in science, technology, engineering, and mathematics careers. J Homosex. 2016;63(1):1–27. doi: 10.1080/00918369.2015.1078632. [DOI] [PubMed] [Google Scholar]
- 17.Mathy RM. Transgender identity and suicidality in a nonclinical sample: sexual orientation, psychiatric history, and compulsive behaviors. J Psychol Human Sex. 2002;14(4):47–65. [Google Scholar]
- 18.Deutsch MB. Making it count: improving estimates of the size of transgender and gender nonconforming populations. LGBT Health. 2016;3(3):181–185. doi: 10.1089/lgbt.2016.0013. [DOI] [PubMed] [Google Scholar]
- 19.Conron KJ, Scott G, Stowell GS, Landers SJ. Transgender health in Massachusetts: results from a household probability sample of adults. Am J Public Health. 2012;102(1):118–122. doi: 10.2105/AJPH.2011.300315. [DOI] [PMC free article] [PubMed] [Google Scholar]
- 20.Almeida J, Johnson RM, Corliss HL, Molnar BE, Azrael D. Emotional distress among LGBT youth: the influence of perceived discrimination based on sexual orientation. J Youth Adolesc. 2009;38(7):1001–1014. doi: 10.1007/s10964-009-9397-9. [DOI] [PMC free article] [PubMed] [Google Scholar]
- 21.Flores AR, Herman JL, Gates GJ, Brown TNT. How many adults identify as transgender in the United States? 2016. Available at: http://williamsinstitute.law.ucla.edu/wp-content/uploads/How-Many-Adults-Identify-as-Transgender-in-the-United-States.pdf. Accessed November 8, 2016.
- 22.Gates GJ. How many people are lesbian, gay, bisexual, and transgender? 2011. Available at: http://williamsinstitute.law.ucla.edu/wp-content/uploads/Gates-How-Many-People-LGBT-Apr-2011.pdf. Accessed September 11, 2015.
- 23.Semlyen J, King M, Varney J, Hagger-Johnson G. Sexual orientation and symptoms of common mental disorder or low wellbeing: combined meta-analysis of 12 UK population health surveys. BMC Psychiatry. 2016;16(67):1–9. doi: 10.1186/s12888-016-0767-z. [DOI] [PMC free article] [PubMed] [Google Scholar]
- 24.DerSimonian R, Laird N. Meta-analysis in clinical trials. Control Clin Trials. 1986;7(3):177–188. doi: 10.1016/0197-2456(86)90046-2. [DOI] [PubMed] [Google Scholar]
- 25.Higgins JPT, Thompson SG, Deeks JJ, Altman DG. Measuring inconsistency in meta-analyses. BMJ. 2003;327(7414):557–560. doi: 10.1136/bmj.327.7414.557. [DOI] [PMC free article] [PubMed] [Google Scholar]
- 26.Viechtbauer W, López-López JA, Sánchez-Meca J, Marín-Martínez F. A comparison of procedures to test for moderators in mixed-effects meta-regression models. Psychol Methods. 2015;20(3):360–374. doi: 10.1037/met0000023. [DOI] [PubMed] [Google Scholar]
- 27.Centers for Disease Control and Prevention. Behavioral Risk Factor Surveillance System 2014 Codebook Report. Land-Line and Cell-Phone Data. 2015. Available at: http://www.cdc.gov/brfss/annual_data/2014/pdf/codebook14_llcp.pdf. Accessed February 16, 2016.
- 28.Centers for Disease Control and Prevention. Behavioral Risk Factor Surveillance System 2015 Codebook Report. Land-Line and Cell-Phone Data. 2016. Available at: http://www.cdc.gov/brfss/annual_data/2015/pdf/codebook15_llcp.pdf. Accessed November 7, 2016.
- 29.Centers for Disease Control and Prevention. National Adult Tobacco Survey. 2013–2014 dataset in SAS. 2014. Available at: http://www.cdc.gov/tobacco/data_statistics/surveys/nats/zip_files/2013-2014-sas.zip. Accessed November 9, 2016.
- 30.American College Health Association. National College Health Assessment. Spring 2016 reference group data report. 2016. Available at: http://www.acha-ncha.org/docs/NCHA-II%20SPRING%202016%20US%20REFERENCE%20GROUP%20DATA%20REPORT.pdf. Accessed November 7, 2016.
- 31.American College Health Association. National College Health Assessment. Reference group data report spring 2009. 2009. Available at: http://www.acha-ncha.org/docs/ACHA-NCHA_Reference_Group_Report_Spring2009.pdf. Accessed February 17, 2016.
- 32.American College Health Association. National College Health Assessment. Reference group data report spring 2010. 2010. Available at: http://www.acha-ncha.org/docs/ACHA-NCHA-II_ReferenceGroup_DataReport_Spring2010.pdf. Accessed February 17, 2016.
- 33.American College Health Association. National College Health Assessment. Reference group data report spring 2011. 2011. Available at: http://www.acha-ncha.org/docs/ACHA-NCHA-II_ReferenceGroup_DataReport_Spring2011.pdf. Accessed February 17, 2016.
- 34.American College Health Association. National College Health Assessment. Reference group data report spring 2012. 2012. Available at: http://www.acha-ncha.org/docs/ACHA-NCHA-II_ReferenceGroup_DataReport_Spring2012.pdf. Accessed February 17, 2016.
- 35.American College Health Association. National College Health Assessment. Reference group data report spring 2013. 2013. Available at: http://www.acha-ncha.org/docs/ACHA-NCHA-II_ReferenceGroup_DataReport_Spring2013.pdf. Accessed February 17, 2016.
- 36.American College Health Association. National College Health Assessment. Spring 2014 reference group data report. 2014. Available at: http://www.acha-ncha.org/docs/ACHA-NCHA-II_ReferenceGroup_DataReport_Spring2014.pdf. Accessed February 17, 2016.
- 37.American College Health Association. National College Health Assessment. Spring 2015 reference group data report. 2015. Available at: http://www.acha-ncha.org/docs/NCHA-II WEB_SPRING_2015_REFERENCE_GROUP_DATA_REPORT.pdf. Accessed January 5, 2016.
- 38.Beck AJ. Sexual victimization in prisons and jails reported by inmates, 2011–12 supplemental tables: prevalence of sexual victimization among transgender adult inmates. 2014. Available at: http://www.bjs.gov/content/pub/pdf/svpjri1112_st.pdf. Accessed February 17, 2016.
- 39.Beck AJ, Harrison PM, Berzofsky M, Caspar R, Krebs C. Sexual victimization in prisons and jails reported by inmates, 2008–09. National Inmate Survey, 2008–09. 2010. Available at: http://www.bjs.gov/content/pub/pdf/svpjri0809.pdf. Accessed February 19, 2016.
- 40.Beck AJ, Harrison PM. Sexual victimization in state and federal prisons reported by inmates, 2007. 2007. Available at: http://www.bjs.gov/content/pub/pdf/svsfpri07.pdf. Accessed February 19, 2016.
- 41.Beck AJ, Harrison PM. Sexual victimization in local jails reported by inmates, 2007. 2008. Available at: http://www.bjs.gov/content/pub/pdf/svljri07.pdf. Accessed February 19, 2016.
- 42.Beck AJ, Berzofsky M, Caspar R, Krebs C. Sexual victimization in prisons and jails reported by inmates, 2011–12. National Inmate Survey, 2011–12. 2013. Available at: http://www.bjs.gov/content/pub/pdf/svpjri1112.pdf. Accessed February 17, 2016.
- 43.Dahlhamer JM, Galinsky AM, Joestl SS, Ward BW. Sexual orientation in the 2013 National Health Interview Survey: a quality assessment. Vital Health Stat 2. 2014;169:1–32. [PubMed] [Google Scholar]
- 44.Centers for Disease Control and Prevention. National Adult Tobacco Survey. 2012–2013 dataset in SAS. 2013. Available at: http://www.cdc.gov/tobacco/data_statistics/surveys/nats/zip_files/2012-2013-NATS-Format.zip. Accessed June 20, 2016.
- 45.Centers for Disease Control and Prevention. National Adult Tobacco Survey. 2009–2010 dataset in SAS. 2010. Available at: http://www.cdc.gov/tobacco/data_statistics/surveys/nats/zip_files/2009-2010-sas.zip. Accessed June 20, 2016.
- 46.American College Health Association. National College Health Assessment. Reference group data report spring 2006. 2006. Available at: http://www.acha-ncha.org/docs/ACHA-NCHA_Reference_Group_Report_Spring2006.pdf. Accessed August 13, 2015.
- 47.American College Health Association. National College Health Assessment. Reference group data report spring 2007. 2007. Available at: http://www.acha-ncha.org/docs/ACHA-NCHA_Reference_Group_Report_Spring2007.pdf. Accessed February 17, 2016.
- 48.American College Health Association. National College Health Assessment. Reference group data report spring 2008. 2008. Available at: http://www.acha-ncha.org/docs/ACHA-NCHA_Reference_Group_Report_Sprin2008.pdf. Accessed February 17, 2016.
- 49.MacCarthy S, Reisner SL, Nunn A, Perez-Brumer A, Operario D. The time is now: attention increases to transgender health in the United States but scientific knowledge gaps remain. LGBT Health. 2015;2(4):287–291. doi: 10.1089/lgbt.2014.0073. [DOI] [PMC free article] [PubMed] [Google Scholar]
- 50.De Cuypere G, Van Hemelrijck M, Michel A et al. Prevalence and demography of transsexualism in Belgium. Eur Psychiatry. 2007;22(3):137–141. doi: 10.1016/j.eurpsy.2006.10.002. [DOI] [PubMed] [Google Scholar]
- 51.Olyslager F, Conway L. On the calculation of the prevalence of transsexualism. Oral presentation at: WPATH 20th International Symposium; September 7, 2007; Chicago, IL. Available at: http://ai.eecs.umich.edu/people/conway/TS/Prevalence/Reports/Prevalence%20of%20Transsexualism.pdf. Accessed September 10, 2015.
- 52.Kuyper L, Wijsen C. Gender identities and gender dysphoria in the Netherlands. Arch Sex Behav. 2014;43(2):377–385. doi: 10.1007/s10508-013-0140-y. [DOI] [PubMed] [Google Scholar]
- 53.Sell R, Goldberg S, Conron K. The utility of an online convenience panel for reaching rare and dispersed populations. PLoS One. 2015;10(12):e0144011. doi: 10.1371/journal.pone.0144011. [DOI] [PMC free article] [PubMed] [Google Scholar]
- 54.Boynton Health Service, University of Minnesota. 2015 College Student Health Survey Report. Health and health-related behaviors. Minnesota postsecondary students. 2015. Available at: http://www.bhs.umn.edu/surveys/survey-results/2015/MNPostsecondaryStudents_CSHSReport_2015.pdf. Accessed June 10, 2016.
- 55.Boynton Health Service, University of Minnesota. 2013 College Student Health Survey Report. Health and health-related behaviors. Minnesota postsecondary students. 2013. Available at: http://www.bhs.umn.edu/surveys/survey-results/2013/MNPostsecondary_CSHSReport_2013.pdf. Accessed June 10, 2016.
- 56.Schilt K, Bratter J. From multiracial to transgender? Assessing attitudes toward expanding gender options on the US Census. Transgender Stud Q. 2015;2(1):77–100. [Google Scholar]
- 57.Illinois Department of Public Health. Illinois Behavioral Risk Factor Surveillance System. Illinois and strata area prevalence data. 2016. Available at: http://app.idph.state.il.us/brfss/statedata.asp. Accessed June 13, 2016.
- 58.Bureau of Vital Records and Health Statistics, Division of Public Health, Idaho Department of Health and Welfare. Idaho Behavioral Risk Factors. Results from the 2012 Behavioral Risk Factor Surveillance System. 2014. Available at: http://www.healthandwelfare.idaho.gov/Portals/0/Users/074/54/1354/Idaho_BRFSS_Annual_Report_2012.pdf. Accessed June 18, 2016.
- 59.Borenstein M, Hedges LV, Higgins JPT, Rothstein HR. Introduction to Meta-Analysis. Chichester, England: John Wiley and Sons; 2009. Meta-regression; pp. 187–203. [Google Scholar]