

Summary
Objectives
To understand the attitudes and perceptions of ophthalmologists toward an electronic health record (EHR) system, before and after its clinical implementation.
Methods
Ophthalmologists at a single large academic ophthalmology department were surveyed longitudinally before and after implementation of a new EHR system. The survey measured ophthalmologists’ attitudes toward implementation of a new EHR. Questions focused on satisfaction, efficiency, and documentation. All attending physicians (between 56 and 61 at various time points) in the University of Michigan Department of Ophthalmology and Visual Sciences were surveyed. We plotted positive responses to survey questions and assessed whether perceptions followed a J-curve with an initial decrease followed by an increase surpassing pre-implementation levels.
Results
Survey responses were received from 32 (52%) ophthalmologists pre-implementation, and 28 (46%) at 3 months, 35 (57%) at 7 months, 40 (71%) at 13 months and 39 (67%) at 24 months post-implementation. After EHR implementation respondents were more likely to express concerns about their ability to create high-quality documentation (p<0.01) and the impact of an electronic health record on meaningful patient interaction (p<0.01). Physicians did not report a significant change in the amount of time spent documenting outside of regular clinical work hours (p=0.54) or on their clinic efficiency and workflow (p=0.97). There was no significant change in overall job satisfaction during the study period (p=0.69). We did not observe a J-curve for any of the survey responses analyzed.
Conclusions
As ophthalmology practices continue to transition to EHRs, adapting them to their specific culture and needs is important to maintain efficiency and user satisfaction. This study identifies areas of concern to ophthalmologists that may be addressed through education of physicians and customization of software as other practices move forward with EHR implementation.
Keywords: Ophthalmology, implementation and deployment, electronic health records and systems, testing and evaluation, clinical documentation and communications
1. Background and Significance
The use of electronic health records (EHRs) has increased dramatically in the US over the past fifteen years. In 2001, just 18.2% of office-based physicians reported having an EHR system, while by 2013 that number had increased to 78.4% [1]. The adoption of EHRs has been hastened in recent years by federal legislation. In 2009, the Health Information Technology for Economic and Clinic Health Act (HITECH) authorized incentive payments through government payers for physicians and hospitals who adopted certified EHRs and demonstrated “meaningful use” [2, 3]. Meaningful use requirements continue to evolve from an initial goal of data capture in Stage 1, to a focus on improving processes in Stage 2, and ultimately improving patient outcomes in Stage 3 [4, 5].
In 2006 the American Academy of Ophthalmology conducted a survey on the adoption of EHRs among its members [6]. At that time 12% of ophthalmologists reported having an EHR in place, while 49% planned to have one in place within two years; however, a repeat survey in 2013 revealed that only 32% of ophthalmology practices had completed implementation [7]. By comparison, across all medical specialties more than 75% of office-based physicians in the United States had adopted either a basic or complete EHR by 2013 [8]. Chiang and colleagues have suggested that the relatively slow adoption of EHRs in ophthalmology may be related to the unique needs of the specialty [9]. For example, many of the systems designed to satisfy meaningful use are large comprehensive EHRs not specifically tailored to the unique clinical needs of ophthalmology such as documentation of clinical drawings; review of images; and recording of ophthalmic vital signs such as visual acuity, intraocular pressure and visual field indices. Specifically, clinical drawings are essential in ophthalmology where the details of corneal, retinal and optic nerve findings may be more effectively documented with drawings than with textual descriptions.
Previous research on EHRs in ophthalmology has examined their impact on workflow [10, 11, 12], clinical documentation [10–14], billing [14, 15], and productivity [12, 15, 16, 17]. A prior cross-sectional study investigated the attitudes of ophthalmologists at varied stages of EHR implementation and with different EHR systems [18]. However, our study addresses whether the perceptions of ophthalmologists changed over time after EHR implementation. We tested the hypothesis that during the course of EHR implementation, ophthalmologists’ perceptions would follow a ‘J-curve’ pattern, in which measures would initially fall but then improve to exceed their pre-implementation levels. This pattern, which has been described elsewhere [19], would denote successful EHR adoption, even if perceptions suffered initially.
2. Objectives
We sought to understand and describe the perceptions of ophthalmologists over the course of EHR implementation in an academic department of Ophthalmology.
3. Methods
3.1 Description of Study Institution and EHR System
The study described herein was similar to a study conducted at the same institution that included only non-surgical specialties, reported elsewhere [20]. However, several characteristics distinguish the current study from its counterpart. Such characteristics include: (1) surveying only ophthalmologists; (2) the unique documentation requirements of ophthalmology [9]; and (3) while other specialties had prior experience with a homegrown EHR , ophthalmology transitioned to EHR from paper documentation. These specific issues are described in further detail below.
The Department of Ophthalmology and Visual Sciences at the University of Michigan is a large academic practice that in 2015 had more than 140,000 clinic visits and 7,000 operating room (OR) cases. The Department used paper charts for documentation until the University-wide adoption of the present EHR, EpicCare Ambulatory (Epic Systems Corporation; Verona, WI), in 2012. Prior to 2012, nearly all other departments in the University used an EHR developed in-house called Care-Web; however ophthalmologists did not create outpatient documentation using this system and only used CareWeb to review labs, studies and documentation from other departments in the medical center. In 2012, EpicCare Ambulatory, locally renamed MiChart, was implemented throughout the University of Michigan Health System. Since adoption of MiChart, all ophthalmology patient documentation has been created using this EHR. With MiChart, ophthalmologists document patient visits using a computer (sometimes with the help of scribes) rather than using the previous system of paper notes.
3.2 Survey of Ophthalmologists
Each of the attending ophthalmologists on the faculty at the University of Michigan received a unique survey link to a 26 question Likert scale pre-implementation survey (▶ Supplementary Table 1) and a 30 question follow-up survey (▶ Supplementary Table 2) at each of the four follow-up time points. Since some faculty left the department and others joined during the study, the number of faculty surveyed at each time point was variable. Physicians were surveyed one month prior to MiChart implementation and again at three, seven, thirteen and twenty-four months after implementation of the EHR. The survey focused on physician satisfaction, productivity, documentation and workflow. A similar survey was also administered to physicians in the Departments of Family Medicine, Internal Medicine and Pediatrics at the University of Michigan and results of these surveys have been published elsewhere [20]. The University of Michigan Institutional Review Board determined that this study was exempt from further review. This research adhered to the tenets of the World Medical Association Declaration of Helsinki on Ethical Principles for Medical Research Involving Human Subjects.
3.2 Data Analysis
All statistical analyses were performed using SAS software, version 9.4 (SAS Institute; Cary, NC). All identifying information was removed from data prior to analyses. Chi-square and Fisher exact tests were used to compare response data over time. We used the two positive response categories for each question as the numerator when calculating percentages of positive responses, and we plotted these percentages over time. Missing data were not included in the calculation of percentages of comparison tests. Between any two survey time points we were able to detect about a 0.65 point change in the 5 point Likert scale. Curve shapes were illustrated and described in a previous publication [20]. To statistically determine curve shape we first performed an overall Chi-square test on response data from all time points in a single contingency table. If p>0.05 the curve was determined to be a flat line. We then examined questions for which the overall Chi-square test returned a p-value ≤0.05. For each of these we performed pairwise Chi-squared tests comparing pre-implementation responses to post-implementation responses at each time point and adjusting for multiple comparisons using the Bonferoni method. If some or all of the pairwise comparisons were significant, we examined the trend in curve shape over time to determine if there was an increase from baseline (“inverted L curve,” “hockey stick curve,” or “J curve”), a return to baseline (“inverted U curve” or “U curve”) or a decrease from baseline (“inverted J curve,” “inverted hockey stick curve,” or “L curve”). For all analyses, p 0.05 was considered statistically significant.
4. Results
▶ Table 1 summarizes demographics and response rates. The number of faculty surveyed varied at each time point from 56 to 62 ophthalmologists; between 46% and 71% completed the survey at each time point. There was no significant difference in the gender (p=0.93) or age (p=0.95) distribution of respondents at the various time points. Likewise, respondents and non-respondents did not differ by gender (p=0.22) or age (p=0.93).
Table 1.
MiChart implementation survey respondents. This table presents information on the gender and age of survey respondents, as well as number (%) of surveys that were returned at each time point.
| Survey Time | |||||||
|---|---|---|---|---|---|---|---|
| 1 Month Pre-Implementation | 3 Month Post-Implementation | 7 Month Post-Implementation | 13 Month Post-Implementation | 2 Year Post-Implementation | p-value a | ||
| Number of Surveys Completed | 32(52) | 28(46) | 35(57) | 40(71) | 39(67) | ||
| Gender | Male | 20 (62.5) | 17 (60.7) | 21 (60.0) | 22 (55.0) | 21 (53.8) | 0.93 b |
| Female | 12 (37.5) | 11 (39.3) | 14 (40.0) | 18 (45.0) | 18 (46.2) | ||
| Age | 30-39 | 10 (31.3) | 10 (35.7) | 10 (28.6) | 15 (37.5) | 14 (35.9) | 0.95 c |
| 40-49 | 9 (28.1) | 6 (21.4) | 12 (34.3) | 11 (27.5) | 12 (30.8) | ||
| 50-59 | 5 (15.6) | 5 (17.9) | 7 (20.0) | 9 (22.5) | 9 (23.1) | ||
| 60-69 | 5 (15.6) | 5 (17.9) | 5 (14.3) | 5 (12.5) | 3 (7.7) | ||
| 70-79 | 3 (9.4) | 2 (7.1) | 1 (2.9) | 0 (0.0) | 1 (2.6) | ||
a All comparison tests are performed on only the survey times where that question was asked
b Chi-square test
c Fisher exact test
Key results from the surveys are summarized in ▶ Table 2 (complete survey results are presented in ▶ Supplementary Table 3). Line graphs depicting the trend in positive responses over time are shown in ▶ Table 3. The amount of time spent entering data into charts on workday evenings/nights did not significantly change over the course of the study (p=0.54; flat line), non-clinical/administrative days (p=0.40; flat line), or days off (p=0.51; flat line). After EHR implementation ophthalmologists did not report any significant change in their efficiency and workflow (p=0.97) and this was illustrated by a flat line. There was not a statistically significant change in perceptions of patient safety related to the health record system (p=0.43; flat line).
Table 2.
MiChart implementation survey responses from a group of 58 ophthalmologists, N (column %). Full survey response data to key questions are presented.
| Survey Time | |||||||
|---|---|---|---|---|---|---|---|
| 1 Month Pre-Im- plemen- tation | 3 Month Post-Im- plemen- tation | 7 Month Post-Im- plemen- tation | 13 Month Post-Im- plemen- tation | 24 Months Post-Im- plemen- tation | p-value a | ||
| Question | Responses | ||||||
| With what frequency do you enter data into record on workday evenings/ nights? | 1 – Never | 9 (28.1) | 7 (25.9) | 7 (20.0) | 6 (15.0) | 7 (17.9) | 0.54 b |
| 2 | 5 (15.6) | 4 (14.8) | 7 (20.0) | 10 (25.0) | 12 (30.8) | ||
| 3 | 8 (25.0) | 7 (25.9) | 8 (22.9) | 10 (25.0) | 7 (17.9) | ||
| 4 | 9 (28.1) | 6 (22.2) | 9 (25.7) | 7 (17.5) | 4 (10.3) | ||
| 5 – All of the time | 1 (3.1) | 3 (11.1) | 4 (11.4) | 7 (17.5) | 9 (23.1) | ||
| Non-Response | 30 | 34 | 26 | 16 | 19 | ||
| With what frequency do you enter data into record on nonclinical/ administrative days? | 1 – Never | 13 (40.6) | 9 (33.3) | 9 (26.5) | 8 (20.5) | 9 (23.1) | 0.40 b |
| 2 | 5 (15.6) | 2 (7.4) | 8 (23.5) | 11 (28.2) | 6 (15.4) | ||
| 3 | 8 (25.0) | 3 (11.1) | 5 (14.7) | 7 (17.9) | 10 (25.6) | ||
| 4 | 5 (15.6) | 9 (33.3) | 8 (23.5) | 7 (17.9) | 7 (17.9) | ||
| 5 – All of the time | 1 (3.1) | 4 (14.8) | 4 (11.8) | 6 (15.4) | 7 (17.9) | ||
| Non-Response | 30 | 34 | 27 | 17 | 19 | ||
| With what frequency do you enter data into record on days off? | 1 – Never | 18 (56.3) | 10 (35.7) | 9 (25.7) | 13 (32.5) | 15 (38.5) | 0.51 c |
| 2 | 5 (15.6) | 5 (17.9) | 10 (28.6) | 12 (30.0) | 9 (23.1) | ||
| 3 | 6 (18.8) | 5 (17.9) | 9 (25.7) | 10 (25.0) | 10 (25.6) | ||
| 4 | 2 (6.3) | 7 (25.0) | 5 (14.3) | 2 (5.0) | 3 (7.7) | ||
| 5 – All of the time | 1 (3.1) | 1 (3.6) | 2 (5.7) | 3 (7.5) | 2 (5.1) | ||
| Non-Response | 30 | 33 | 26 | 16 | 19 | ||
| The current system enables me to create high quality documentation. | 1 – Disagree strongly | 0 (0.0) | 7 (25.0) | 10 (28.6) | 7 (17.5) | 7 (17.9) | <0.01 c |
| 2 | 1 (3.1) | 6 (21.4) | 5 (14.3) | 4 (10.0) | 5 (12.8) | ||
| 3 | 2 (6.3) | 4 (14.3) | 4 (11.4) | 7 (17.5) | 11 (28.2) | ||
| 4 | 10 (31.3) | 7 (25.0) | 10 (28.6) | 16 (40.0) | 10 (25.6) | ||
| 5 – Agree strongly | 19 (59.4) | 4 (14.3) | 6 (17.1) | 6 (15.0) | 6 (15.4) | ||
| Non-Reponse | 30 | 33 | 26 | 16 | 19 | ||
| The current system supports meaningful interaction with patients. | 1 – Disagree strongly | 0 (0.0) | 9 (32.1) | 16 (45.7) | 11 (27.5) | 15 (38.5) | < 0.01 c |
| 2 | 0 (0.0) | 11 (39.3) | 8 (22.9) | 18 (45.0) | 11 (28.2) | ||
| 3 | 2 (6.3) | 4 (14.3) | 7 (20.0) | 7 (17.5) | 8 (20.5) | ||
| 4 | 7 (21.9) | 3 (10.7) | 2 (5.7) | 4 (10.0) | 4 (10.3) | ||
| 5 – Agree strongly | 23 (71.9) | 1 (3.6) | 2 (5.7) | 0 (0.0) | 1 (2.6) | ||
| Non-Response | 30 | 33 | 26 | 16 | 19 | ||
| The current system has improved patient safety. | 1 – Disagree strongly | 1 (3.1) | 7 (25.0) | 7 (20.0) | 7 (17.5) | 6 (15.4) | 0.43 c |
| 2 | 7 (21.9) | 5 (17.9) | 5 (14.3) | 4 (10.0) | 6 (15.4) | ||
| 3 | 14 (43.8) | 6 (21.4) | 11 (31.4) | 10 (25.0) | 11 (28.2) | ||
| 4 | 6 (18.8) | 8 (28.6) | 7 (20.0) | 13 (32.5) | 14 (35.9) | ||
| 5 – Agree strongly | 4 (12.5) | 2 (7.1) | 5 (14.3) | 6 (15.0) | 2 (5.1) | ||
| Non-Response | 30 | 33 | 26 | 16 | 19 | ||
| Rate the impact the current system has had on your efficiency and workflow, compared to the previous system. | 1 – Much less efficient | 4 (14.3) | 8 (28.6) | 11 (31.4) | 11 (27.5) | 9 (23.1) | 0.97 b |
| 2 | 8 (28.6) | 10 (35.7) | 13 (37.1) | 13 (32.5) | 11 (28.2) | ||
| 3 | 8 (28.6) | 4 (14.3) | 6 (17.1) | 7 (17.5) | 8 (20.5) | ||
| 4 | 7 (25.0) | 5 (17.9) | 4 (11.4) | 7 (17.5) | 9 (23.1) | ||
| 5 – Much more efficient | 1 (3.6) | 1 (3.6) | 1 (2.9) | 2 (5.0) | 2 (5.1) | ||
| Non-Response | 34 | 33 | 26 | 16 | 19 | ||
| MiChart will allow me to provide better care for my patients. | 1 – Disagree strongly | 5 (15.6) | 4 (14.3) | 7 (20.0) | 8 (20.0) | 9 (23.1) | 0.50 b |
| 2 | 4 (12.5) | 10 (35.7) | 7 (20.0) | 4 (10.0) | 10 (25.6) | ||
| 3 | 10 (31.3) | 6 (21.4) | 11 (31.4) | 17 (42.5) | 9 (23.1) | ||
| 4 | 9 (28.1) | 5 (17.9) | 8 (22.9) | 9 (22.5) | 10 (25.6) | ||
| 5 – Agree strongly | 4 (12.5) | 3 (10.7) | 2 (5.7) | 2 (5.0) | 1 (2.6) | ||
| Non-Response | 30 | 33 | 26 | 16 | 19 | ||
| Rate your current overall job satisfaction. | 1 – Very unsatisfied | 0 (0.0) | 2 (7.1) | 4 (11.4) | 2 (5.0) | 4 (10.3) | 0.69 c |
| 2 | 2 (6.3) | 3 (10.7) | 4 (11.4) | 6 (15.0) | 7 (17.9) | ||
| 3 | 3 (9.4) | 2 (7.1) | 3 (8.6) | 8 (20.0) | 3 (7.7) | ||
| 4 | 9 (28.1) | 9 (32.1) | 10 (28.6) | 8 (20.0) | 11 (28.2) | ||
| 5 – Very satisfied | 18 (56.3) | 12 (42.9) | 14 (40.0) | 16 (40.0) | 14 (35.9) | ||
| Non-Response | 30 | 33 | 26 | 16 | 19 | ||
| Estimate the impact the current system has had on your job satisfaction. | 1 – Large negative impact | 1 (3.1) | 5 (17.9) | 6 (17.1) | 7 (17.5) | 7 (17.9) | 0.01 c |
| 2 | 4 (12.5) | 13 (46.4) | 13 (37.1) | 13 (32.5) | 16 (41.0) | ||
| 3 | 18 (56.3) | 4 (14.3) | 12 (34.3) | 16 (40.0) | 9 (23.1) | ||
| 4 | 8 (25.0) | 4 (14.3) | 3 (8.6) | 3 (7.5) | 7 (17.9) | ||
| 5 – Large positive impact | 1 (3.1) | 2 (7.1) | 1 (2.9) | 1 (2.5) | 0 (0.0) | ||
| Non-Response | 30 | 33 | 26 | 16 | 19 | ||
| Would you like to keep the current system or switch back to the previous one? | 1 – Definitely keep | 6 (18.8) | 5 (17.9) | 5 (14.3) | 10 (25.0) | 10 (25.6) | 0.11 c |
| 2 | 6 (18.8) | 9 (32.1) | 16 (45.7) | 15 (37.5) | 11 (28.2) | ||
| 3 | 2 (6.3) | 6 (21.4) | 3 (8.6) | 7 (17.5) | 9 (23.1) | ||
| 4 | 13 (40.6) | 5 (17.9) | 4 (11.4) | 4 (10.0) | 6 (15.4) | ||
| 5 – Definitely switch | 5 (15.6) | 3 (10.7) | 7 (20.0) | 4 (10.0) | 3 (7.7) | ||
| Non-Response | 30 | 33 | 26 | 16 | 19 | ||
a All comparison tests are performed on only the survey times where that question was asked
b Chi-square test
c Fisher exact test
Table 3.
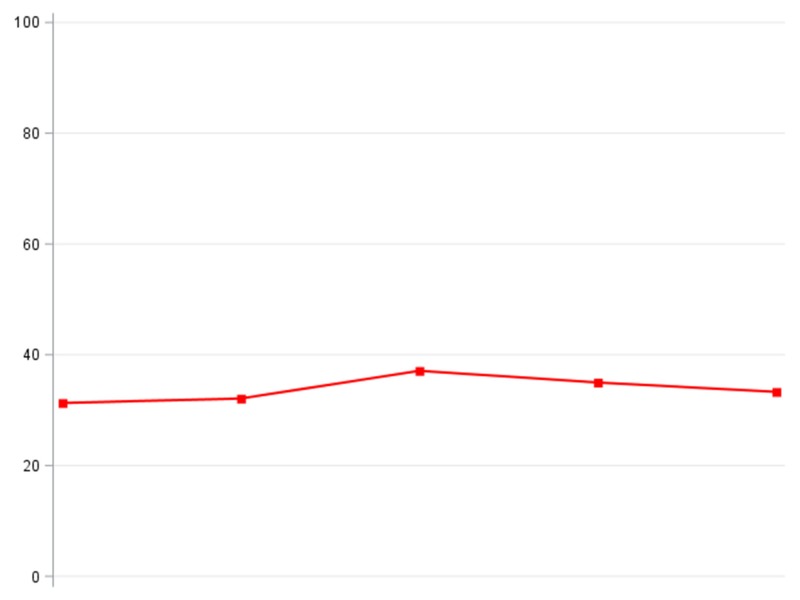
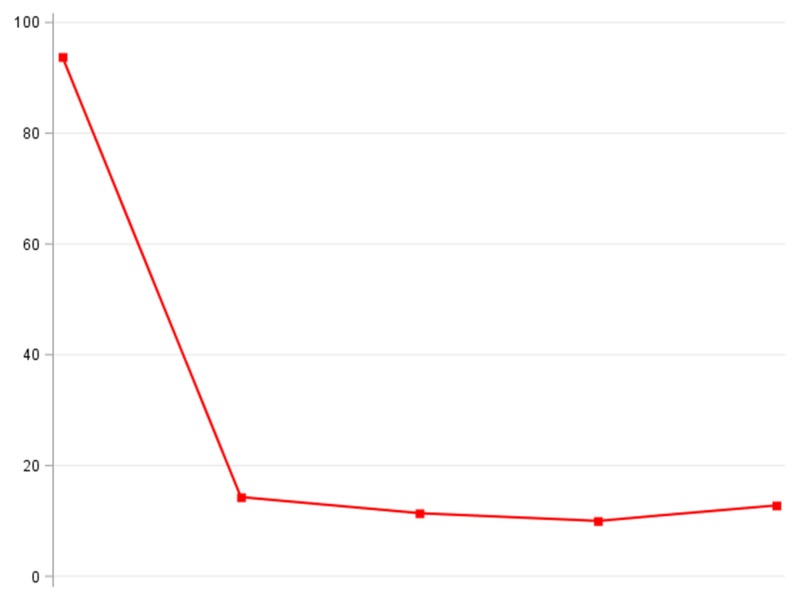
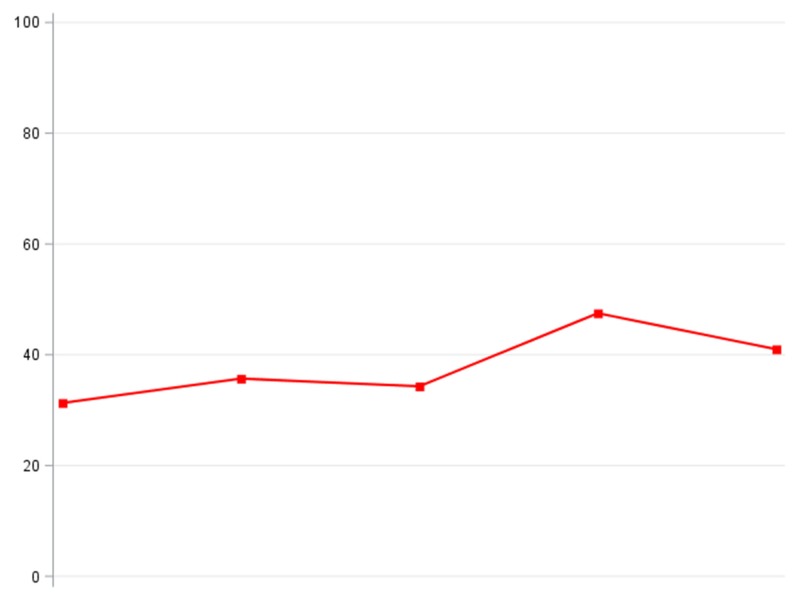
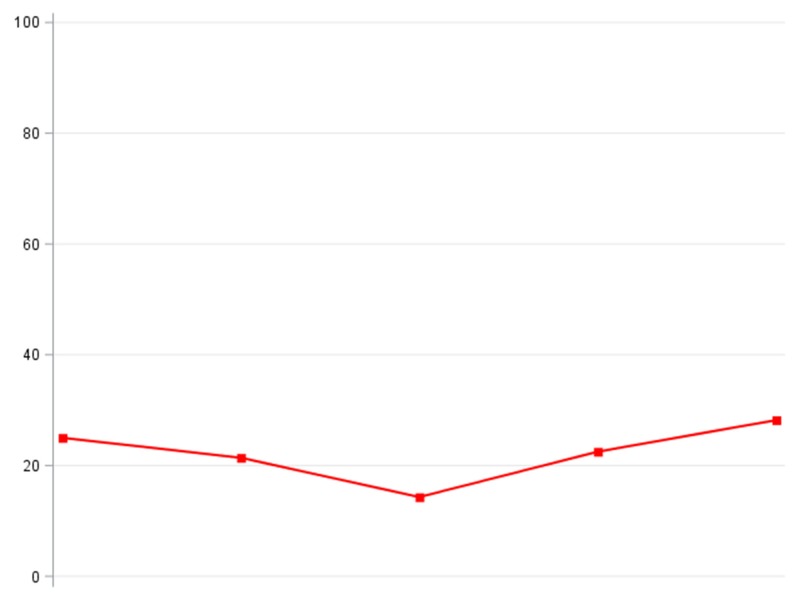
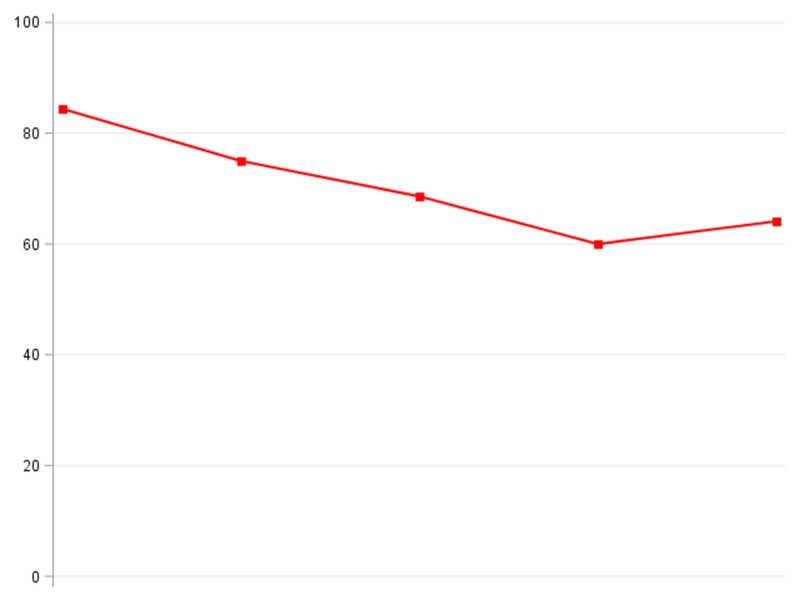
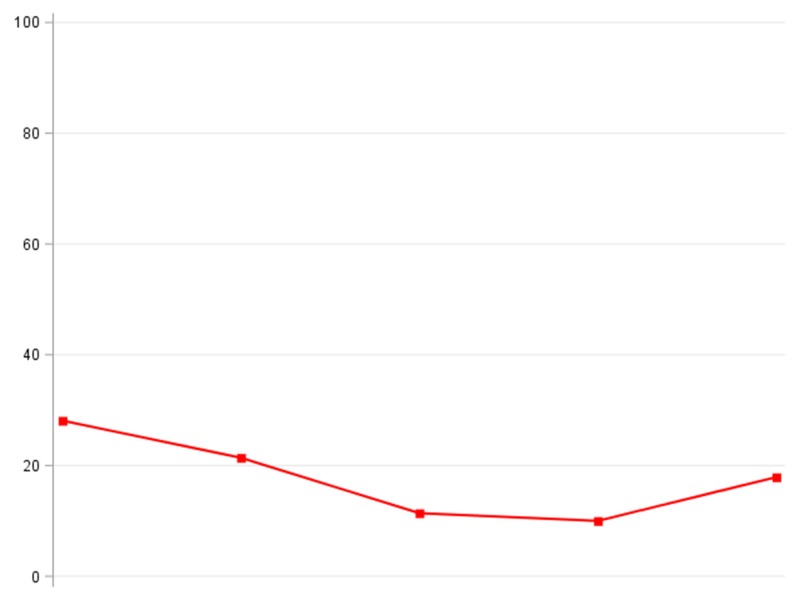
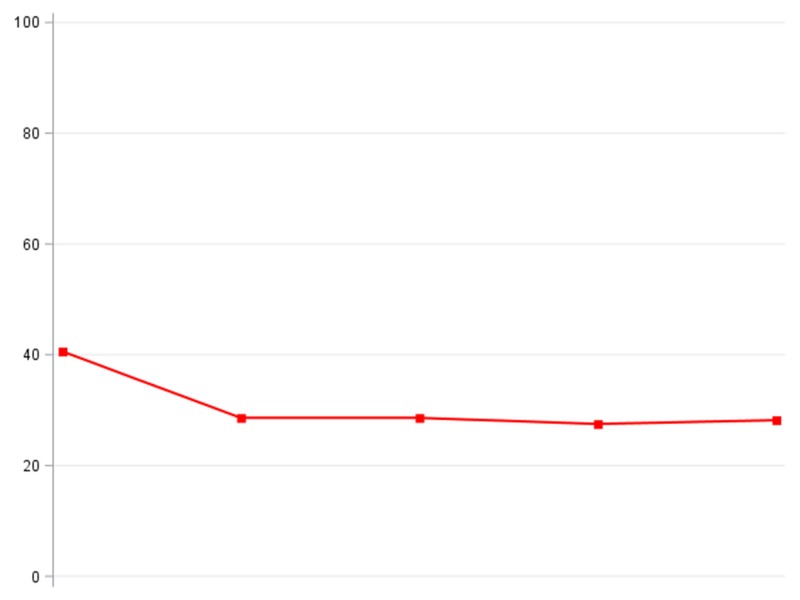
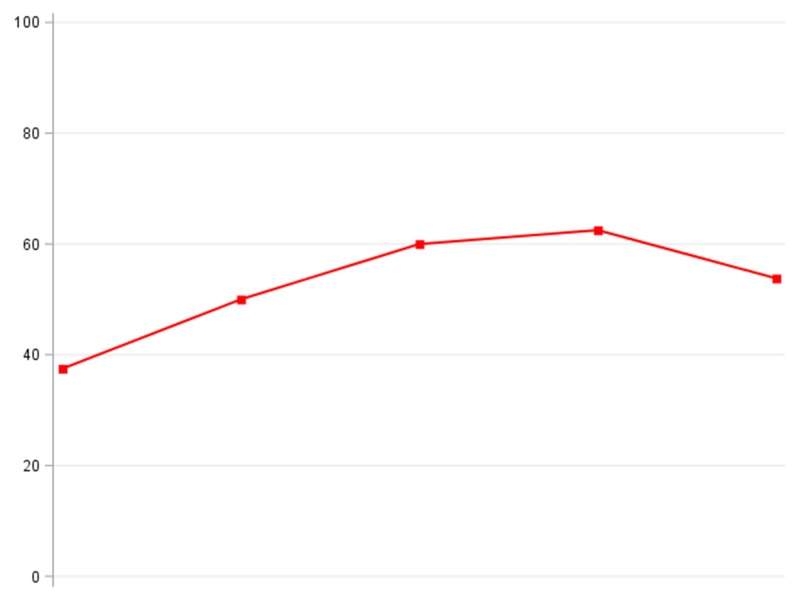
Survey responses at time points throughout EHR implementation. Responses are presented as the number of positive (%) responses to each question. The line graphs to the right are visualizations of the positive responses to each question. The y-axis shows the percentage of ophthalmologists responding positively to a question; the x-axis represents the time points. Note that the time points on the x-axis are at equal intervals, though actual intervals between surveys varied; this rescaling was done to facilitate interpretation of the plots.
| -1 Months | + 3 Months | + 7 Months | + 13 Months | + 24 Months | Line graphs | |
|---|---|---|---|---|---|---|
| Number of Surveys Completed | 32 | 28 | 35 | 40 | 39 | |
|
Theme: data entry timing/location With what frequency do you enter data into record on workday evenings/nights? a |
10(31.3) | 9(32.1) | 13 (37.1) | 14(35.0) | 13 (33.3) |
 flat line |
|
Theme: data entry timing/location With what frequency do you enter data into record on non-clinical/administrative days?a |
6(18.8) | 13 (46.4) | 12 (34.3) | 13 (32.5) | 14(35.9) |
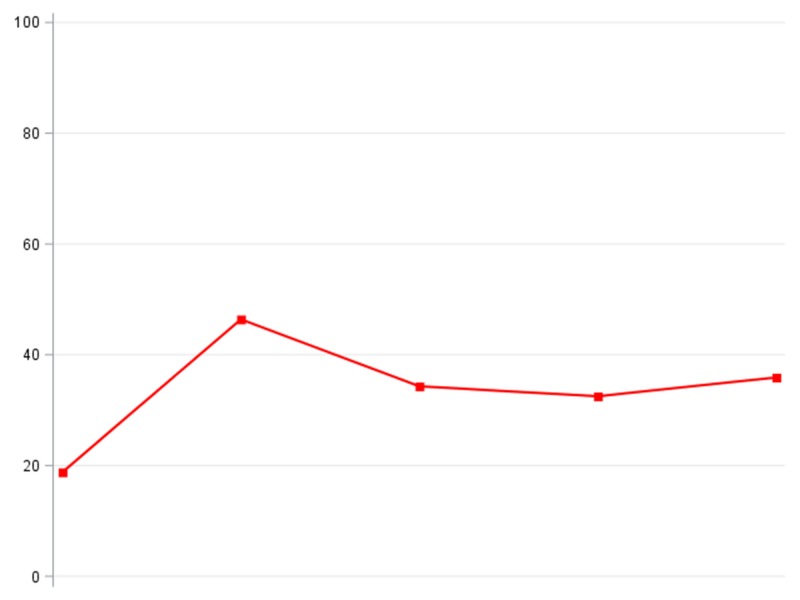 flat line |
|
Theme: data entry timing/location With what frequency do you enter data into record on days off?a |
3 (9.4) | 8 (28.6) | 7 (20.0) | 5(12.5) | 5(12.8) |
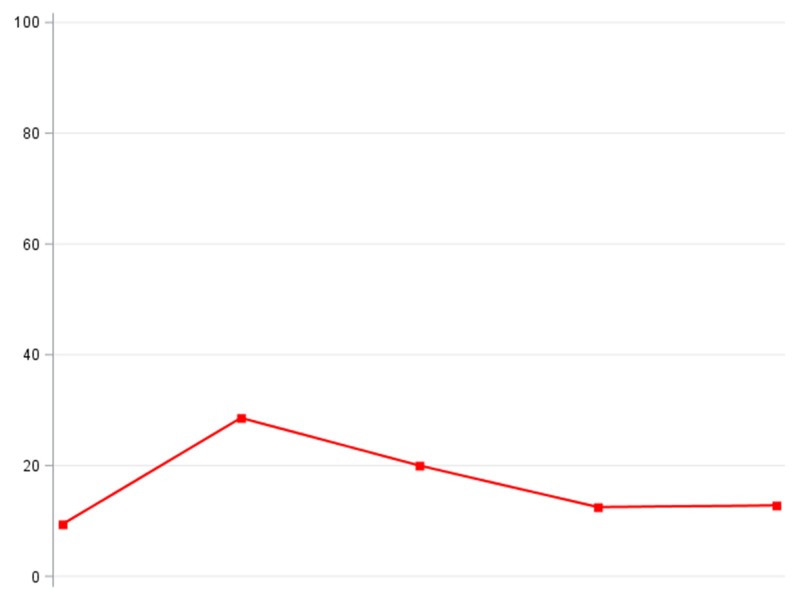 flat line |
|
Theme: documentation The current system enables me to create high quality documentation.b |
29 (90.6) | 11 (39.3) | 16(45.7) | 22 (55.0) | 16(41.0) |
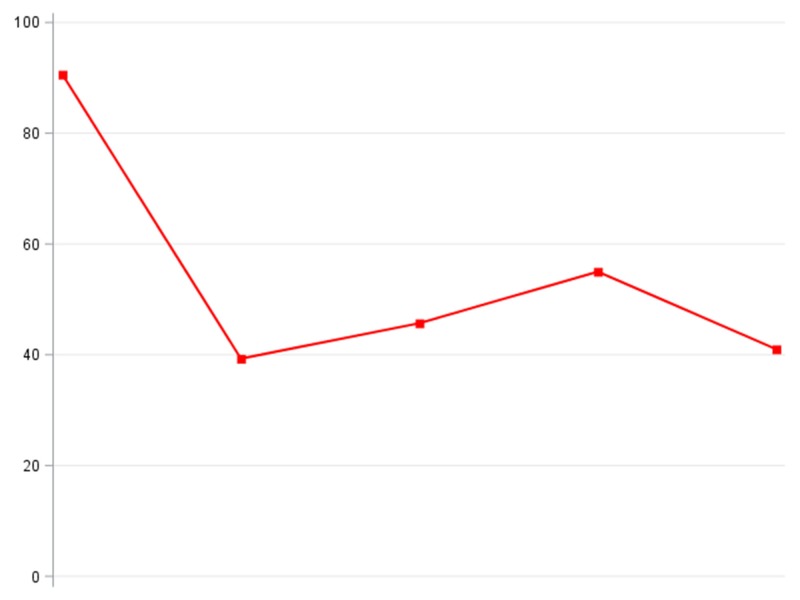 flat line |
|
Theme: communication The current system supports meaningful interaction with patients.b |
30 (93.8) | 4 (14.3) | 4 (11.4) | 4(10.0) | 5(12.8) |
 flat line |
|
Theme: safety The current system has improved patient safety.b |
10(31.3) | 10(35.7) | 12 (34.3) | 19(47.5) | 16(41.0) |
 flat line |
|
Theme: workflow Rate the impact the current system has had on your efficiency and workflow, compared to the previous system.c |
8(25.0) | 6(21.4) | 5(14.3) | 9(22.5) | 11 (28.2) |
 flat line |
|
Theme: quality of care MiChart will allow me to provide better care for my patients. b |
13 (40.6) | 8 (28.6) | 10(28.6) | 11 (27.5) | 11 (28.2) |
 flat line |
|
Theme: job satisfaction Rate your current overall job satisfaction d |
27 (84.4) | 21 (75.0) | 24 (68.6) | 24 (60.0) | 25 (64.1) |
 flat line |
|
Theme: job satisfaction Estimate the impact the current system has had on your job satisfaction.9 |
9(28.1) | 6(21.4) | 4 (11.4) | 4(10.0) | 7(17.9) |
 flat line |
|
Theme: job satisfaction Would you like to keep the current system or switch back to the previous one?1 |
12 (37.5) | 14(50.0) | 21 (60.0) | 25 (62.5) | 21 (53.8) |
 flat line |
a Positive responses indicate “Often” or “All of the Time” on a scale from “Never” to “All of the Time”
b Positive responses indicate “Agree” or “Strongly Agree” on a scale from “Strongly Disagree” to “Strongly Agree”
c Positive responses indicate “Somewhat more efficient” or “Much more efficient” on a scale from “Much less efficient” to “Much more efficient”
d Positive responses indicate “Slightly satisfied” or Very satisfied” on a scale from “Very unsatisfied” to “Very satisfied”
e Positive responses indicate “Slight positive impact” or “Very big positive impact” on a scale from “Very big negative impact” to “Very big positive impact”
f Positive responses indicate “Probably keep current system” or “Definitely keep current system” on a scale from “Definitely switch back to previous system” to “Definitely keep current system”
Ophthalmologists felt that quality of documentation changed throughout the implementation period. Prior to implementation 29 (90.6%) ophthalmologists responded positively that the current system allowed them to create high quality documentation compared to between 37.9% and 55.0% (p<0.01) on all post-implementation surveys; this is illustrated by an L curve, indicating a significant decrease over time. We also found that the proportion of ophthalmologists who felt that the current system supported meaningful interaction with patients was depicted by an L curve, having decreased from 93.8% pre-implementation to 12.8% at 24 months post-implementation (p<0.01).
Prior to EHR implementation 15.6% ophthalmologists felt that the health record system had a “negative” or “large negative” impact on their job satisfaction, while twenty-four months after implementation 59.0% felt this way (p=0.01; flat line). Nonetheless, following EHR implementation there was a trend toward ophthalmologists preferring to keep their current health record system (p=0.11; 37.5% pre-implementation and 53.8% twenty-four months post-implementation) and there was no statistically significant change in overall job satisfaction (p=0.69; flat line).
5. Discussion
In this longitudinal study of ophthalmologists’ perceptions of EHRs, we found that survey responses were not illustrated by a J curve as we had hypothesized. Instead, many responses remained relatively unchanged throughout the follow-up period. Only physicians’ desire to keep the current health record system trended toward improvement over time, though this finding was not statistically significant. The current study adds to the literature by describing the longitudinal impact of an EHR implementation on job satisfaction and perceived changes to workflow, productivity and documentation in ophthalmology.
Our EHR implementation experience was similar to that reported in other specialties [21–23]. Another study was conducted at our institution in the departments of Family Medicine, Internal Medicine and Pediatrics using the same survey as in the present study [20]. The authors found that most measures decreased and remained below baseline after EHR implementation and that no measures were illustrated by a J curve. Overall, ophthalmologists in the current study tended to be concerned about the negative impact of EHRs on their ability to create quality documentation and on their interactions with patients. These concerns were manifest as L curves in our data, indicating a significant decrease in positive perceptions over time. Although our users also felt that the EHRs had a negative impact on job satisfaction, at twenty-four months after implementation only 23.1% favored returning to the old charting system, while 53.8% preferred to keep the new EHR system.
Little prior research has examined the attitudes and perceptions of ophthalmologists toward EHR implementation. One study by Chiang and colleagues [18] surveyed a random sample of 592 members of the American Academy of Ophthalmology to determine their EHR implementation status and to evaluate their experience. The authors reported that 69% of ophthalmologists were “satisfied” or “extremely satisfied” with their EHR and that 76% would recommend their EHR to a colleague. After 6 months of use, 34% reported that their productivity had increased, while 15% said it had decreased [18]. Since this was a cross-sectional survey of ophthalmologists at different stages of implementation, it was not possible to track responses over time as respondents gained familiarity with their EHR. Moreover, ophthalmologists in this study had a variety of different EHRs. The survey did not assess whether respondents had a homegrown, ophthalmology-specific or general EHR, though they note that this could have impacted survey responses. The current study builds on this investigation by demonstrating how the attitudes and perceptions of ophthalmologist toward an EHR changed over time following implementation in a single large academic practice that was integrated with all other clinical specialties in the Health System.
Sanders and colleagues examined the impact of an EHR operating room (OR) management system on OR workflow, documentation and volume. They found that documentation time increased significantly for shorter procedures [10]. A study by the same group examined changes in physician productivity with EHR implementation [16]. The authors noted a significant 11% increase in the amount of time spent completing charts, though there was no difference in the volume of patients seen. Finally, the investigators noted that three years after implementation, 30% of charts were completed after-hours on weekdays and 14% during weekends, though they do not mention if this was a change from baseline. In our study there was not a significant change in the perceived amount of time spent completing charts on workday evenings, non-clinical days or days off. Future work should look at whether ophthalmologists’ perceptions of time spent completing charts are accurate. If in fact time to complete documentation has increased or if many charts are being completed outside of normal work hours, additional targeted EHR training to improve user efficiency may be helpful to augment job satisfaction and mitigate burnout.
Sanders and co-workers also looked at quality of physician documentation and found that documentation was more complete when ophthalmologists used an EHR compared to paper charts and that there was a shift from graphical to textual descriptions of findings when EHRs were used [13]. In our study, ophthalmologists were less confident in their ability to create quality clinical documentation after the implementation of an EHR. However, past work has demonstrated that providers’ attitudes and perceptions of EHRs do not necessarily correlate with their ability to provide high quality documentation [24]. Accordingly, future work should investigate the relationship between quality of documentation and ophthalmologists’ perception of quality, comparing paper charts and EHR.
Though not statistically significant, there was a trend in our data toward ophthalmologists believing that their health record system improved patient safety. The impact of EHRs on patient safety has not been studied in ophthalmology. However, in other fields of medicine there are reports of EHRs both decreasing [25] and improving patient safety [26]. Further work should explore this important area.
There were several limitations to our study. First, the survey response rate varied over time and a relatively small number of ophthalmologists were included in this study since it was conducted at a single institution and we may have therefore been underpowered to detect significant trends in the data. Additionally, some ophthalmologists left between survey points, while others did not respond to surveys. We do not have data on the number of ophthalmologists that left our institution at various time points and we did not follow-up with faculty after their departure. Combined with the relatively high-non-response rate in our study, this may have limited our power to assess change over time. The patient perspective on the EHR was not examined, as this was outside the scope of this study. Additionally, since this study was conducted in an academic ophthalmology department using EpicCare Ambulatory, its results may not be generalizable to other practice models, other EHRs, or other specialties with distinct needs and cultures. Finally, this study was based on survey responses, so it is prone to response biases. For example, physicians who feel strongly about EHR may have been more likely to respond to our survey. Though survey responses are inherently subjective, they are an important means for understanding the perceived impact of EHR since this can have implications for job satisfaction and burnout, as well as providing insight into what further training might be helpful.
6. Conclusions
This study provides insight into ophthalmologists’ experience of EHR implementation in a large academic medical center. Physicians expressed concerns about their ability to provide high-quality documentation and about the EHR creating additional work. They felt that the EHR negatively impacted their job satisfaction, though few ophthalmologists favored returning to paper charts. None of the data followed a J curve as we had hypothesized.
Responses to these EHR implementation surveys could be useful in developing targeted ophthalmology-specific trainings and information sessions. As users become more familiar with the essential features of EHRs, trainings could present more advanced uses that might improve workflow, documentation and efficiency. Future work might include randomized interventions to improve user satisfaction. Additionally, it will be important to compare quantitative measurements and subjective perceptions of the EHR user experience. Those currently navigating EHR implementation or planning future adoption of an EHR can benefit from this improved understanding of the perceptions of ophthalmologists as they navigate this process.
7. Clinical Relevance Statement
Ophthalmology has unique clinical documentation needs compared to other specialties. Understanding the evolving concerns and perceptions of ophthalmologists as they navigate EHR implementation is important for future efforts to improve user satisfaction. This study illustrates the key areas of concern for ophthalmologists in a large academic practice.
Supplementary Material
Funding Statement
Funding This work was supported by the Heed Foundation (Joshua R. Ehrlich, MD, MPH).
Footnotes
Conflict of Interest
The authors declare that they have no conflicts of interest in the research.
Human Subjects Protections
This research adhered to the tenets of the World Medical Association Declaration of Helsinki on Ethical Principles for Medical Research Involving Human Subjects. The study was determined to be exempt from review by the University of Michigan Institutional Review Board.
References
- 1.Hsiao C-J, Hing E. Use and characteristics of electronic health record systems among office-based physician practices: United States, 2001–2012. NCHS Data Brief 2012; 111: 1–8. [PubMed] [Google Scholar]
- 2.Blumenthal D, Tavenner M. The “Meaningful Use” Regulation for Electronic Health Records. N Engl J Med 2010; 363(6):501–504. [DOI] [PubMed] [Google Scholar]
- 3.Buntin MB, Jain SH, Blumenthal D. Health Information Technology: Laying The Infrastructure For National Health Reform Health Aff (Millwood) 2010; 29(6):1214–1219. [DOI] [PubMed] [Google Scholar]
- 4.Blumenthal D. Launching HITECH. N Engl J Med 2010; 362(5):382–385. [DOI] [PubMed] [Google Scholar]
- 5.Meaningful Use Criteria and How to Attain Meaningful Use of EHRs. [cited 2015 Sep 16]. Available from: http://www.healthit.gov/providers-professionals/how-attain-meaningful-use [Google Scholar]
- 6.Summary of AAO Membership Survey on Electronic Health Records. [cited 2015 Sep 17]. Available from: http://www.aao.org/asset.axd?id=8177bc13–7cdf-4862–8193-d3b6971d9c81&t=634962799117670000 [Google Scholar]
- 7.Boland MV, Chiang MF, Lim MC, Wedemeyer L, Epley KD, McCannel CA, Silverstone DE, Lum F, American Academy of Ophthalmology Medical Information Technology Committee Adoption of electronic health records and preparations for demonstrating meaningful use: an American Academy of Ophthalmology survey. Ophthalmology 2013; 120(8):1702–1710. [DOI] [PubMed] [Google Scholar]
- 8.Office-based Physician Electronic Health Record Adoption: 2004–2014. [cited 2016 Jul 21]. Available from: http://dashboard.healthit.gov/quickstats/pages/physician-ehr-adoption-trends.php [Google Scholar]
- 9.Chiang MF, Boland MV, Brewer A, Epley KD, Horton MB, Lim MC, McCannel CA, Patel SJ, Silverstone DE, Wedemeyer L, Lum F, American Academy of Ophthalmology Medical Information Technology Committee Special requirements for electronic health record systems in ophthalmology. Ophthalmology 2011; 118(8):1681–1687. [DOI] [PubMed] [Google Scholar]
- 10.Sanders DS, Read-Brown S, Tu DC, Lambert WE, Choi D, Almario BM, Yackel TR, Brown AS, Chiang MF. Impact of an electronic health record operating room management system in ophthalmology on documentation time, surgical volume, and staffing. JAMA Ophthalmol 2014; 132(5):586–592. [DOI] [PubMed] [Google Scholar]
- 11.Chan P, Thyparampil PJ, Chiang MF. Accuracy and speed of electronic health record versus paper-based ophthalmic documentation strategies. Am J Ophthalmol 2013; 156(1):165–172. e2. [DOI] [PubMed] [Google Scholar]
- 12.Chiang MF, Read-Brown S, Tu DC, Choi D, Sanders DS, Hwang TS, Bailey S, Karr DJ, Cottle E, Morrison JC, Wilson DJ, Yackel TR. Evaluation of electronic health record implementation in ophthalmology at an academic medical center (an American Ophthalmological Society thesis). Trans Am Ophthalmol Soc 2013; 111: 70–92. [PMC free article] [PubMed] [Google Scholar]
- 13.Sanders DS, Lattin DJ, Read-Brown S, Tu DC, Wilson DJ, Hwang TS, Morrison JC, Yackel TR, Chiang MF. Electronic health record systems in ophthalmology: impact on clinical documentation. Ophthalmology 2013; 120(9):1745–1755. [DOI] [PubMed] [Google Scholar]
- 14.Lim MC, Patel RP, Lee VS, Weeks PD, Barber MK, Watnik MR. The long-term financial and clinical impact of an electronic health record on an academic ophthalmology practice. J Ophthalmol 2015; Article ID 329819. doi:10.1155/2015/329819 [DOI] [PMC free article] [PubMed] [Google Scholar]
- 15.Singh RP, Bedi R, Li A, Kulkarni S, Rodstrom T, Altus G, Martin DF. The Practice Impact of Electronic Health Record System Implementation Within a Large Multispecialty Ophthalmic Practice. JAMA Ophthalmol 2015; 133(6):668–674. [DOI] [PubMed] [Google Scholar]
- 16.Redd TK, Read-Brown S, Choi D, Yackel TR, Tu DC, Chiang MF. Electronic health record impact on productivity and efficiency in an academic pediatric ophthalmology practice. J AAPOS Off Publ Am Assoc Pediatr Ophthalmol Strabismus Am Assoc Pediatr Ophthalmol Strabismus 2014; 18(6):584–589. [DOI] [PMC free article] [PubMed] [Google Scholar]
- 17.Pandit RR, Boland MV. The impact of an electronic health record transition on a glaucoma subspecialty practice. Ophthalmology 2013; 120(4):753–760. [DOI] [PubMed] [Google Scholar]
- 18.Chiang MF, Boland MV, Margolis JW, Lum F, Abramoff MD, Hildebrand PL, American Academy of Ophthalmology Medical Information Technology Committee Adoption and perceptions of electronic health record systems by ophthalmologists: an American Academy of Ophthalmology survey. Ophthalmology 2008; 115(9):1591–1597. [DOI] [PubMed] [Google Scholar]
- 19.Elrod PD, Tippett DD. The “death valley” of change. J Organ Change Manag 2002; 15(3):273–291. [Google Scholar]
- 20.Hanauer DA, Branford GL, Greenberg G, Kileny S, Couper MP, Zheng K, Choi SW. Two-year longitudinal assessment of physicians’ perceptions after replacement of a longstanding homegrown electronic health record: does a J-curve of satisfaction really exist? J Am Med Inform Assoc JAMIA 2016. July 3; [DOI] [PMC free article] [PubMed] [Google Scholar]
- 21.Hanauer DA, Branford GL, Greenberg G, Kileny S, Couper MP, Zheng K, Choi SW. Two-year longitudinal assessment of physicians’ perceptions after replacement of a long-standing homegrown electronic health record: Does a J-curve of satisfaction really exist? J Am Med Inform Assoc. in press. [DOI] [PMC free article] [PubMed] [Google Scholar]
- 22.McGuire MJ, Noronha G, Samal L, Yeh H-C, Crocetti S, Kravet S. Patient safety perceptions of primary care providers after implementation of an electronic medical record system. J Gen Intern Med 2013; 28(2):184–192. [DOI] [PMC free article] [PubMed] [Google Scholar]
- 23.Raglan GB, Margolis B, Paulus RA, Schulkin J. Obstetrician/gynecologists’ experiences with electronic health record systems: a narrative study. J Reprod Med 2015; 60(3–4): 95–102. [PubMed] [Google Scholar]
- 24.Bishop TF, Ryan MS, McCullough CM, Shih SC, Casalino LP, Ryan AM. Do provider attitudes about electronic health records predict future electronic health record use? Healthc Amst Neth 2015; 3(1):5–11. [DOI] [PMC free article] [PubMed] [Google Scholar]
- 25.Han YY, Carcillo JA, Venkataraman ST, Clark RSB, Watson RS, Nguyen TC, Bayir H, Orr RA. Unexpected increased mortality after implementation of a commercially sold computerized physician order entry system. Pediatrics 2005; 116(6):1506–1512. [DOI] [PubMed] [Google Scholar]
- 26.Tanner C, Gans D, White J, Nath R, Pohl J. Electronic health records and patient safety: co-occurrence of early EHR implementation with patient safety practices in primary care settings. Appl Clin Inform 2015; 6(1):136–147. [DOI] [PMC free article] [PubMed] [Google Scholar]
Associated Data
This section collects any data citations, data availability statements, or supplementary materials included in this article.