ABSTRACT
Viral hemorrhagic fevers, because of their high mortality rates, the lack of medical countermeasures, and their potential use as instruments of bioterrorism, pose a significant threat to the developed and the developing areas of the world. The key to preventing the spread of these diseases is early and accurate detection. For decades, the gold-standard immunoassay for hemorrhagic fever detection has been the enzyme-linked immunosorbent assay (ELISA); however, newer technologies are emerging with increased sensitivities. One such technology is the Luminex MagPix platform using xMAP microspheres. Here, we compare the MagPix platform with a traditional ELISA for IgM and antigen detection of infections from Lassa and Ebola viruses (LASV and EBOV, respectively). For IgM detection in nonhuman primate samples, the MagPix platform was 5 and 25 times more sensitive in detecting LASV and EBOV, respectively, compared to that with ELISA. For antigen detection in buffer, the MagPix platform was 25 and 2.5 times more sensitive in detecting lower levels of LASV and EBOV, respectively. In both IgM and antigen detection assays, the MagPix platform demonstrated excellent reproducibility at the lower limit of detection (LLOD). These findings demonstrate that the MagPix platform is a viable diagnostic replacement for the ELISA for viral hemorrhagic fevers.
KEYWORDS: ELISA, MagPix, Ebola virus, immunoassays, Lassa virus, viral hemorrhagic fever
INTRODUCTION
Hemorrhagic fevers are a part of the normal disease burden in Africa. In the developed world, they are a concern because of their potential use as bioterrorism agents. Lassa virus (family, Arenaviridae) and ebolaviruses (family, Filoviridae) are hemorrhagic fever viruses that are endemic in several African countries (1, 2). Disease outbreaks with these viruses have significant medical and social impacts. Case fatality rates can be as high as 65% for Lassa virus (LASV) and as high as 90% for ebolaviruses (3, 4). Their high mortality rates combined with their ease of transmission and the lack of vaccines or effective treatments render them extremely dangerous pathogens.
Early during an infection, hemorrhagic fever viruses have a clinical presentation that is similar to other more common febrile illnesses (5, 6). A rapid and accurate diagnosis of hemorrhagic fever viruses is critical for limiting the spread of disease and enabling an earlier more effective treatment. Traditionally, enzyme-linked immunosorbent assays (ELISAs) have been used for the detection of a virus-specific antigen and/or IgM antibodies (7, 8).
ELISA immunodiagnostics are the standard by which other diagnostics are evaluated. ELISA has been commonly used for the detection of LASV and Ebola virus (EBOV) for many years; however, newer immunodiagnostic platforms that offer multiplex capability have rarely been evaluated for these types of select agents. One such platform is the MagPix using the Luminex xMAP technology.
The MagPix assay system based on ELISA principles is centered on paramagnetic microsphere technology, which can transition ELISAs to a more sensitive and consistent system with the added capability for multiplexing individual assays in a single well. It uses color-coded magnetic microspheres with antibodies covalently coupled to the beads as the solid support for an ELISA-like sandwich immunoassay. A CCD camera is used for detecting the fluorescence from each microsphere excited by light-emitting diodes and facilitates measuring the median fluorescence intensity (MFI) of each sample. The MFI is then used as the basis for sample analysis.
Here, we compare the performances of the traditional ELISA and the MagPix system for detecting LASV- and EBOV-specific antigens and IgM antibodies. We evaluated both native and recombinant viral proteins as the targets in IgM immunoassays, and we show the reproducibility of the MagPix platform in complex matrices. This work demonstrates that the MagPix platform is a new and powerful diagnostic tool for scientists and clinicians for detecting and identifying LASV, EBOV, and other diseases that rely on ELISA as a component of an orthogonal system.
RESULTS
Comparing IgM detection with native LASV and EBOV antigens.
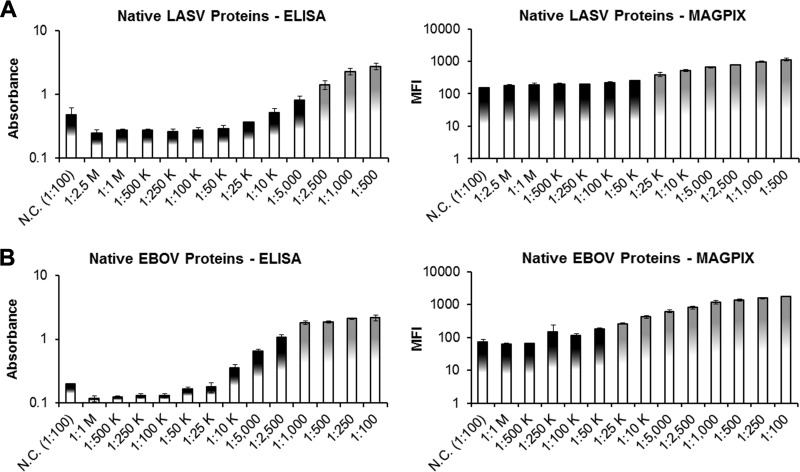
We compared the lower limit of detection (LLOD) of ELISA and MagPix for both LASV and EBOV IgM detection assays. The LLOD was defined as 2.5 times the average of the negative-control measurement. Normally, IgM assays utilize native or recombinant viral antigens to detect antigen-specific IgMs. The data in Fig. 1A and B show the results from assays that used native viral antigens from tissue culture supernatant for detecting virus-specific IgMs.
FIG 1.
(A) ELISA and MagPix LLOD determination for LASV IgM detection using native antigens. (B) ELISA and MagPix LLOD determination for EBOV IgM detection using native antigens. The negative control (NC) was normal NHP serum. The cutoff for “positive” detection was defined as 2.5× the average NC absorbance (ELISA) or MFI (MagPix) values. Gray bars indicate positive detection and black bars indicate no significant difference from the NC. Error bars represent the standard deviations of n ≥ 3.
Using the same LASV-specific reagents and parameters, the MagPix platform showed a more sensitive LLOD when testing a known LASV IgM-positive nonhuman primate (NHP) serum sample (Fig. 1A). The results of the ELISA displayed an LLOD when the IgM-positive serum was diluted to 1:2,500. For the same serum sample, the MagPix platform displayed an LLOD at a 1:25,000 dilution.
For the EBOV IgM detection assay (using a known IgM-positive NHP serum sample), we observed an ELISA LLOD when the serum was diluted to 1:5,000 (Fig. 1B). The same assay performed on the MagPix platform showed an LLOD at a dilution of 1:25,000.
Comparing IgM detection with recombinant LASV and EBOV antigens.
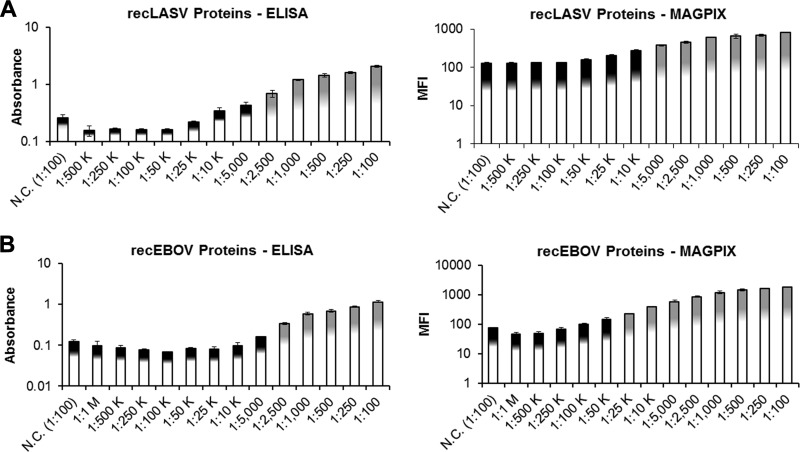
Since recombinant antigens as well as native antigens are used routinely in IgM detection assays, we repeated the assays shown in Fig. 1A and B after substituting the tissue culture supernatant with purified recombinant mixtures of glycoprotein complex (GPC) and nucleocapsid protein (NP) from LASV (recGPC and recNP, respectively) and recombinant mixtures of glycoprotein (GP) and viral matrix protein 40 (VP40) from EBOV (recGP and recVP40, respectively). The ELISA LLOD was observed when the LASV IgM-positive serum sample was diluted to 1:2,500 (Fig. 2A). Comparatively, the MagPix assay LLOD was observed when the LASV IgM serum sample was diluted to 1:5,000. An IgM detection assay for EBOV using recombinant antigens displayed a similar trend (Fig. 2B). The ELISA LLOD was observed at a 1:2,500 dilution of IgM-positive serum, while the MagPix assay LLOD was observed at a 1:25,000 dilution of IgM-positive serum.
FIG 2.
(A) ELISA and MagPix LLOD determination for LASV IgM detection using recombinant antigens. (B) ELISA and MagPix LLOD determination for EBOV IgM detection using recombinant antigens. The negative control (NC) was normal NHP serum. The cutoff for “positive” detection was defined as 2.5× the average NC absorbance (ELISA) or MFI (MagPix) values. Gray bars indicate positive detection and black bars indicate no significant difference from the NC. Error bars represent the standard deviations of n ≥ 3.
Reproducibility of IgM detection with MagPix.
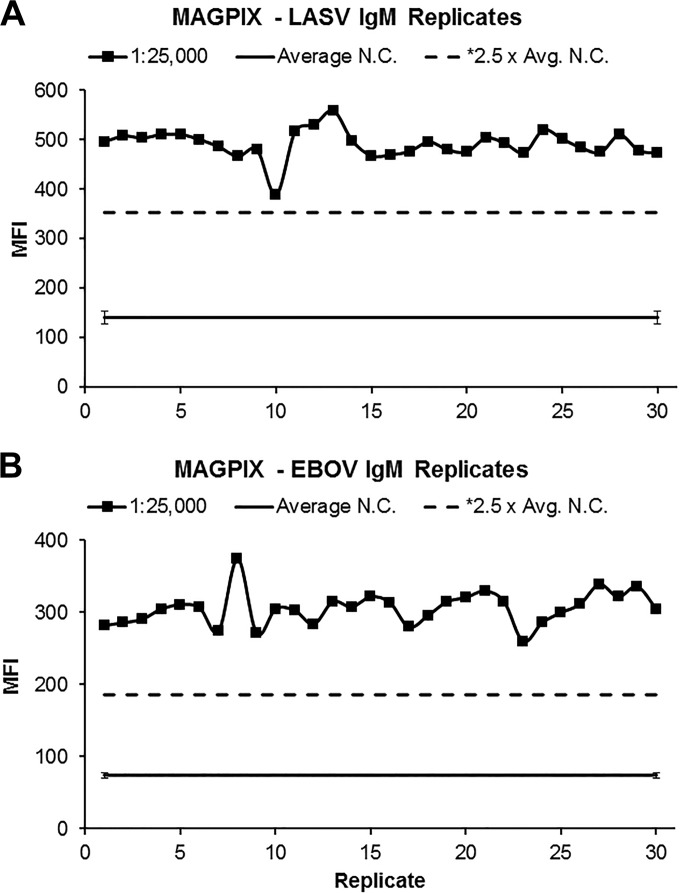
For testing the MagPix reproducibility at the LLOD for both LASV and EBOV IgM detection, we used native antigens and diluted each IgM-positive serum sample to the LLOD (1:25,000 for LASV and 1:25,000 for EBOV [Fig. 1]). This was repeated 30 times and these replicates were tested on the MagPix platform. Also, 30 unique negative human serum samples were tested for observing possible background fluctuations caused by intrinsic matrix properties that can exist between different serums (Fig. 3).
FIG 3.
(A) Reproducibility of the MagPix LASV IgM detection assay at the LLOD. (B) Reproducibility of the MagPix EBOV IgM detection assay at the LLOD. Black data points represent 30 replicates of the respective IgM-positive serum sample diluted to the previously observed LLOD. The solid black line represents the mean MFI (median fluorescence intensity) value for 30 unique, normal serum samples (NC). Error bars on each end of the solid black lines show the standard deviations for the 30 NC samples. The broken black lines represent the mean MFI values for NC samples multiplied by 2.5 (LLOD cutoff).
For measuring the reproducibility for the 1:25,000 dilution and the negative control (NC) samples, the coefficients of variation (CVs) were determined for both groups. Regarding the LASV 1:25,000 replicates, the CV was 6%, while the negative-control samples had a CV of 10%. Regarding the EBOV replicates, the CV for the 1:25,000 spiked samples was 8%, while the negative-control samples had a CV of 5%.
Comparing LASV antigen detection in buffer.
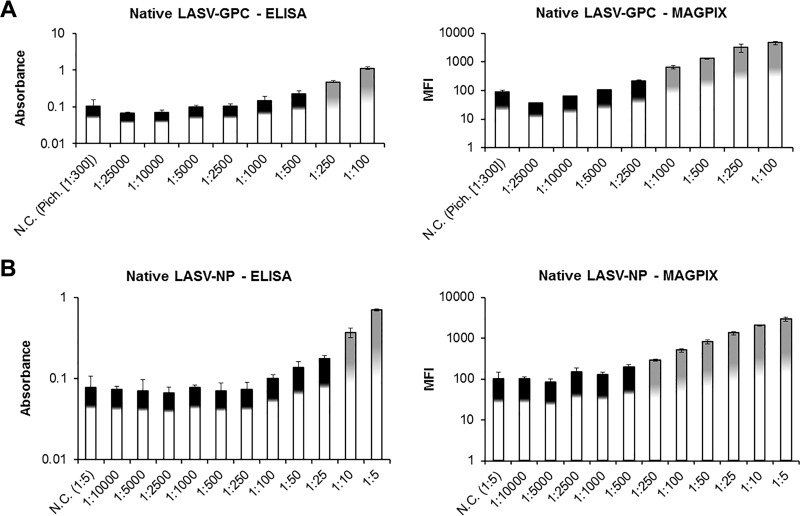
We compared the ELISA and MagPix platforms using antigen detection assays with native antigen as the target and monoclonal antibodies (MAbs) reactive to LASV-GPC, LASV-NP, EBOV-GP, and EBOV-VP40. Figure 4 shows the LLOD determinations for LASV-GPC and LASV-NP.
FIG 4.
(A) ELISA and MagPix LLOD determination for LASV-GPC antigen detection using purified LASV (Josiah strain) diluted in buffer. The negative control (NC) for LASV-GPC was purified Pichinde virus, a new-world arenavirus, used at a PFU/ml equal to the 1:100 dilution of purified LASV. (B) ELISA and MagPix LLOD determination for LASV-NP antigen detection using LASV tissue culture supernatant diluted in buffer. The NC for LASV-NP was EBOV tissue culture supernatant. The cutoff for “positive” detection was defined as 2.5× the average NC absorbance (ELISA) or MFI (MagPix) values. Gray bars indicate positive detection, and black bars indicate no significant difference from the NC. Error bars represent the standard deviations of n ≥ 3.
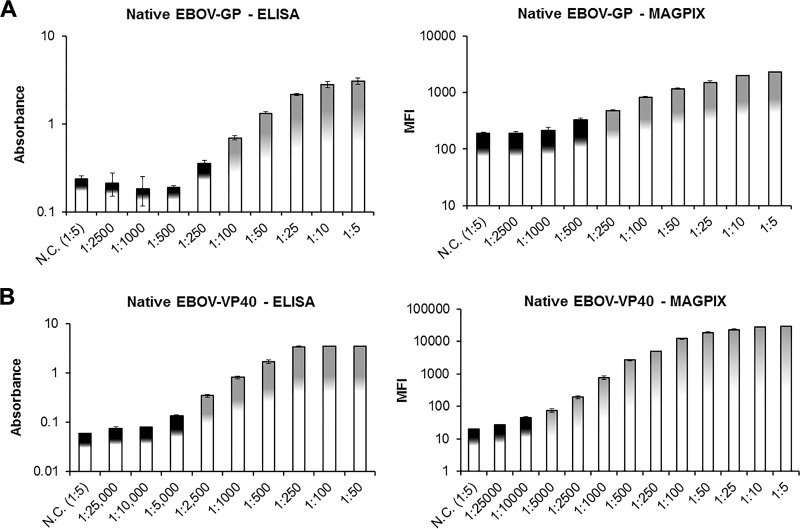
The LASV-GPC data show that the ELISA LLOD was reached at a dilution of 1:250, which corresponds to 5 × 10⁶ PFU/ml (Fig. 4A). The MagPix platform detected GPC at a maximum dilution of 1:1,000, corresponding to an LLOD of 1.25 × 10⁶ PFU/ml. The LASV-NP data show that the ELISA detected NP at a maximum dilution of 1:10, corresponding to an LLOD of 2.3 × 10⁵ PFU/ml (Fig. 4B). In turn, the MagPix platform detected LASV-NP at a dilution of 1:250, corresponding to an LLOD of 9.2 × 10³ PFU/ml.
Comparing EBOV antigen detection in buffer.
We also determined the LLODs of EBOV antigen detection assays for both platforms. The EBOV-GP data demonstrate that the ELISA LLOD was at a dilution of 1:100, corresponding to an LLOD of 1.7 × 10⁵ PFU/ml (Fig. 5A). The MagPix LLOD was at a dilution of 1:250, corresponding to 6.8 × 10⁴ PFU/ml. The EBOV-VP40 data demonstrate that the ELISA LLOD was at a dilution of 1:2,500, corresponding to 6.8 × 10³ PFU/ml (Fig. 5B). The MagPix LLOD was at a dilution of 1:5,000, corresponding to 3.4 × 10³ PFU/ml.
FIG 5.
(A) ELISA and MagPix LLOD determination for EBOV-GP antigen detection using EBOV tissue culture supernatant diluted in buffer. (B) ELISA and MagPix LLOD determination for EBOV-VP40 antigen detection using EBOV tissue culture supernatant diluted in buffer. The negative control (NC) was LASV tissue culture supernatant. The cutoff for “positive” detection is defined as 2.5× the average NC absorbance (ELISA) or MFI (MagPix) values. Gray bars indicate positive detection, and black bars indicate no significant difference from the NC. Error bars represent the standard deviations of n ≥ 3.
Reproducibility of MagPix LASV-NP antigen detection in serum.
The assays depicted in Fig. 4 and 5 were performed in a simple matrix (i.e., buffer). Clinical samples generally contain serum, which can produce background matrix effects. Not only can these matrix effects greatly reduce the sensitivity of an immunoassay, but they can also produce significantly different results from one normal clinical sample to another because of the intrinsic characteristics of the samples themselves. In turn, different clinical samples spiked with equivalent amounts of positive-control antigen can yield significantly different LLOD values. This lack of reproducibility from sample to sample is a common pitfall of the ELISA. Reproducibility of an ELISA that is typically considered “adequate” generates a coefficient of variation of 20%, and sometimes up to 30%. We have also observed these “matrix effects” with the MagPix platform when attempting to reproduce the data in Fig. 4 and 5 using serum instead of buffer (data not shown). Therefore, because of this issue, it is extremely difficult to determine the reproducibility of an antigen detection assay between multiple serum samples.
To circumvent this issue, we leveraged the multiplexing capability of the MagPix platform. For each sample, two separate assays were performed in the same well of a 96-well plate. One was an antigen detection assay for LASV-NP. The other was an antigen detection assay for bacteriophage M13 protein, which served as a negative internal control, since it is unlikely any human sample would contain the phage protein M13. The assumption behind the feasibility of this method was that the matrix effects of a sample are directly related with the MFI of the LASV-NP detection assay and the MFI of the M13 detection assay. In other words, when the background signal for a sample is relatively high, the MFIs for the LASV-NP and the M13 assays will be relatively high; when the background is relatively low, the MFIs for the LASV-NP and the M13 assays will be relatively low. With this direct correlation, a ratio between the LASV-NP and M13 MFIs can be used to normalize the LASV-NP antigen signal between unique samples. For example, serum samples spiked with positive antigen (LASV-NP) will create an LASV-NP/M13 MFI ratio that falls outside a normal distribution of ratios created by a population of unique unspiked samples.
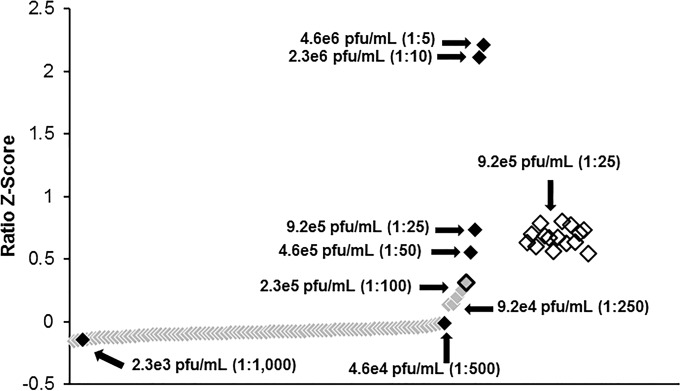
For evaluating this method, we tested a population of 96 unique, normal human serum samples. Of these 96 samples, eight were randomly spiked with various concentrations of LASV tissue culture supernatant (similar to those in Fig. 4B [1:5 to 1:1,000]). The Z scores for the LASV-NP/M13 MFI ratios were calculated and arranged smallest to largest (Fig. 6). Here, we chose the 1:25 dilution (9.2 × 10⁵ PFU/ml) as the LLOD because it was the minimal amount of antigen required to produce a ratio Z-score that was 1 Z-score above the highest unspiked ratio Z-score (Fig. 6, gray data point outlined in black).
FIG 6.
Reproducibility of the MagPix LASV-NP antigen detection assay. Each datum point represents a LASV-NP/M13 MFI ratio Z-score value. Gray data points represent normal serum samples, and the gray datum point outlined in black represents the highest unspiked ratio Z-score. Black data points represent ratio Z-scores from serum samples spiked with serial dilutions of LASV tissue culture supernatant. Black outlined open data points represent ratio Z-scores from 15 serum samples spiked with 9.2 × 10⁵ PFU/ml (1:25).
Using this LLOD, we determined the reproducibility of the MagPix platform for LASV-NP antigen detection in a complex clinical matrix. To do this, 15 unique, normal human serum samples were spiked with LASV tissue culture supernatant at 9.2 × 10⁵ PFU/ml (1:25 dilution). The LASV-NP/M13 ratios for the 15 samples were determined and were analyzed with the previous 96 samples (Fig. 6, open data points). The reproducibility of the results was measured by the CV. The CV for these 15 samples was 12%.
Reproducibility of MagPix EBOV-VP40 antigen detection in serum.
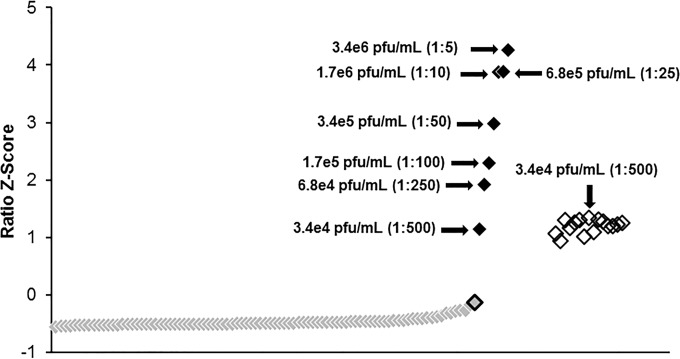
The same experimental setup that was used for LASV-NP antigen detection reproducibility was used for testing EBOV-VP40 antigen detection. The EBOV-VP40/M13 MFI ratio for 96 unique, normal human serum samples was determined (eight of the samples were randomly spiked with EBOV tissue culture supernatant as in Fig. 5B [1:5 to 1:500]). The Z-scores for the EBOV-VP40/M13 MFI ratios were calculated and arranged smallest to largest (Fig. 7). Here, we chose the 1:500 dilution (3.4 × 10⁵ PFU/ml) as the LLOD because it was the minimal amount of antigen required for producing a ratio Z-score that was 1 Z-score above the highest unspiked ratio Z-score (Fig. 7, gray data point outlined in black).
FIG 7.
Reproducibility of the MagPix EBOV-VP40 antigen detection assay. Each datum point represents an EBOV-VP40/M13 MFI ratio Z-score value. Gray data points represent normal serum samples, and the gray datum point outlined in black represents the highest unspiked ratio Z-score. Black data points represent ratio Z-scores from serum samples spiked with serial dilutions of EBOV tissue culture supernatant. Black outlined open data points represent ratio Z-scores from 15 serum samples spiked with 3.4 × 10⁴ PFU/ml.
Using this LLOD, we determined the reproducibility of the MagPix platform for EBOV-VP40 antigen detection in a complex clinical matrix. To do this, 15 unique, normal human serum samples were spiked with LASV tissue culture supernatant at 3.4 × 10⁵ PFU/ml (1:500 dilution). The reproducibility of the results was measured by the CV. The EBOV-VP40/ M13 ratios for the 15 samples were determined and were analyzed with the previous 96 samples (Fig. 7, open data points). The CV for these 15 samples was 10%.
DISCUSSION
Prompt diagnosis is a key aspect for treating and containing LASV and ebolavirus infections. ELISAs are traditionally used for detecting virus-specific antibodies or antigens; however, the use of newer technology with paramagnetic bead-based sandwich immunoassays is an improvement. We directly compared the capability of one of these bead platforms, MagPix by Luminex, with a standard ELISA using IgM and antigen detection of LASV and EBOV.
We compared the lower limit of detection (LLOD) of the ELISA and MagPix platforms for the detection of LASV and EBOV IgM antibodies using both native and recombinant antigens. Without exception, the MagPix platform was more sensitive. The MagPix assays detected 10 times less-concentrated IgM than did the ELISA. Similar results were observed with LASV and EBOV antigen detection. We showed that the MagPix assays detected 20 to 25 times less viral antigen than the ELISA detected. This increased capacity for detecting lower levels of antibody and antigen by the MagPix instrument can result in earlier diagnosis of infection and earlier treatment, thereby reducing the morbidity or mortality associated with these diseases.
The reproducibility of assay performance is integral to confidence in the results. To demonstrate the reproducibility of MagPix for detecting IgM antibodies, we repeated the assay 30 times using the LLOD for IgM of LASV (1:25,000) and EBOV (1:25,000), and we compared the results to 30 unique, negative human serum samples. Among these samples, we observed no false negatives from the positive samples diluted to the LLOD. The coefficient of variation (CV) for these IgM detection assays was never higher than 10%, demonstrating the excellent reproducibility of the MagPix platform.
The measurement of the reproducibility of antigen detection with the MagPix platform required a more elegant assay. Since the influence of matrix effects from one serum to another can vary widely, fluctuations in the LLOD due to these effects are a common problem with antigen detection immunoassays. To remedy this issue, we designed an internal control that effectively normalized the data obtained in antigen detection assays for LASV and EBOV. This solution, which arises from the multiplexing capability of the MagPix platform, enabled us to make accurate determinations regarding an assay's reproducibility from one serum sample to the next. We have found this to be a much more facile and inexpensive solution (since M13 MAbs are relatively inexpensive) than incorporating exotic blocking agents into our buffers. Once the antigen signal was normalized, we measured the MFI of 15 unique serum samples spiked with LASV or EBOV at the LLOD concentration. From these samples we observed CVs of 12% and 10%, respectively, demonstrating the excellent reproducibility of these assays when performed on the MagPix platform.
The data presented demonstrate that the MagPix platform is a powerful tool for detecting and identifying LASV and EBOV. This new platform outperforms the ELISA when used to detect LASV and EBOV. The multiplexing capabilities of the MagPix platform theoretically enables faster testing using less sample than is required by traditional ELISAs. Thus, this improved platform might be a valuable asset in regions where these diseases are endemic, emerging, or reemerging, as well as for the U.S. biodefense program.
MATERIALS AND METHODS
Antibodies.
Common USAMRIID identification codes for the capture mouse monoclonal antibodies (MAbs) are as follows: L52-85-6-BG12 for LASV-GPC, L52-2159-15 for LASV-NP, Z-DA06-AH05 for EBOV-GP, and M-HD06-A10A for EBOV-VP40. The capture MAbs were covalently linked to microspheres using the Luminex microspheres coupling kit (Luminex, Austin, TX) according to the instructions. Biotinylated detection mouse MAb common USAMRIID identification codes are as follows: L52-2074-7A for LASV-GPC, L52-189-13 for LASV-NP, DA01-A5-B11 for EBOV-GP, and BMD04-BD07-AE11 for EBOV-VP40. Detection MAbs were biotinylated using the EZ-Link Sulfo-NHS-LC-Biotinylation kit (Thermo Fisher Scientific, Waltham, MA) according to the instructions.
Serum samples from nonhuman primates (NHP), namely, rhesus macaques (Macaca mulatta) that were infected with LASV and EBOV, were used for evaluating the diagnostic assays. The LASV- and EBOV-infected samples were obtained from banked serum samples from earlier studies. The samples were previously inactivated by gamma irradiation and were safety tested to ensure their inactivation.
Viruses.
Confluent Vero cells were infected with LASV, Josiah strain in Dulbecco's modified Eagle's medium (DMEM) containing 10% fetal bovine serum (FBS), 1% l-glutamine, and 0.1% gentamicin. Cells were harvested on day 5. The supernatant was cleared of cellular debris by low-speed centrifugation, the titers were determined by plaque assays, and the virus was inactivated via gamma irradiation. Purified LASV was produced by a conventional sucrose gradient.
Confluent Vero cells were infected with EBOV, Zaire strain in Eagle's minimum essential medium (EMEM) supplemented with 5% FBS, 1% l-glutamine, and 0.5% penicillin-streptomycin. Cells were harvested on day 7. The supernatant was cleared of cellular debris by low-speed centrifugation, the titers were determined by plaque assays, and the virus was inactivated via gamma irradiation.
Confluent Vero cells were infected with Pichinde virus, CoAN3739 strain in Eagle's minimum essential medium (EMEM) supplemented with 5% FBS, 1% HEPES, 1% penicillin-streptomycin, 0.1% amphotericin, and 0.1% gentamicin. Cells were harvested on day 5. The supernatant was cleared of cellular debris by low-speed centrifugation, the titers were determined by plaque assays, and the virus was inactivated via gamma irradiation.
All inactivated viruses were safety tested to ensure nonviability before use in any of the assays.
Recombinant viral proteins.
Expression constructs for recombinant (rec) viral proteins were produced by the amplification of specific gene regions by reverse transcription (RT)-PCR from LASV or EBOV genomic material. For the LASV proteins NP and GPC, RNA was extracted from LASV, Josiah strain, and for the EBOV proteins GP and VP40, RNA was extracted from EBOV, Zaire 95 strain. LASV-GPC and EBOV-GP genes were separately cloned into pCDNA3.1/myc-His (Life Technologies, Grand Island, NY). LASV-NP and EBOV-VP40 genes were separately cloned into pCDNA3.1/myc-His (Life Technologies) modified to contain a maltose-binding protein gene directly upstream of the viral gene insert. Vectors were transiently transfected into 293T cells with Lipofectamine 2000 (Life Technologies) according to the instructions. The cells were harvested 48 h posttransfection. For recNP and recVP40, cells were lysed with lysis buffer (LB; 20 mM HEPES, 110 mM potassium acetate, 2 mM magnesium chloride, pH 7.5) supplemented with 1% Tween 20 (Sigma-Aldrich, St. Louis, MO) and complete, EDTA-free protease-inhibitor cocktail (Roche Diagnostics, Indianapolis, IN). For recGPC and recGP, cells were lysed with nickel buffer (NB; 20 mM sodium phosphate, 500 mM sodium chloride, 20 mM imidazole) supplemented with 1% Tween 20 and complete, EDTA-free protease-inhibitor cocktail. Lysates were centrifuged at 14,000 × g for 10 min and the pellet was discarded. The expressed recNP and recVP40 proteins were purified by batch with amylose resin (New England BioLabs, Ipswich, MA). The expressed recGPC and recGP proteins were purified by batch with Ni-NTA agarose (Qiagen, Valencia, CA). After binding, the resins were washed with LB for a total of five washes. The bound recNP and recVP40 proteins were eluted with LB supplemented with 20 mM maltose (Sigma-Aldrich), and the bound recGPC and recGP proteins were eluted with NB supplemented with 200 mM imidazole. Eluates were concentrated with an Amicon ultra (10K) centrifugal filter (EMD Millipore, Billerica, MA). After concentrating the eluted protein, the buffer was exchanged with 1× phosphate-buffered saline (PBS, pH 7.4) in the same centrifugal filter.
ELISA IgM detection assays.
For these assays, a multilevel “sandwich” was created in triplicate for each sample tested (n = 3). Briefly, the sandwich consisted of (in order): plate, anti-IgM MAb, test serum, antigen cocktail (native or recombinant), detector antigen-specific MAb cocktail (biotinylated), horseradish peroxidase (HRP)-linked streptavidin, and 2,2′-azinobis(3-ethylbenzthiazolinesulfonic acid) (ABTS) substrate solution (Table 1).
TABLE 1.
Comparison of ELISA and MagPix experimental components for IgM detection
| Sequential order | IgM detection |
|
|---|---|---|
| ELISA | MagPix | |
| 1 | Plate | Microspheres |
| 2 | Coating anti-IgM mAb | Coating anti-IgM mAb |
| 3 | Test serum | Test serum |
| 4 | Antigen cocktail | Antigen cocktail |
| 5 | Detector antigen-specific mAb cocktail (biotinylated) | Detector antigen-specific mAb cocktail (biotinylated) |
| 6 | HRP-linked streptavidin | R-phycoerythrin-linked streptavidin |
Costar serocluster vinyl, 96-well ELISA plates (Corning, Tewksbury, MA) were coated overnight at 4°C with an MAb specific for the μ-chain of human IgM (Kirkegaard & Perry Laboratories [KPL], Gaithersburg, MD). The anti-μ antibody was used at 4 μg/ml in PBS. After coating, serial dilutions of a confirmed-positive IgM serum sample from an LASV- or EBOV-infected NHP were made in PBS with 5% skim milk (PBS-S) and were added to the plates. The plates were incubated at 37° for 1 h, and then washed three times with PBS containing 0.1% Tween 20 (PBS-T). In Fig. 1, LASV or EBOV antigens from tissue culture supernatant were diluted with PBS-S to working concentrations of 5.7 × 10⁵ PFU/ml or 3.4 × 10⁶ PFU/ml, respectively, and were added to the plates. In Fig. 2, a cocktail of recombinant LASV antigens (recGPC and recNP) or a cocktail of recombinant EBOV antigens (recGP and recVP40) was added to the plates. Each recombinant cocktail constituent was used at 10 ng/μl in PBS-S. All plates were incubated at 37° for 1 h, and then washed three times with PBS-T. Plates tested for the presence of LASV-specific IgM next received a cocktail of two biotinylated detector MAbs diluted to 4 μg/ml with PBS-S. One MAb was specific for glycoprotein complex (GPC; L52-2074-7A) and the other was specific for nucleocapsid protein (NP; L52-189-13). Plates tested for the presence of EBOV-specific IgM also received a cocktail of two biotinylated detector MAbs diluted to 4 μg/ml with PBS-S. One MAb was specific for glycoprotein (GP; DA01-A5-B11) and the other was specific for VP40 (BMD04-BD07-AE11). After the respective cocktails were added, all plates were incubated at 37°C for 1 h, and then washed three times with PBS-T. Next, all plates received HRP-linked streptavidin (Thermo Fisher Scientific) diluted to 25 μg/ml with PBS-S, were incubated at 37°C for 1 h, and then were washed three times with PBS-T. For obtaining the colorimetric reaction, all plates received ABTS peroxidase substrate solution (KPL) and were incubated at 37°C for 30 min. The optical densities (OD) were determined at 405 nm in an automated ELISA plate reader.
MagPix IgM detection assays.
For these assays, a multilevel “sandwich” was created in triplicate for each sample tested (n = 3). Briefly, the sandwich consisted of (in order): microspheres, anti-IgM MAb, test serum, antigen cocktail (native or recombinant), detector antigen-specific MAb cocktail (biotinylated), and R-phycoerythrin-linked streptavidin (Table 1).
MagPlex-C microspheres were coated with an MAb specific for the μ-chain of human IgM (KPL) using a Luminex bead coupling kit (without deviating from the manufacturer's instructions). The coupling reaction used a 4 μg/ml solution of the anti-μ MAb. The coated microspheres were added to Costar white polystyrene, 96-well plates (Corning) at ∼2,000 microspheres/well. Next, serial dilutions of a confirmed-positive IgM serum sample from LASV- or EBOV-infected NHPs were added to the coated microspheres. The plates were incubated at room temperature (RT) for 1 h with shaking, and then washed three times with PBS containing 1% bovine serum albumin (BSA) and 0.1% Tween 20 (PBS-BT). In Fig. 1, LASV or EBOV antigens from tissue culture supernatant were diluted with PBS-BT to working concentrations of 5.7 × 10⁵ or 3.4 × 10⁶ PFU/ml, respectively, and were added to the plates. In Fig. 2, a cocktail of recombinant LASV antigens (recGPC and recNP) or a cocktail of recombinant EBOV antigens (recGP and recVP40) was added to the plates. Each cocktail constituent was used at 10 ng/μl in PBS-BT. All plates were incubated at RT for 1 h with shaking, and then washed three times with PBS-BT. Plates tested for the presence of LASV-specific IgM received a cocktail of two biotinylated detector MAbs diluted to 4 μg/ml with PBS-BT. One MAb was specific for glycoprotein complex (GPC; L52-2074-7A) and the other was specific for nucleocapsid protein (NP; L52-189-13). Plates tested for the presence of EBOV-specific IgM also received a cocktail of two biotinylated detector MAbs diluted to 4 μg/ml with PBS-BT. One MAb was specific for glycoprotein (GP; DA01-A5-B11) and the other was specific for VP40 (BMD04-BD07-AE11). After the respective cocktails were added, all plates were incubated at RT for 1 h with shaking, and then washed three times with PBS-BT. Lastly, all plates received a streptavidin, R-phycoerythrin conjugate (Life Technologies) diluted to 4 μg/ml with PBS-BT, were incubated at RT for 1 h with shaking, and then washed three times with PBS-BT. The fluorescent signal generated by each well was measured with the Luminex MagPix system. For a result to be valid, a minimum of 50 beads/well had to be detected by the system.
ELISA antigen detection (sandwich) assays.
For these assays, a multilevel “sandwich” was created in triplicate for each sample tested (n = 3). Briefly, the sandwich consisted of (in order): plate, coating antigen-specific MAb, antigen cocktail, detector antigen-specific MAb (biotinylated), R-phycoerythrin-linked streptavidin, and ABTS substrate solution (Table 2).
TABLE 2.
Comparison of ELISA and MagPix experimental components for antigen detection
| Sequential order | Antigen detection |
||
|---|---|---|---|
| ELISA (buffer) | MagPix (buffer) | MagPix (serum) | |
| 1 | Plate | Microspheres | Microspheres |
| 2 | Coating antigen-specific mAb | Coating antigen-specific mAb | Coating antigen-specific mAb |
| 3 | Antigen cocktail | Antigen cocktail | Test serum |
| 4 | Detector antigen-specific mAb (biotinylated) | Detector antigen-specific mAb (biotinylated) | Detector antigen-specific mAb (biotinylated) |
| 5 | HRP-linked streptavidin | R-phycoerythrin-linked streptavidin | R-phycoerythrin-linked streptavidin |
Costar serocluster vinyl, 96-well ELISA plates (Corning) were coated overnight at 4°C with a MAb specific for the antigen of interest: L52-85-6-BG12 for LASV-GPC, L52-2159-15 for LASV-NP, Z-DA06-AH05 for EBOV-GP, and M-HD06-A10A for EBOV-VP40. All coating antibodies were used at 4 μg/ml in PBS. After coating, serial dilutions of either LASV (Fig. 4) or EBOV (Fig. 5) tissue culture supernatant were made in PBS-S and were added to the plates. The plates were incubated at 37°C for 1 h, and then washed three times with PBS-T. A biotinylated MAb (4 μg/ml in PBS-S) specific for the antigen of interest was then added: L-52-2074A for LASV-GPC, L52-189-13 for LASV-NP, DA01-A5-B11 for EBOV-GP, and BMD04-BD07-AE11 for EBOV-VP40. The plates were incubated at 37°C for 1 h, and then washed three times with PBS-T. Next, all plates received HRP-linked streptavidin (Thermo Fisher Scientific) diluted to 25 μg/ml with PBS-T, were incubated at 37°C for 1 h, and then washed three times with PBS-T. For obtaining the colorimetric reaction, ABTS peroxidase substrate solution (KPL) was added and the plates were incubated at 37°C for 30 min. The optical densities (OD) were determined at 405 nm in an automated ELISA reader.
MagPix antigen detection (sandwich) assays in buffer.
For these assays, a multilevel “sandwich” was created in triplicate for each sample tested (n = 3). Briefly, the sandwich consisted of (in order): microspheres, coating antigen-specific MAb, antigen cocktail, detector antigen-specific MAb (biotinylated), and R-phycoerythrin-linked streptavidin (Table 2).
MagPlex-C microspheres were coated with a MAb specific for the antigen of interest: L52-85-6-BG12 for LASV-GPC, L52-2159-15 for LASV-NP, Z-DA06-AH05 for EBOV-GP, and M-HD06-A10A for EBOV-VP40. All coating antibodies were used at 4 μg/ml in PBS. The coupling reactions were performed using a Luminex bead coupling kit (without deviating from the manufacturer's instructions). The coated microspheres were added to Costar white polystyrene, 96-well plates (Corning) at ∼2,000 microspheres/well. After coating, serial dilutions of either LASV (Fig. 4) or EBOV (Fig. 5) tissue culture supernatant were made in PBS-BT and were added to the plates.
All plates were incubated at RT for 1 h with shaking, and then washed three times with PBS-BT. A biotinylated MAb (4 μg/ml in PBS-BT) specific for the antigen of interest was then added: L-52-2074A for LASV-GPC, L52-189-13 for LASV-NP, DA01-A5-B11 for EBOV-GP, and BMD04-BD07-AE11 for EBOV-VP40. All plates were incubated at RT for 1 h while shaking, and then washed three times with PBS-BT. Lastly, all plates received a streptavidin, R-phycoerythrin conjugate (Life Technologies) diluted to 4 μg/ml with PBS-BT, were incubated at RT for 30 min while shaking, and then washed three times with PBS-BT. The fluorescent signal generated by each well was measured with the Luminex MagPix system. For a result to be valid, a minimum of 50 beads/well had to be detected by the system.
MagPix antigen detection assays in spiked human serum.
For these assays, a multilevel “sandwich” was created in triplicate for each sample tested (n = 3). Briefly, the sandwich consisted of (in order): microspheres, coating antigen-specific MAb, test serum, detector antigen-specific MAb (biotinylated), and R-phycoerythrin-linked streptavidin (Table 2).
Antigen-detection of LASV-NP required two sets of MagPlex-C microspheres (with different internal labels). One set was coated with anti-LASV-NP MAb L52-2159-15. The other set was coated with an MAb specific for the M13 of bacteriophage (27942001; GE Lifesciences). The M13 MAb was included to increase reproducibility in the presence of background matrix effects. For each sample tested, two separate assays were performed in the same well of a 96-well plate. One was an antigen-detection assay for LASV-NP, and the other was an antigen-detection assay for bacteriophage M13 protein, which served as a negative, internal control since it is unlikely any human sample would contain the phage protein M13. The assumption behind the feasibility of this method was that the matrix effects from a sample are directly related to the MFIs of the LASV-NP and M13 detection assays. In other words, when the background signal of a sample is relatively high, the MFIs for the LASV-NP and the M13 assays are relatively high; when the background is relatively low, the MFIs for the LASV-NP and the M13 assays will be relatively low. With this direct correlation, a ratio between the LASV-NP and M13 MFIs can be used to normalize the LASV-NP antigen signal between unique samples. For example, serum samples spiked with positive antigen (LASV-NP) will create an LASV-NP/M13 MFI ratio that falls outside a normal distribution of ratios created by a population of unique, unspiked samples.
All coating antibodies were used at 4 μg/ml in PBS. The coupling reactions were performed using a Luminex bead coupling kit (without deviating from the manufacturer's instructions). Briefly, ∼2,000 microspheres from each set were added to every well of a Costar white polystyrene, 96-well plate. Next, 96 unique, normal human serum samples (Covance, Princeton, NJ) were diluted 1:5 in PBS-BT. Eight of these serum samples were randomly selected and received a serial dilution of LASV antigen (tissue culture supernatant). These 96 samples (88 normal, 8 spiked) were added individually to the 96 wells containing microspheres. The plate was incubated at RT for 1 h with shaking, and then washed three times with PBS-BT. After washing, each well received a cocktail of two biotinylated detector MAbs diluted to 4 μg/ml with PBS-BT. One MAb was specific for nucleocapsid protein (NP; L52-189-13) and the other was the same M13 MAb (27942001; GE Lifesciences) used in microsphere coating. The plate was incubated at RT for 1 h with shaking, and then washed three times with PBS-BT. Lastly, all plates received a streptavidin, R-phycoerythrin conjugate (Life Technologies) diluted to 4 μg/ml with PBS-BT, were incubated at RT for 30 min with shaking, and then washed three times with PBS-BT. The signal generated by each well was measured with the Luminex MagPix instrument. For a result to be valid, a minimum of 50 beads/well had to be detected by the system. The LASV-NP/M13 MFI ratio for each sample was obtained. The values are expressed as Z-scores, using the means and standard deviations of all ratios from the experimental population.
EBOV-VP40 antigen-detection from spiked human serum was performed using the same general procedure as used for the LASV-NP protocol described above. The coating antibody was anti-EBOV-VP40 MAb M-HD06-A10A, and the biotinylated detector antibody was anti-EBOV-VP40 MAb BMD04-BD07-AE11. Eight randomly selected serum samples received a serial dilution of EBOV antigen (tissue culture supernatant). We obtained an EBOV-VP40/M13 MFI ratio for each sample. The values are expressed as Z-scores, using the means and standard deviations of all ratios from the experimental population.
Lower limit of detection (LLOD) determination.
Due to the rarity of some samples, a thorough statistical determination of LLOD could not be performed. Thus, in Fig. 1 to 5, the minimum threshold for a test measurement to be considered “positive” (LLOD) was set at 2.5 times the average negative-control measurement.
ACKNOWLEDGMENTS
We thank Scott P. Olschner, Tamara E. Clements, and Cynthia A. Rossi at the U.S. Army Medical Research Institute of Infectious Diseases (USAMRIID) for their expert technical assistance.
The opinions, interpretations, conclusions, and recommendations in this article are those of the authors and are not necessarily endorsed by the U.S. Army.
Funding Statement
The laboratory work was funded in part by the Division of Global Emerging Infections Surveillance and Response System (GEIS) Operations at the Armed Forces Health Surveillance Center and by the Department of Defense Medical Countermeasure Systems Critical Reagents Program. This research was performed while N.G.S. held a National Research Council (NRC) Research Associateship award at Diagnostic Systems Division, USAMRIID.
REFERENCES
- 1.Fichet-Calvet E, Rogers DJ. 2009. Risk maps of Lassa fever in West Africa. PLoS Negl Trop Dis 3:e388. doi: 10.1371/journal.pntd.0000388. [DOI] [PMC free article] [PubMed] [Google Scholar]
- 2.MacNeil A, Rollin PE. 2012. Ebola and Marburg hemorrhagic fevers: neglected tropical diseases? PLoS Negl Trop Dis 6:e1546. doi: 10.1371/journal.pntd.0001546. [DOI] [PMC free article] [PubMed] [Google Scholar]
- 3.Fisher-Hoch SP, Tomori O, Nasidi A, Perez-Oronoz GI, Fakile Y, Hutwagner L, McCormick JB. 1995. Review of cases of nosocomial Lassa fever in Nigeria: the high price of poor medical practice. BMJ 311:857–859. doi: 10.1136/bmj.311.7009.857. [DOI] [PMC free article] [PubMed] [Google Scholar]
- 4.Casillas AM, Nyamathi AM, Sosa A, Wilder CL, Sands H. 2003. A current review of Ebola virus: pathogenesis, clinical presentation, and diagnostic assessment. Biol Res Nurs 4:268–275. doi: 10.1177/1099800403252603. [DOI] [PubMed] [Google Scholar]
- 5.Richmond JK, Baglole DJ. 2003. Lassa fever: epidemiology, clinical features, and social consequences BMJ 327:1271–1275. doi: 10.1136/bmj.327.7426.1271. [DOI] [PMC free article] [PubMed] [Google Scholar]
- 6.Peters CJ. 2005. Marburg and Ebola—arming ourselves against the deadly filoviruses. N Engl J Med 352:2571–2573. doi: 10.1056/NEJMp058109. [DOI] [PubMed] [Google Scholar]
- 7.Ksiazek TG, West CP, Rollin PE, Jahrling PB, Peters CJ. 1999. ELISA for the detection of antibodies to Ebola viruses. J Infect Dis 179(Suppl 1):S192–S198. doi: 10.1086/514313. [DOI] [PubMed] [Google Scholar]
- 8.Bowen MD, Rollin PE, Ksiazek TG, Hustad HL, Bausch DG, Demby AH, Bajani MD, Peters CJ, Nichol ST. 2000. Genetic diversity among Lassa virus strains. JVirol 74:6992–7004. doi: 10.1128/JVI.74.15.6992-7004.2000. [DOI] [PMC free article] [PubMed] [Google Scholar]


