

Abstract
Computed radiography (CR) using storage phosphors is widely used in digital radiography and mammography. A cascaded linear systems approach wherein several parameter values were estimated using Monte Carlo methods was used to model the image formation process of a single-side read ‘flying spot’ CR system using a granular phosphor. Objective image quality metrics such as modulation transfer function (MTF) and detective quantum efficiency (DQE) were determined using this model and show good agreement with published empirical data. A model such as that addressed in this work could allow for improved understanding of the effect of storage phosphor physical properties and CR reader parameters on objective image quality metrics for existing and evolving CR systems.
Index Terms: Cascaded Linear Systems, Computed Radiography (CR), Modeling, Monte Carlo methods, Radiography
I. Introduction
Computed radiography (CR) that uses photostimulable phosphor (PSP) plates is an important radiographic medical imaging technology [1]. PSP is also referred to as storage phosphor. CR facilitates cost-efficient transition from screen-film imaging to digital imaging and allows for easy implementation of image processing techniques and rapid communication of image data. Several studies have evaluated the clinical utility and overall convenience of CR, its good contrast and dynamic range characteristics and overall usefulness [2–5]. Considering the widespread prevalence and the important role that CR plays in the clinical environment, even a modest improvement in performance that is achieved through improved understanding of image formation such as that addressed in this work will have substantial impact. The use of CR continues to expand worldwide, and in particular among developing countries. The current consensus is that CR is equivalent and in some applications it may be superior to state-of-the-art screen-film imaging [6–8]. However, several studies suggest that the image quality and dose efficiency of digital radiography using semiconductor detectors is more favorable than CR technology [9–13]. Objective performance characteristics of CR technology in terms of universally accepted metrics such as modulation transfer function (MTF) and detective quantum efficiency (DQE) for radiography, mammography and phase x-ray imaging have been reported [14–23]. Recent developments, such as double-side reading of PSP plate, development of needle phosphors and line scanning, have contributed to substantial improvements in image quality [24–31].
Important contributions that address the physics pertaining to x-ray image formation process and readout have been described [32–34]. Prior modeling works have focused on determining signal amplitude, efficiency and MTF [32–34]. In this work, we expand on these approaches to provide objective image quality metrics such as MTF, noise power spectrum (NPS), and DQE using a cascaded linear systems based approach, wherein several parameter values were determined using Monte Carlo techniques. This model is applied to a CR system that uses a granular PSP and a ‘flying spot’ CR reader. Cascaded linear systems based modeling techniques have been used in the past to predict and optimize imaging performance of systems developed for x-ray imaging [35–38]. Over the past several years, many aspects detailing the development of the theory, modeling techniques and their application have been described [39–50].
II. Imaging System Model
A. Assumptions
In order to apply cascaded linear systems analysis, the modeled system needs to be linear and wide sense stationary [40, 51]. Hence, the following assumptions were made: (1) no defects in the PSP plate, (2) the thickness of the phosphor layer is constant throughout the PSP plate, (3) the phosphor grains in the PSP plate were spherical in shape, (4) orthogonal incidence of x-ray beam on the PSP plate, (5) negligible x-ray scatter, (6) orthogonal incidence of the laser beam on the PSP plate during the readout out process, (7) no glare, flare or cross-scan error during readout, (8) constant laser beam intensity during readout, (9) the dwell time of the laser beam was substantially large so that decay characteristics of the photostimulated luminescence (PSL) can be ignored, and (10) linear output amplifier. While defects in PSP and small variations in thickness of phosphor layer occur in practice, these can be controlled to a large extent during the PSP plate manufacturing process. Hence, assumptions 1 and 2 are reasonable and are consistent with prior works on modeling other x-ray imaging systems. The assumption of spherical grains has also been made in prior works of modeling granular phosphors used with screen-film and digital radiographic systems [52]. While a PSP produced by one manufacturer indicated grains with fourteen-hedral shape [53], the assumption of spherical grains was made so that optical parameters can be obtained using Mie theory. Orthogonal x-ray incidence can be assumed when the source to PSP plate distance is sufficiently large and a small region-of-interest (ROI) surrounding the central x-ray beam is used for analysis. In order to reduce the effect of x-ray scatter during experimental measurements, the x-ray beam filtration material is typically placed closed to the x-ray source and collimated to a small ROI surrounding the central x-ray beam [54, 55]. Although this technique reduces the x-ray scatter influence in empirical studies, the assumption of no x-ray scatter is typically made in estimating system MTF and DQE performance in modeling studies [35–37]. While assumptions 6 and 7 were made to be consistent with prior modeling studies on CR performance [32–34], we do not know if it accurately depicts the imaging systems to which the model results are compared with in this study. In order to model glare, precise knowledge of the positioning of the internal components of the CR reader in relation to the PSP plate would be required. Depending on the laser beam intensity used, a small change in laser intensity during the readout process can cause substantial changes in bleaching efficiency or discharge fraction [33, 56]. Hence, we assumed a constant laser intensity during readout so that the bleaching efficiency is constant at a given PSP depth, which is consistent with prior works. The dwell time, τD, is defined as the time taken for the laser beam to traverse the readout sampling distance or “pixel”, and is usually chosen to be ~5 times the luminescent lifetime [56]. Although, most readout systems employing photomultiplier tubes for PSL collection use a logarithmic or a square-root amplifier for constraining the signal dynamic range prior to digitization, we assumed a linear amplifier to facilitate the linearity assumption. Studies reporting on empirical measurements of objective performance use a linearization technique based on the signal response to x-ray exposure (characteristic function) [14–20].
B. Photostimulable Phosphor (PSP) Plate Model
The PSP plate was modeled as comprising four layers as shown in Fig. 1: (1) the protective top layer, which was assumed to be made of polyethylene terephthalate (PET) [56] with absorption and scattering coefficients and refractive index provided in [57]; (2) the storage phosphor layer consisting of a barium fluorohalide, the properties of which are included in Tables I and II; (3) the backing layer which is considered optically absorptive for mammography and reflective for radiography; and (4) the support layer that provides mechanical rigidity to the PSP plate. Properties of the storage phosphor were compiled from multiple sources [19, 21, 33, 34, 56, 58–60] and are provided in Tables I & II.
Fig. 1.
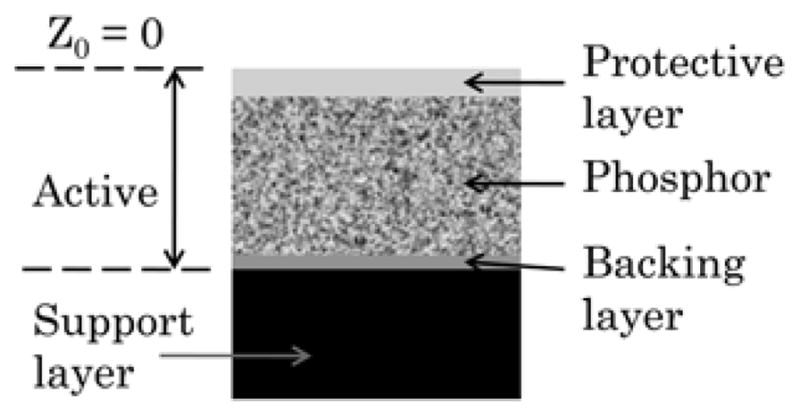
Model for the photostimulable phosphor plate. The properties of the storage phosphor are listed in Tables I & II.
TABLE I.
Storage phosphor and reader Properties
| Parameter | Mammography | Radiography |
|---|---|---|
| Phosphor Thickness, t | 140 μm | 200 μm |
| Phosphor size | 24 cm × 30 cm | 35.4 cm × 43 cm |
| Phosphor Material | BaFBr0.85I0.15:Eu2+ | BaFBr:Eu2+ |
| Phosphor Density, ρ | 5.1 g/cm3 | 4.96 g/cm3 |
| Packing Fraction, pf | 0.56 | 0.61 |
| K-edge element considered | Br | Ba |
| K-absorption energy, EK | 13.5 keV | 37.5 keV |
| Relative intensity (Energy) of Kα1, IKα1 (EKα1) | 0.60 (11.92 keV) | 0.58 (32.2 keV) |
| Relative intensity (Energy) of Kα2, IKα2 (EKα2) | 0.31 (11.88 keV) | 0.31 (31.8 keV) |
| Relative intensity (Energy) of Kβ1, IKβ1 (EKβ1) | 0.08 (13.29 keV) | 0.11 (36.4 keV) |
| Fading loss, | 0.24 | |
| Mean Grain Diameter, | 4.0 μm | 5.5 μm |
| Stimulation wavelength | 680 nm | 633 nm |
| Laser Power, I | 10 mW | 30 mW |
| Readout sampling, PSS | 100 μm | 200 μm |
| Laser Gaussian width (at 1/e2) | 100 μm | |
| Laser dwell time, τD | 5 μs | |
| Relative fraction of g5(z) components |
A1 = 0.4762 A2 = 0.3993 A3 = 0.1245 |
|
| Optical cross section of g5(z) components [cm2] |
σ1 = 8.85×10⁻¹⁶ σ2 = 1.64×10⁻¹⁶ σ3 = 2.77×10⁻¹⁷ |
|
Data compiled from multiple sources. Please see text for details
TABLE II.
Parameters used in Monte Carlo simulations
| Layer | Layer Parameter | Mammography | Radiography | ||
|---|---|---|---|---|---|
| Protective Layer | Thickness | 10 μm | |||
| Material | Polyethylene terephthalate (PET) | ||||
| Absorption coefficient | 1.5 cm−1 | ||||
| Scattering coefficient | 300 cm−1 | ||||
| Refractive index | 1.65 | ||||
|
| |||||
| Phosphor layer | Thickness | 140 μm | 200 μm | ||
| Wavelength (nm) | 680 | 405 | 633 | 405 | |
| Absorption coefficient, μa (cm−1) | 2.2 | 2.3 | 3.2 | 2.4 | |
| Scattering coefficient, μs (cm−1) | 5607 | 5084 | 3438 | 3814 | |
| Anisotropy factor, g | 0.871 | 0.909 | 0.866 | 0.913 | |
| Refractive index phosphor, nPSP | 1.68 | ||||
| Refractive index binder, nbinder | 1.40 | ||||
|
| |||||
| Backing layer | Thickness | 20 μm | 20 μm | ||
| Material | C-380 | TiO2 | |||
| Absorption coefficient | 1800 cm−1 | 0.01 cm−1 | |||
| Scattering coefficient | 200 cm−1 | 16864 cm−1 | |||
| Refractive index | 1.84 | 1.47 | |||
|
| |||||
| Support layer | Refractive index | 1.53 | |||
Data compiled from multiple sources. Please see text for details.
Although the material composition of the phosphors for mammography and radiography used in this work are different, we assumed the phosphor and binder refractive indices for BaFBr0.85I0.15:Eu2+ to be the same as BaFBr:Eu2+. For radiography with BaFBr:Eu2+, the imaginary part of the refractive index was determined from the reported absorption coefficient at 633 nm for BaFBr:Eu2+ [61]. For mammography with BaFBr0.85I0.15:Eu2+, the imaginary part of the refractive index was determined from the reported absorption coefficient for BaFBr:Eu2+ at 680 nm [61]. These choices were made as we were unable to obtain sufficient data for the optical properties of BaFBr0.85I0.15:Eu2+. The absorptive backing layer used in mammography was assumed to be made of carbon black C-380 with refractive index of 1.84 and used absorption and scattering coefficients from [62]. The reflective backing layer used in radiography was assumed to be made of 0.36 μm spheres of rutile titanium dioxide (TiO2) with refractive index of 2.73 in a polyvinyl acetate resin (10% loading) with refractive index of 1.47 [63]. The absorption coefficient of TiO2 was obtained from [64]. The Mie scattering calculator [65] was used to determine the anisotropy factor, absorption and scattering coefficients of the phosphor and the reflective TiO2 backing layer. In this study, we considered optical interactions within the protective, phosphor and backing layers and optical interactions at the boundaries between air and protective layer, protective and phosphor layers, phosphor and backing layers, and backing and support layers. Interactions within the support layer were not considered and once an optical photon was transmitted to the support layer, it was terminated.
C. CR Reader Description
The CR reader consisted of a Gaussian laser beam orthogonally incident on the PSP plate, that scans the PSP plate in a raster fashion with a dwell time, τD, to traverse the readout sampling distance specified in Table I. The luminescent lifetime of BaFBr:Eu2+ and BaFBr0.85I0.15:Eu2+ PSPs are ~0.7 μs [56]. By choosing τD to be substantially larger than the luminescent lifetime, we assumed that all of the PSL generated within a specified readout sampling distance or “pixel” is readout for that pixel. With this assumption, we separated the contribution to the MTF due to laser and PSP plate translation from the blurring within the PSP plate from an orthogonally incident non-scanning Gaussian laser beam as:
| (1) |
In (1), represents the MTF due to blurring within the PSP plate from a non-scanning Gaussian laser beam, and |sinc(πνsτD)sinc(πνssτD)| represents the laser and PSP plate translation, where νS and νSS are the scan (laser translation) and subscan (PSP plate translation) velocities, respectively. Stimulation wavelengths of 680 nm and 633 nm were chosen to reflect the peak efficiency of BaFBr0.85I0.15:Eu2+ and BaFBr:Eu2+, respectively. A schematic of the reader is shown in Fig. 2.
Fig. 2.

Schematic of the CR reader.
D. Cascaded Linear Systems Model
The system was considered as a cascade of discrete amplifying and scattering stages as shown in Fig. 3, and signal and noise transfer relationships for these stages have been provided in the past [42, 46, 47, 50]. Reabsorption of K-fluorescent x-rays causes a spatial blur and results in spatial correlation between the primary interaction site and the reabsorption site that result in parallel pathways for signal and noise transfer within the PSP plate [37, 41, 44, 45, 49]. Stages 0 through 2 correspond to x-ray image acquisition and activation of PSL-centers (also referred to as F-centers), and is similar to our prior work with a scintillator coupled imaging system [37]. We considered a 25 kVp, Mo/Mo target/filter combination, additionally filtered by 2 mm of Al to provide a 1st half-value layer (HVL) of 0.56 mm of Al for mammography, so as to match the x-ray beam quality specified in [24]. For radiography, we considered a 70 kVp W target x-ray beam filtered by 0.5 mm of Cu to match the x-ray beam used in [18]. These x-ray spectra were simulated using the software provided by the Institute of Physics in Engineering and Medicine (IPEM) [66]. Fig. 4 shows the x-ray spectra normalized to unit area for mammography (A; top) and radiography (B; bottom). These normalized energy-dependent x-ray spectra are represented as qrel(E). The x-ray photon fluence in units of photons/mm2 per unit exposure X in mR for the incident x-ray spectra were calculated based on the definition of Roentgen [67], and using the technique in [36]. The average quantum efficiency, , of the storage phosphor was computed as:
| (2) |
where, the energy-dependent quantum efficiency, g1(E) was computed as:
| (3) |
Fig. 3.

Parallel cascades based linear systems model for signal and noise propagation through the CR based imaging system. Stages 0 through 2 correspond to x-ray image acquisition and activation of PSL-centers. Stage 3 represents the fading of the activated PSL-centers. Stages 4 through 6 represent the photostimulation and PSL emission within the PSP plate. Stages 7 through 9 represent the signal collection, temporal filtering along scan direction, and additive electronic noise arising from the CR reader.
Fig. 4.

Normalized x-ray spectra for mammography (A; top) and radiography (B; bottom) used in this study.
In (3), μm(E) is the energy-dependent mass attenuation coefficient obtained from National Institute of Standards and Technology (NIST) [68], ρ is the density, pf is the packing fraction and t is the thickness. These values are listed in Table I. The signal, , and the NPS, W1, at the output of stage 1 can be derived using the transfer relationships provided by Rabbani, Shaw and Van Metter [46, 47] and computed using (4) and (5), respectively.
| (4) |
| (5) |
In (5), W1,S represents the structural noise arising due to fluctuations in the number of x-rays attenuated from one area of the PSP plate to another area. This is due to the fluctuation in quantum efficiency, represented as , arising from the randomness in the number of phosphor particles, Np, associated with the sampling (pixel) area, Apix, and can be computed using the technique described by Barnes [69] as:
| (6) |
, as stated by Barnes [69], can be computed using the index of crowding, β, the mass of phosphor particle, mp, the phosphor coating weight wp, and the energy-dependent mass-attenuation coefficient μm(E) with the assumption that the number of grains within a sampling area is Poisson distributed, and is given by:
| (7) |
β was computed assuming a hexagonal packing structure [69], wp = ρ pf t, and , where is the mean PSP grain diameter.
Following prior works by Cunningham et al. [41, 44, 45], paths A, B and C correspond to PSL-center activation when there is no K-fluorescent x-ray, local PSL-center activation when a K-fluorescent x-ray is produced, and remote (reabsorption site) PSL-center activation when a K-fluorescent x-ray is produced, respectively, as shown in Fig. 3. Since paths B and C are correlated and all quanta are real, there exist cross spectral density terms and [41, 44, 45]. Following prior works [41, 44, 45], with the assumption that the statistical nature of PSL-center activation follows a Poisson process and using the transfer relationships provided by Rabbani, Shaw and Van Metter [46, 47], the NPS at the output of stage 2 [37] can be computed using (8).
| (8) |
In (8), ς is the probability of K-shell interaction, ω is the fluorescent yield [70], fK is the probability that the K-fluorescent x-ray is reabsorbed within the phosphor, TK(u, v) is the characteristics transfer function in spatial frequency coordinates of (u, v), and and represent the mean gains along paths A, B and C, respectively. ς was obtained as the ratio of the component of the photoelectric mass attenuation coefficient relating to the isolated K-shell orbital to the total mass attenuation coefficient from NIST [71]. For the mammography spectrum, K-shell interaction in Br was considered, even though it is not a heavy element and has a low fluorescent yield, as it constitutes 28% of the weight of BaFBr0.85I0.15, and most of the spectrum is above the K-edge (EK) of 13.47 keV. For each of the K-characteristic emission energy, Ki, where i = α1, α2, β1, (ςω)Ki and fKi were determined using the method in Chan and Doi [72] with attenuation coefficients from NIST [71]. ςω and fK were obtained using (9) and (10) by weighting (ςω)Ki and fKi by the K-emission line intensity [70] represented as IKi and normalized such that .
| (9) |
| (10) |
The mean gains along the paths A, B and C represented as and were determined as:
| (11) |
In (11), E is energy in keV and m0 is the number of PSL-centers activated per keV of absorbed x-ray energy.
The characteristics transfer function TK(u, v) in spatial frequency coordinates of (u, v) was determined using the technique in [73]. The characteristic spread function (the point spread function of the K-fluorescent x-ray reabsorption) was determined using Monte Carlo simulations [74] for each of the Kα1, Kα2 and Kβ1 characteristic emission lines, transformed to spatial frequency coordinates, and weighted by their relative intensities [70] as:
| (12) |
The mean gain, can be computed as:
| (13) |
Substituting (13) in (8), the NPS at the output of stage 2 can be written as:
| (14) |
In (14), A(u, v) and B(u, v) are given by (15) and (16), respectively.
| (15) |
| (16) |
The spatial frequency dependent signal, q2(u, v) and the mean signal, at the output of stage 2, can be computed using (17) and (18), respectively.
| (17) |
| (18) |
In (17), .
Stage 3 represents fading of the activated PSL-centers and is considered to follow the binomial process. The fraction of stored signal available after fading is represented by . The mean signal, , and the NPS, W3(u, v), at the output of stage 3 can be computed using (19) and (20), respectively, using the transfer relationships provided in [46, 47].
| (19) |
| (20) |
Stages 4 through 6 represent the stimulation of the PSP plate resulting in PSL emission. These stages represent the optical interactions within the PSP plate. Stage 4 is considered as a stochastic blurring stage with the blur due to the propagation of the laser beam (red photons) in the phosphor medium represented by TPSL(u, v). Stage 5 represents the bleaching efficiency, , which is the fraction of the activated PSL centers that were stimulated by the laser beam and is considered to follow the binomial process. Stage 6 represents the escape efficiency, , which is the fraction of the PSL emission that escapes the PSP plate in the direction of the optical collection element, i.e., towards the top of the plate shown in Fig. 1. The three parameters, viz., TPSL(u, v), , and were determined using Monte Carlo simulations of optical transport.
The optical transport of the laser beam (red photons) within the PSP plate was performed using MCML software package developed by Wang et. al. [75]. For an orthogonally incident point source on the PSP plate, the spatial distribution of the red photons within the phosphor, normalized for the number of photons used in the simulation, was obtained and is represented as ϕδ(r, z), where r is the radial distance and . ϕδ(r, z) was convolved with the Gaussian laser beam using CONV software package [76] to obtain the spatial distribution of red photons within the phosphor and is represented as ϕ(r, z). In our simulations, depth z = 0 corresponds to the laser incident surface, which would be the top of the PSP plate shown in Fig. 1. From ϕ(r, z), the depth-dependent bleaching efficiency, g5(z), and the depth-weighted point spread function (PSF) of the red photons within the phosphor were determined.
The depth-dependent red photon distribution, ϕ(z), was obtained by integration of ϕ(r, z) along the radial direction. Given a laser intensity (power) of I, with photon energy hυ, to scan a PSP plate of area A within time T, the incident flux on the PSP, ϕinc, was provided by Thoms [34] as:
| (21) |
Thus, the depth-dependent red photon excitation flux, ϕexc(z), can be computed as ϕexc(z)= ϕinc(z)ϕ(z). The depth-dependent bleaching efficiency, g5(z), was computed using the equation provided by Thoms [34] as:
| (22) |
In (22), Ai and σi represent the relative contribution and optical cross sections of each of the components, respectively [34]. The average bleaching efficiency, , was obtained by weighting with the depth-dependent quantum efficiency, g1(z), as:
| (23) |
The depth-dependent escape efficiency, g6(z) was modeled using Monte Carlo optical transport [74], wherein from each depth layer 105 PSL emission (blue) photons were initiated and the number of blue photons exiting the top surface (in the direction of the optical collection element) of the PSP plate was recorded. The average escape efficiency, , was computed as:
| (24) |
The radial distribution of the photostimulated luminescence (PSL), ϕ(r), was computed as:
| (25) |
The PSF was obtained by normalization of ϕ(r) by ϕ(0). The PSL spread function, , was obtained as by Hankel transform of order zero [73] and TPSL(u,v) was obtained using (1). Using the transfer relationships [46, 47], the spatial frequency dependent signal, q4(u,v), and the NPS, W4(u,v), at the output of stochastic blurring stage (stage 4) can be computed using (26) and (27), respectively.
| (26) |
| (27) |
Following a similar approach and using the transfer relationships [46, 47] the mean signal, , and the NPS at the output of stage 5, W5 can be computed using (28) and (29), respectively.
| (28) |
| (29) |
In (29), W5,G represents the granular noise i.e., the fluctuations in signal arising from optical interactions of the incident laser beam (red photons) with phosphor grains of varying sizes. The mean signal at the output of stage 5, , can be stated as . Following an approach that is similar to that modeled for screen-film systems by Nutting, Selwyn, and Siedentopf, and described in detail by Dainty and Shaw [51], the mean squared fluctuations in signal due to the variance in g5, represented as , and can be computed as:
| (30) |
In (22), the optical cross section σi can be related to the mean cross sectional grain area, ā, as σi = kiā. Hence, using (22) and (23), the bleaching efficiency associated with a grain of cross sectional area a represented as g5(a) can be rewritten as:
| (31) |
It is relevant to note that . Hence, can be computed using (32), where βa represents the distribution of cross sectional area of grains of varying sizes, such that Σβa = 1.
| (32) |
When all grains are identically sized, then W5,G(u,v) = 0. Substituting (30) and (32) in (29), the NPS at the output of stage 5 can be stated as:
| (33) |
In order to determine granular noise, the grain size distribution needs to be known. While mean grain sizes have been provided in [53], and included in Table I, we are not aware of any report providing the grain size distribution for these commercially available phosphors. Li et al., [77] while studying the effect of mean grain size on imaging performance reported on the grain size distribution as a function of milling time. Their plot indicates a bi-modal distribution with decreasing mean grain size as the milling time was increased. However, it is unclear if these distributions represent commercially available PSP plates used in our simulations. We assumed the grain size (diameter) distribution to follow a lognormal distribution, which is typical of granular phosphors [51]. The probability density, P(d), of lognormal distribution of grain diameter, d, is given by (34), where M and S are distribution parameters. The distribution mean and variance can be computed using (35) and (36), respectively.
| (34) |
| (35) |
| (36) |
Stage 6 represents the escape efficiency computed using (24), and stage 7 represents the product of the collection efficiency ( ) and the quantum efficiency ( ) of the photodetector (typically a photomultiplier tube), i.e., . Stage 8 represents the additive electronic noise, , which was determined using (37), where Id is the anode dark current, e is the electron charge, τD is the dwell time.
| (37) |
Following a similar process and using the transfer relationships [46, 47], the NPS at the output of stage 8, can be computed using (38).
| (38) |
Along the scan direction, stage 9 represent integration over the sampling (pixel) area, Apix, and temporal filtering to reduce aliasing, represented as Tf(u). Along the subscan direction, stage 9 represent integration over the pixel area, blurring by the aperture MTF, represented as Tpix(v), and aliasing. The aperture MTF was computed as the sinc of the spacing between adjacent scan lines, i.e., Tpix(v) = |sin(π pss v)/πpssv|, where pss represents the spacing between adjacent scan lines or “pixel pitch” along the subscan direction. The signal after stage 9 along the two orthogonal axes are computed using (39).
| (39) |
The NPS after stage 9 along the scan direction represented as u in spatial frequency coordinates is given by:
| (40) |
The NPS after stage 9, inclusive of aliasing represented through the comb function, III(v), along the subscan direction represented as v in spatial frequency coordinates is given by:
| (41) |
Since the subscan direction is unaffected by the temporal filter, the presampling system MTF, represented as Tsys(v), and the system DQE were computed using (42) and (43), respectively.
| (42) |
| (43) |
E. Choice of Model Parameters
In our simulations, we used a dwell time, τD = 5 μs, which resulted in lag contribution due to laser translation of less than 0.08%. The computed scan time, assuming 100% duty cycle for the laser, to scan 24 x 30-cm (100-μm sampling) and 35.4 x 43-cm (200-μm sampling) were 21.6 and 19-seconds, respectively. In comparison, scan times of 25 to 35 seconds for Fuji AC-3 and 50 seconds for Lumisys ACR-2000 readers have been reported [15].
Phosphor layer thickness of 140 μm for mammography that corresponds to Fuji HR-V and 200 μm for radiography that corresponds to Fuji ST-IIIN were used in the simulations [56, 60]. Thoms and his colleagues reported that for BaFBr:Eu2+ crystals (100% packing fraction), ~8 PSL-centers are generated per keV of absorbed x-ray energy, corresponding to a work function of 125 eV [33, 78]. A recent review [56] indicated that the work function is ~360 eV in powder BaFBr:Eu2+ phosphors, which corresponds to 2.77 PSL centers per keV of absorbed x-ray energy. These reported values were averaged and m0 = 4.12 was used in our simulations. A 24% loss of the stored signal was assumed [58], resulting in .
Refractive indices of 1.4 and 1.68 for the binder and the phosphor grains, respectively, were obtained from Thoms [59] and used for both BaFBr:Eu2+ and BaFBr0.85I0.15:Eu2+ storage phosphors. Absorption coefficients of BaFBr:Eu2+ at 405, 633, 680 nm, corresponding to emission and stimulation wavelengths, were obtained from [61] to determine the imaginary part of the refractive indices at these wavelengths. Although, the phosphor used for mammography was BaFBr0.85I0.15:Eu2+, the absorption coefficient of BaFBr:Eu2+ at 680 nm was used in the calculations. The absorption and scattering coefficients and the anisotropy factor determined through Mie calculations and used in Monte Carlo simulations of optical transport are summarized in Table II.
The grain size distribution parameter M was varied, and consequently S for a given mean grain size as per (35), and the chi-squared statistic value, was obtained by linear regression of DQE(0.5, X) between the model results and experimental data [18, 24]. The grain size distribution parameters M and S that resulted in the minimum value of were considered as the best choice to achieve the reported exposure dependence [18, 24].
Collection efficiency, in the range of 0.1 to 0.33 have been reported [31, 56]. In our simulations, we varied the collection efficiency from 0.1 to 0.4, and the value that resulted in minimizing the absolute difference in DQE(0.5, Xmin) between the model and experimental results [18, 24] was considered as the best choice. The lowest exposure, Xmin, was chosen for this computation as this would be minimally affected by granular noise and x-ray structural noise. Further, the contribution of additive electronic noise in negligible even at the lowest exposure considered.
Photodetector quantum efficiency of 0.25, which is typical of bi-alkali photomultiplier tube (PMT) was used in the simulations. Anode dark current, Id, of 5 nA, typical of bi-alkali PMT was used in the simulations. Analysis of the NPS provided by Rowlands [56] indicate that the temporal filter applied along the scan direction with the Fuji AC-3 reader is likely to be a sixth order low-pass Butterworth filter. Hence, we used a similar filter along the scan direction with cut-off frequency at 0.67 fNyq, where fNyq is the Nyquist frequency.
III. Results
Our estimates of for the mammography spectrum with HVL matched to that stated in [24] was 4.824x10⁴ photons/mm2/mR, which resulted in a relative difference of 13.4% to that stated in [24]. Hence, for simulations using the mammography spectrum, the exposure was scaled to match the reported in [24]. For the radiography spectrum, our estimates of was 2.727x10⁵ photons/mm2/mR, which resulted in a relative difference of 1.4% to that stated in [18]. The calculated model parameters are summarized in Table III.
TABLE III.
Calculated model parameters
| Parameter (units) | Mammography | Radiography | |
|---|---|---|---|
|
|
4.25x10⁴ | 2.74x10⁵ | |
|
|
0.82 | 0.44 | |
| Index of crowding, β | 9.4x10⁻³ | 4.4x10⁻³ | |
| (ζω)Kα1 ; fKα1 | 0.31 ; 0.82 | 0.27 ; 0.48 | |
| (ζω)Kα2 ; fKα2 | 0.31 ; 0.82 | 0.28 ; 0.49 | |
| (ζω)Kβ1 ; fKβ1 | 0.29 ; 0.78 | 0.21 ; 0.40 | |
| ζω ; fK | 0.31 ; 0.81 | 0.27 ; 0.48 | |
|
|
75.0 | 197.9 | |
|
|
19.6 | 51.2 | |
|
|
49.6 | 133.4 | |
|
|
70.4 | 175.6 | |
|
|
0.76 | 0.76 | |
| Scan velocity, vs | 2x104 mm/s | 4x104 mm/s | |
| Subscan velocity, νSS | 11.1 mm/s | 22.6 mm/s | |
| T (seconds) | 21.6 | 19.03 | |
| ϕinc (photons/m2) | 1.7x10¹⁹ | 1.2x10¹⁹ | |
|
|
0.91 | 0.93 | |
| M | 1.27 | 1.685 | |
| S | 0.48 | 0.2 | |
|
|
4.19 | 1.22 | |
|
|
0.48 | 0.48 | |
|
|
0.09 | 0.045 | |
| Ḡ | 1.58 | 2.68 |
The spatial distribution of red photons within the PSP, ϕ(r,z) normalized to a maximum value of 1 is shown in Fig. 5 for mammography (A; top) and radiography (B; bottom). The computed excitation flux along the depth of the phosphor is shown in Fig. 6 for mammography and radiography. The data shown in Fig. 6 were used to compute the depth-dependent bleaching efficiency using (22) and is shown in Fig. 7 for mammography (A; top) and radiography (B; bottom). The Monte Carlo estimated depth-dependent escape efficiency is also shown.
Fig. 5.

Red photon fluence, ϕ(r,z) within the phosphor normalized to a maximum value of 1 for mammography (A; top) and radiography (B; bottom).
Fig. 6.

The depth-dependent excitation (red photon) flux, ϕexc(z), computed for mammography and radiography.
Fig. 7.

The depth-dependent bleaching efficiency, g5(z), and escape efficiency, g6(z), computed for mammography (A; top) and radiography (B; bottom).
The depth of interaction weighted point spread function (PSF) of the PSL computed using (25) is shown in Fig. 8. In order to quantify the effect of the finite dimension of the Gaussian laser beam, the PSF is shown with and without convolution of the laser beam. The PSF is narrower for mammography due to thinner storage phosphor layer and absorptive backing, consistent with expectations.
Fig. 8.

The depth-weighted point spread function (PSF), ϕ(r), before (represented as “w/o Laser”) and after (represented as “with Laser”) convolution with the Gaussian Laser beam for mammography and radiography.
Fig. 9 shows the various sources of blurring that contribute to the system MTF for mammography (left panels; A & B) and radiography (right panels; C & D), computed up to twice the Nyquist frequency. The top panels (A & C) show the characteristic transfer functions of each of the K-emission lines, and the characteristic transfer function, TK, obtained by weighting their relative intensities using (12). In the bottom panels (B & D), in addition to TK, the depth-weighted PSL spread function from a stationary Gaussian laser beam, the spread function due to the translation of the PSP in the subscan direction represented as sinc(πvssτD), and the pixel aperture function that represents the spacing between adjacent scan lines, Tpix, are shown. The resultant system MTF, Tsys, with and without the blurring due to finite dimension of the Gaussian laser beam computed using data in Fig. 8, is also shown.
Fig. 9.

Sources that contribute to the system MTF. Left (A & B): Mammography; Right (C & D): Radiography. Top (A & C): Characteristic transfer function of Kα1, Kα2 and Kβ1 emission lines, weighted by their relative intensities to obtain TK. Bottom (B & D): In addition to TK, the depth-weighted PSL spread function, , the spread function due to imaging plate translation along the subscan direction, represented as sinc(πνssτD), and the pixel aperture function representing the spacing between adjacent scan lines, Tpix are shown. The resultant system MTF, Tsys and the effect of the Gaussian Laser beam are also shown.
Fig. 10 shows the system presampling MTF along the subscan direction, which is the direction orthogonal to laser movement obtained for mammography (top; A) and radiography (bottom; B). In this direction, the temporal filter is not applied and is hence more representative of the inherent system characteristics. In each graph, the system presampling MTF is plotted up to twice the Nyquist frequency. Also, the experimentally determined presampling MTF as provided in [18, 24] is included to facilitate direct comparison with experimental results.
Fig. 10.

System presampling MTF along the subscan direction, Tsys, for mammography (A; top) and radiography (B; bottom). Experimental data points are shown as filled-in symbols and model results are shown as lines.
Fig. 11 shows the various noise sources that contribute to the normalized NPS along the subscan direction, computed as W9(v)/[q9(0)]2, for mammography at various exposure levels. The noise sources include x-ray quantum and photon noise, x-ray structural noise, granular noise and additive electronic noise (shown only in A), which represent the terms 1 through 4 in (41). Fig. 12 shows the noise sources that contribute to the normalized NPS for radiography.
Fig. 11.

Components of the normalized NPS along the subscan direction, W9(v)/[q9(0)]2 including the granular, x-ray structural, and electronic noise (shown in A, only), for mammography.
Fig. 12.

Components of the normalized NPS along the subscan direction, W9(v)/[q9(0)]2 including the granular, x-ray structural, and electronic noise (shown in A, only), for radiography.
The optical collection efficiency, , that was considered to provide the best match to the reported DQE(0.5, Xmin) was determined from Fig. 13A. The grain size distribution parameter M that was considered to provide the best choice to achieve the reported exposure dependence [18, 24] was determined from Fig. 13B. Fig. 14 shows the system DQE along the subscan direction for mammography (top; A) and radiography (bottom; B). In each graph, the experimentally determined DQE [18, 24] is shown as filled-in symbols and the estimates obtained from modeling is shown as lines with corresponding open symbols. In each graph, the legend is in the same order as the zero-frequency DQE. Analysis of trends in the difference in DQE between experimental data and model results were performed using the root mean squared metric (RMSD) and are shown in Fig. 15.
Fig. 13.

A: Plot of absolute deviation in DQE(0.5, Xmin) vs. optical collection efficiency, . Minimum values were found to occur at and for mammography and radiography, respectively. B: Plot of chi-squared statistic value, vs. grain size parameter, M. Minimum values of were found to occur at M = 1.27 and M = 1.6825 for mammography and radiography, respectively.
Fig. 14.

System DQE along the subscan direction, DQE(v) for mammography (A; top) and radiography (B; bottom). Experimental data points are shown as filled-in symbols and model results are shown as lines with open symbols corresponding to experimental data. The legend is in the same order as the zero-frequency DQE.
Fig. 15.

Root Mean Squared Difference (RMSD) in DQE(0.5) between model and experimental results plotted as a function of spatial frequency (top panels; A & C) and exposure (bottom panels; B & D) for mammography (left panels; A & B) and radiography (right panels; C & D).
Work function ranging from 125 eV to 360 eV and optical collection efficiency, ranging from 0.1 to 0.33 have been reported, which contribute to a range of values for system gain. Fig. 16 shows the percent (%) change in DQE(0.5) as a function of exposure for the range of system gain values that were obtained for various values of work function (125 eV to 360 eV) and optical collection efficiency (0.1 to 0.4).
Fig. 16.

Percent (%) change in DQE(0.5) as a function of exposure over the range of gain values obtained by varying work function (125 eV to 360 eV) and optical collection efficiency (0.1 to 0.4), for mammography (A; top) and radiography (B; bottom).
The effect of protective layer (PET) on imaging performance metrics were determined by performing simulations with and without the protective layer. Fig. 17 shows the results from these simulations in terms of depth-dependent excitation flux, and point spread function of red photon, collection and bleaching efficiencies, and system presampling MTF.
Fig. 17.

Effect of protective layer (PET) on excitation flux (top left; A) and point spread function (top right; C) for both mammography and radiography. The effect of protective layer on bleaching and escape efficiencies (bottom left; B), and system presampling MTF (bottom right; D) for mammography.
IV. Discussion
The photon fluence per unit exposure, , was estimated for mammography and radiography using Fig. 4 and are listed in Table III. Our estimate of for mammography was larger by 13.4% compared to that stated in [24], as we matched the 1st HVL to that reported in the experimental study [24]. In addition to possible differences in x-ray anode target angle (which was assumed as 16° in our simulation), this may have been due in part to the use of pure Al as the added filtration material in our simulation, whereas the experiments were conducted using type 1100 alloy of Al. Hence, we scaled the exposure in our simulations using mammography spectrum to match the reported in [24]. For radiography, our estimate of was larger by 1.4% compared to that stated in [18]. Since the HVL was not specified for the x-ray spectrum in [18], we used the specified filtration material and thickness and varied the inherent filtration of the x-ray tube to match the stated in [18].
The XCOM database of NIST [71] provides the component of the photoelectric mass attenuation coefficient relating to the isolated K-shell orbital for elements. Hence, for the storage phosphors considered estimates of ζ were obtained by weighting using the mixture rule. The computed values of (ζω)Ki and fKi for each characteristic emission line, and the intensity weighted ζω and fK are summarized in Table III. The reabsorption probability, fK, is lower with radiography due to the higher energy of the K-characteristic emission energies compared to mammography.
The depth-dependent excitation photon fluence in Fig. 6 shows that there is a more rapid decrease in fluence with increasing depth for mammography than for radiography. This observation is consistent with the absorptive backing for the PSP plate used for mammography compared to the reflective backing for the PSP plate used for radiography. Fig. 7 shows the depth-dependent bleaching efficiency, g5(z), and escape efficiency, g6(z). While g5(z) is related non linearly with the excitation photon fluence [34], as shown in (22), the aforementioned observation resulted in a more rapid decrease in bleaching efficiency with increasing depth for mammography than radiography. However, this resulted only in a modest difference in depth-weighted bleaching efficiency, , between mammography and radiography due to the exponential depth-dependence of x-ray photon attenuation, g1(z). While the depth-weighted escape efficiency, are similar for both mammography and radiography (Table III), linear fits to the depth-dependent escape efficiency g6(z) for mammography and radiography showed that the slopes (−4.5×103 μm−1 for mammography and (−2.7×103 μm−1 for radiography) were different. The increased slope observed with mammography compared to radiography is consistent with the use of absorptive backing with mammography compared to the use of reflective backing with radiography in our simulations.
Fig. 8 shows the depth-weighted point spread function (PSF), ϕ(r) for mammography and radiography that indicates a wider spread for radiography than mammography, consistent with expectations. Fig. 9 shows the contribution of various sources to the system MTF. The characteristic transfer functions (top panels; A & C) of each of the K-emission lines and the intensity-weighted K-characteristic transfer function, TK for mammography (left; A & B) and radiography(right; C & D) show that it may be sufficient to approximate TK with TKα1. Further, from Table III, it can be observed that the values of (ζω)Kα1 and fKα1 are similar to ζω and fK, respectively. Thus, for the conditions simulated it may be sufficient to perform these simulations for Kα1 emission line. For both mammography and radiography, the depth-weighted PSL spread function, was observed to contribute the most to the system MTF. It is relevant to note that the contribution of TK to the system MTF is only through path C of stage 2 (Fig. 3). While the point spread function, ϕ(r) shown in Fig. 8 prior to convolution with the Gaussian laser beam was noticeably different than that after convolution; the contribution of laser beam was modest, with a more noticeable decrease in system MTF (Fig. 9 B & D) for mammography than radiography.
The system presampling MTF obtained from modeling (Fig. 10) shows reasonably good agreement with experimental results [18, 24] for both mammography and radiography. For radiography, the theoretical model predicted slightly higher values for spatial frequencies up to ~ fNyq. For mammography, a similar observation can be made for spatial frequencies up to ~0.5 fNyq. Since the values used in these simulations were obtained from several sources and thus might not be representative of the systems used in the experimental studies [18, 24], the general agreement between the simulation and experimental results may suggest that the values used in these simulations were reasonably correct or may be fortuitous.
The contribution from various sources to the normalized NPS shown in Figs. 11 and 12 indicate the with increasing exposure levels, the contribution of granular noise increases. In the normalized form of the NPS, i.e., W9(v)/[q9(0)]2, the amplitude of the granular and x-ray structural noise are exposure independent, whereas the x-ray quantum and photon noise decrease with increasing exposure. The additive electronic noise was negligible even at the lowest exposure level considered in the simulations.
Fig. 13 was used to determine the values of optical collection efficiency, , and grain size distribution parameter, M, that provide best match to reported experimental data [18, 24]. Minimum absolute deviation in DQE(0.5, Xmin) between the model and experimental data were found to occur with and for mammography and radiography, respectively. Minima of were found to occur at M = 1.27 and M = 1.685 for mammography and radiography, respectively. Values of , M, S and are summarized in Table III. The best choice of distribution parameters indicate that as the mean grain size is reduced, the variance in grain size increases, which is qualitatively consistent with that observed by Li et al [77].
The system DQE obtained from the model and shown in Fig. 14 demonstrate reasonably good agreement with experimental results [18, 24]. The root mean squared difference (RMSD) between the model results and experimental data computed for mammography and radiography were 0.05 and 0.02, respectively indicating better agreement for radiography than mammography. Considering the lack of specific knowledge of these systems, the agreement is good. Analysis of trends in the difference in DQE between model and experimental data, performed using the RMSD metric is shown in Fig. 15. In general, RMSD was higher at mid-spatial frequencies (top panels; A & C) and at mid levels of exposures (bottom panels; B & D) within the range considered. However, neither for mammography (left panels; A & B) nor for radiography (right panels; C & D), does RMSD exhibit monotonic trends.
All of the aforementioned discussion was based on results along the subscan direction. Along the scan direction and with the assumption of a linear output amplifier in our model, the temporal (Butterworth) filter will reduce the MTF by a factor of Tf(u), and the NPS by a factor of . However, DQE(u) will not depend on the choice of the filter, provided its response is zero above the Nyquist frequency. DQE(u) and DQE(v) may not be identical in part due to noise aliasing along subscan direction, and in part due to the difference in the product terms TPSL(u) Tf(u) and TPSL(v) Tpix(v).
Values of work function from 125 eV to 360 eV, and optical collection efficiency from 0.1 to 0.33 have been reported, which results in a range of values for the system gain. We varied the optical collection efficiency from 0.1 to 0.4, and work function from 125 eV to 360 eV, resulting in system gain values from 0.3 to 3.4 for mammography, and 0.93 to 11.5 for radiography. This system gain range constitutes a 81% (65%) reduction to 115% (329%) increase from the values stated in Table III for mammography (radiography). Analysis of the effect of system gain on the exposure dependent DQE(0.5) shown in Fig. 16, indicate that when the system gain is varied, its effect diminishes with increasing exposure. This is due to the increasing contribution of granular noise to the system NPS with increasing exposure. The plot also indicates that the change in DQE(0.5) is non-linearly related to system gain. As an example, at a typical mammography exposure of ~10 mR, a 115% increase in gain would result in ~17% improvement in DQE(0.5), whereas a 81% decrease in gain is sufficient to cause ~55% reduction in DQE(0.5). It appears within the range of possible gain values, the mammography system operates closer to the upper bound than the radiography system. It is relevant to note that the experimental data reported by Dobbins et al. [18] and used to represent radiography in this study represents CR technology that is two generations older than that reported by Fetterly et al [24].
In equations 39 through 41, several of the gain terms appear as products. While and always appear as a product, the terms , and need to be determined individually. Empirical determination of some of the gain parameters is straight forward (e.g., , and ); however, others may be more difficult. Techniques for determination of g5(z) (and hence , as in eqn. 23), and the conversion efficiency, and hence , have been described [34, 59, 79]. Since, and always appear as a product, it is sufficient to obtain the value of the product . This implies that an error in estimating one parameter may be offset by an opposing error in the other. Knowledge of these gain terms would be sufficient to obtain a reasonable estimate of DQE at low exposures, where the granular noise is minimal. However, at higher exposures, where granular noise is substantial, knowledge of the grain size distribution is also needed to model the imaging performance.
Monte Carlo modeling of imaging performance in terms of MTF have been reported with storage phosphors that do not have a protective layer [32]. Hence, we performed simulations without the protective layer. In Fig. 17, it is observed that the protective layer causes a reduction in excitation flux, resulting in a small reduction in depth-dependent bleaching efficiency. Also, the protective layer results in broadening of the point spread function, resulting in a decrease in system MTF. This effect was more noticeable for mammography than radiography and hence, only the system MTF with and without the protective layer for mammography is shown. For mammography, a noticeable improvement in depth-dependent escape efficiency is observed without the protective layer.
The model in its current form does not account for Lubberts’ effect [80], and we are currently working on improving the model. This model is only applicable when the dwell time is substantially larger than the luminescent lifetime of the storage phosphor. If the dwell time is comparable to the luminescent lifetime of the storage phosphor then a spatiotemporal model of image formation may be required. While the model includes the effect of the protective layer, it does not include optical scatter and associated glare from components of the CR reader. The model can be adapted to include these effects, provided precise knowledge of the position of these components in relation to the PSP plate and laser beam are known. In the past, glare fraction of 6.5% have been reported for FCR-101 (Fuji Photofilm Co., Japan) reader with Fuji ST-II PSP plates [81]. The model can also be extended to CR systems that use newer generation of needle storage phosphors and to dual-read CR systems.
V. Conclusion
In summary, this work describes a framework for modeling the performance of CR systems in terms of objective metrics of image quality. Results from the model for conditions appropriate for mammography and radiography indicate good agreement with published experimental data in terms of the system MTF and system DQE, and is indicative that the modeling framework described in here could serve as tool for identifying and optimizing CR technology. As with any modeling, in addition to the model itself, the accuracy of the model results is greatly influenced by the choice of parameter values. This work reiterates the need for accurate determination of material and optical properties of PSP plates.
Acknowledgments
This work was supported in part by the National Institutes of Health (NIH) and National Institute of Biomedical Imaging and Bioengineering (NIBIB) Grant R01EB004015.
Footnotes
The contents of this work are the sole responsibility of the authors and do not represent the official views of the NIH or NIBIB.
Some contents of this work were presented at the 49th Annual Meeting of the American Association of Physicists in Medicine (AAPM), Minneapolis, MN.
Contributor Information
Srinivasan Vedantham, Department of Radiology, University of Massachusetts Medical School, Worcester, MA 01655 USA.
Andrew Karellas, Department of Radiology, University of Massachusetts Medical School, Worcester, MA 01655 USA.
References
- 1.Sonoda M, Takano M, Miyahara J, Kato H. Computed radiography utilizing scanning laser stimulated luminescence. Radiology. 1983 Sep;148:833–8. doi: 10.1148/radiology.148.3.6878707. [DOI] [PubMed] [Google Scholar]
- 2.Fajardo LL, Hillman BJ, Hunter TB, Claypool HR, Westerman BR, Mockbee B. Excretory urography using computed radiography. Radiology. 1987 Feb;162:345–51. doi: 10.1148/radiology.162.2.3797646. [DOI] [PubMed] [Google Scholar]
- 3.Lindhardt FE. Clinical experiences with computed radiography. Eur J Radiol. 1996 Jun;22:175–85. doi: 10.1016/0720-048x(96)89640-9. [DOI] [PubMed] [Google Scholar]
- 4.Seibert JA, Shelton DK, Moore EH. Computed radiography X-ray exposure trends. Acad Radiol. 1996 Apr;3:313–8. doi: 10.1016/s1076-6332(96)80247-9. [DOI] [PubMed] [Google Scholar]
- 5.Sherrier RH, Chotas HG, Johnson GA, Chiles C, Ravin CE. Image optimization in a computed-radiography/photostimulable-phosphor system. J Digit Imaging. 1989 Nov;2:212–9. doi: 10.1007/BF03170408. [DOI] [PubMed] [Google Scholar]
- 6.Bernhardt TM, Otto D, Reichel G, Ludwig K, Seifert S, Kropf S, Rapp-Bernhardt U. Detection of simulated interstitial lung disease and catheters with selenium, storage phosphor, and film-based radiography. Radiology. 1999 Nov;213:445–54. doi: 10.1148/radiology.213.2.r99nv20445. [DOI] [PubMed] [Google Scholar]
- 7.Sanada S, Doi K, Xu XW, Yin FF, Giger ML, MacMahon H. Comparison of imaging properties of a computed radiography system and screen-film systems. Med Phys. 1991 May-Jun;18:414–20. doi: 10.1118/1.596688. [DOI] [PubMed] [Google Scholar]
- 8.Schaefer CM, Greene R, Oestmann JW, Hall DA, Llewellyn HJ, McCarthy KA, Pile-Spellman ER, Rubens JR. Digital storage phosphor imaging versus conventional film radiography in CT-documented chest disease. Radiology. 1990 Jan;174:207–10. doi: 10.1148/radiology.174.1.2294549. [DOI] [PubMed] [Google Scholar]
- 9.Samei E, Hill JG, Frey GD, Southgate WM, Mah E, Delong D. Evaluation of a flat panel digital radiographic system for low-dose portable imaging of neonates. Med Phys. 2003 Apr;30:601–7. doi: 10.1118/1.1556611. [DOI] [PubMed] [Google Scholar]
- 10.Rong XJ, Shaw CC, Liu X, Lemacks MR, Thompson SK. Comparison of an amorphous silicon/cesium iodide flat-panel digital chest radiography system with screen/film and computed radiography systems--a contrast-detail phantom study. Medical Physics. 2001;28:2328–35. doi: 10.1118/1.1408620. [DOI] [PubMed] [Google Scholar]
- 11.Zahringer M, Hesselmann V, Schulte O, Kamm KF, Braun W, Haupt G, Krug B, Lackner K. Reducing the radiation dose during excretory urography: flat-panel silicon x-ray detector versus computed radiography. AJR Am J Roentgenol. 2003 Oct;181:931–7. doi: 10.2214/ajr.181.4.1810931. [DOI] [PubMed] [Google Scholar]
- 12.Bacher K, Smeets P, Bonnarens K, De Hauwere A, Verstraete K, Thierens H. Dose reduction in patients undergoing chest imaging: digital amorphous silicon flat-panel detector radiography versus conventional film-screen radiography and phosphor-based computed radiography. AJR Am J Roentgenol. 2003 Oct;181:923–9. doi: 10.2214/ajr.181.4.1810923. [DOI] [PubMed] [Google Scholar]
- 13.Peer S, Neitzel U, Giacomuzzi SM, Peer R, Gassner E, Steingruber I, Jaschke W. Comparison of low-contrast detail perception on storage phosphor radiographs and digital flat panel detector images. IEEE Transactions on Medical Imaging. 2001;20:239–42. doi: 10.1109/42.918474. [DOI] [PubMed] [Google Scholar]
- 14.Flynn MJ, Samei E. Experimental comparison of noise and resolution for 2k and 4k storage phosphor radiography systems. Med Phys. 1999 Aug;26:1612–23. doi: 10.1118/1.598656. [DOI] [PubMed] [Google Scholar]
- 15.Fetterly KA, Hangiandreou NJ. Image quality evaluation of a desktop computed radiography system. Med Phys. 2000 Dec;27:2669–79. doi: 10.1118/1.1326449. [DOI] [PubMed] [Google Scholar]
- 16.Fetterly KA, Hangiandreou NJ. Effects of x-ray spectra on the DQE of a computed radiography system. Med Phys. 2001 Feb;28:241–9. doi: 10.1118/1.1339883. [DOI] [PubMed] [Google Scholar]
- 17.Bradford CD, Peppler WW, Dobbins JT., 3rd Performance characteristics of a Kodak computed radiography system. Med Phys. 1999 Jan;26:27–37. doi: 10.1118/1.598781. [DOI] [PubMed] [Google Scholar]
- 18.Dobbins JT, 3rd, Ergun DL, Rutz L, Hinshaw DA, Blume H, Clark DC. DQE(f) of four generations of computed radiography acquisition devices. Med Phys. 1995 Oct;22:1581–93. doi: 10.1118/1.597627. [DOI] [PubMed] [Google Scholar]
- 19.Nakano Y, Gido T, Honda S, Maezawa A, Wakamatsu H, Yanagita T. Improved computed radiography image quality from a BaFl:Eu photostimulable phosphor plate. Med Phys. 2002 Apr;29:592–7. doi: 10.1118/1.1462639. [DOI] [PubMed] [Google Scholar]
- 20.Samei E, Flynn MJ. An experimental comparison of detector performance for computed radiography systems. Med Phys. 2002 Apr;29:447–59. doi: 10.1118/1.1449873. [DOI] [PubMed] [Google Scholar]
- 21.Kengyelics SM, Davies AG, Cowen AR. A comparison of the physical imaging properties of Fuji ST-V, ST-VA, and ST-VN computed radiography image plates. Med Phys. 1998 Nov;25:2163–9. doi: 10.1118/1.598412. [DOI] [PubMed] [Google Scholar]
- 22.Kengyelics SM, Launders JH, Cowen AR. Physical imaging performance of a compact computed radiography acquisition device. Med Phys. 1998 Mar;25:354–60. doi: 10.1118/1.598212. [DOI] [PubMed] [Google Scholar]
- 23.Zhang D, Liu H, Wu X. DQE analysis on a dual detector phase x-ray imaging system. Phys Med Biol. 2008 Sep 21;53:5165–76. doi: 10.1088/0031-9155/53/18/021. [DOI] [PubMed] [Google Scholar]
- 24.Fetterly KA, Schueler BA. Performance evaluation of a “dual-side read” dedicated mammography computed radiography system. Med Phys. 2003 Jul;30:1843–54. doi: 10.1118/1.1584045. [DOI] [PubMed] [Google Scholar]
- 25.Seibert JA, Boone JM, Cooper VN, Lindfors KK. Cassette-based digital mammography. Technol Cancer Res Treat. 2004 Oct;3:413–27. doi: 10.1177/153303460400300502. [DOI] [PubMed] [Google Scholar]
- 26.Monnin P, Holzer Z, Wolf R, Neitzel U, Vock P, Gudinchet F, Verdun FR. An image quality comparison of standard and dual-side read CR systems for pediatric radiology. Med Phys. 2006 Feb;33:411–20. doi: 10.1118/1.2163392. [DOI] [PubMed] [Google Scholar]
- 27.Rivetti S, Lanconelli N, Campanini R, Bertolini M, Borasi G, Nitrosi A, Danielli C, Angelini L, Maggi S. Comparison of different commercial FFDM units by means of physical characterization and contrast-detail analysis. Med Phys. 2006 Nov;33:4198–209. doi: 10.1118/1.2358195. [DOI] [PubMed] [Google Scholar]
- 28.Riccardi L, Cauzzo MC, Fabbris R, Tonini E, Righetto R. Comparison between a built-in “dual side” chest imaging device and a standard “single side” CR. Med Phys. 2007 Jan;34:119–26. doi: 10.1118/1.2400619. [DOI] [PubMed] [Google Scholar]
- 29.Mackenzie A, Honey ID. Characterization of noise sources for two generations of computed radiography systems using powder and crystalline photostimulable phosphors. Med Phys. 2007 Aug;34:3345–57. doi: 10.1118/1.2750973. [DOI] [PubMed] [Google Scholar]
- 30.Cowen AR, Davies AG, Kengyelics SM. Advances in computed radiography systems and their physical imaging characteristics. Clin Radiol. 2007 Dec;62:1132–41. doi: 10.1016/j.crad.2007.07.009. [DOI] [PubMed] [Google Scholar]
- 31.Schaetzing R, Fasbender R, Kersten P. New high-speed scanning technique for computed radiography. In: Antonuk LE, Yaffe MJ, editors. Medical Imaging 2002: Physics of Medical Imaging, Proc. SPIE. Vol. 4682. 2002. pp. 511–520. [Google Scholar]
- 32.Fasbender R, Li H, Winnacker A. Monte Carlo modeling of storage phosphor plate readouts. Nucl Instrum Methods Phys Res A. 2003 Oct 21;512:610–618. [Google Scholar]
- 33.Thoms M, Seggern Hv. Method for the determination of photostimulable defect center concentrations, production rates, and effective formation energies. Journal of Applied Physics. 1994;75:4658–4661. [Google Scholar]
- 34.Thoms M. The quantum efficiency of radiographic imaging with image plates. Nucl Instrum Methods Phys Res A. 1996 Aug 21;378:598–611. [Google Scholar]
- 35.Ganguly A, Rudin S, Bednarek DR, Hoffmann KR. Micro-angiography for neuro-vascular imaging. II. Cascade model analysis. Med Phys. 2003 Nov;30:3029–39. doi: 10.1118/1.1617550. [DOI] [PubMed] [Google Scholar]
- 36.Siewerdsen JH, Antonuk LE, el-Mohri Y, Yorkston J, Huang W, Boudry JM, Cunningham IA. Empirical and theoretical investigation of the noise performance of indirect detection, active matrix flat-panel imagers (AMFPIs) for diagnostic radiology. Med Phys. 1997 Jan;24:71–89. doi: 10.1118/1.597919. [DOI] [PubMed] [Google Scholar]
- 37.Vedantham S, Karellas A, Suryanarayanan S. Solid-state fluoroscopic imager for high-resolution angiography: parallel-cascaded linear systems analysis. Med Phys. 2004 May;31:1258–68. doi: 10.1118/1.1689014. [DOI] [PMC free article] [PubMed] [Google Scholar]
- 38.Suryanarayanan S, Karellas A, Vedantham S, Sechopoulos I. Theoretical analysis of high-resolution digital mammography. Phys Med Biol. 2006 Jun 21;51:3041–55. doi: 10.1088/0031-9155/51/12/003. [DOI] [PubMed] [Google Scholar]
- 39.Metz CE, Doi K. Transfer function analysis of radiographic imaging systems. Phys Med Biol. 1979 Nov;24:1079–106. doi: 10.1088/0031-9155/24/6/001. [DOI] [PubMed] [Google Scholar]
- 40.Barrett HH, Swindell W. Radiological Imaging – The Theory of Image Formation, Detection and Processing. New York, NY: Academic Press; 1981. Revised ed. [Google Scholar]
- 41.Cunningham IA. Linear-systems Modeling of Parallel-cascaded Stochastic Processes: The NPS of Radiographic Screens with Reabsorption of Characteristic X Radiation. Proc SPIE. 1998:220–230. [Google Scholar]
- 42.Cunningham IA. Applied linear-systems theory. In: Beutel J, Kundel HL, Van Metter R, editors. Handbook of Medical Imaging. Vol. 1: Physics and Psychophysics. Bellingham, WA: SPIE Press; 2000. pp. 79–160. [Google Scholar]
- 43.Cunningham IA, Moschandreou T, Subotic V. The Detective Quantum Efficiency of Fluoroscopic Systems: The Case for a Spatial-Temporal Approach (Or, Does the Ideal Observer have Infinite Patience?) Proc SPIE. 2001:479–488. [Google Scholar]
- 44.Cunningham IA, Yao J, Subotic V. Cascaded Models and the DQE of Flat-Panel Imagers: Noise Aliasing, Secondary Quantum Noise and Reabsorption. Proc SPIE. 2002:61–72. [Google Scholar]
- 45.Yao J, Cunningham IA. Parallel cascades: new ways to describe noise transfer in medical imaging systems. Med Phys. 2001 Oct;28:2020–38. doi: 10.1118/1.1405842. [DOI] [PubMed] [Google Scholar]
- 46.Rabbani M, Shaw R, Van Metter R. Detective Quantum Efficiency of Imaging-Systems with Amplifying and Scattering Mechanisms. J Opt Soc Am A Opt Image Sci Vis. 1987 May;4:895–901. doi: 10.1364/josaa.4.000895. [DOI] [PubMed] [Google Scholar]
- 47.Rabbani M, Van Metter R. Analysis of Signal and Noise-Propagation for Several Imaging Mechanisms. J Opt Soc Am A Opt Image Sci Vis. 1989 Aug;6:1156–1164. [Google Scholar]
- 48.Van Metter R, Rabbani M. An application of multivariate moment-generating functions to the analysis of signal and noise propagation in radiographic screen-film systems. Med Phys. 1990 Jan-Feb;17:65–71. doi: 10.1118/1.596529. [DOI] [PubMed] [Google Scholar]
- 49.Zhao W, Ji WG, Rowlands JA. Effects of characteristic x rays on the noise power spectra and detective quantum efficiency of photoconductive x-ray detectors. Med Phys. 2001 Oct;28:2039–49. doi: 10.1118/1.1405845. [DOI] [PubMed] [Google Scholar]
- 50.Barrett HH, Myers KJ. Image Science: Mathematical and Statistical Foundations. New York, NY: Wiley; 2001. [Google Scholar]
- 51.Dainty JC, Shaw R. Image Science. San Diego, CA: Academic Press; 1974. [Google Scholar]
- 52.Liaparinos PF, Kandarakis IS, Cavouras DA, Delis HB, Panayiotakis GS. Modeling granular phosphor screens by Monte Carlo methods. Med Phys. 2006 Dec;33:4502–14. doi: 10.1118/1.2372217. [DOI] [PubMed] [Google Scholar]
- 53.Takahashi K. Fuji Computed Radiography: Technical Review No. 14 - Imaging Plate (IP) Fuji Photo Film Co., Ltd; Tokyo, Japan: 2002. [Google Scholar]
- 54.Vedantham S, Karellas A, Suryanarayanan S, Albagli D, Han S, Tkaczyk EJ, Landberg CE, Opsahl-Ong B, Granfors PR, Levis I, D’Orsi CJ, Hendrick RE. Full breast digital mammography with an amorphous silicon-based flat panel detector: physical characteristics of a clinical prototype. Med Phys. 2000 Mar;27:558–67. doi: 10.1118/1.598895. [DOI] [PMC free article] [PubMed] [Google Scholar]
- 55.Vedantham S, Karellas A, Suryanarayanan S, Onishi SK. Solid-state fluoroscopic imager for high-resolution angiography: physical characteristics of an 8 cm × 8 cm experimental prototype. Med Phys. 2004 Jun;31:1462–72. doi: 10.1118/1.1750992. [DOI] [PMC free article] [PubMed] [Google Scholar]
- 56.Rowlands JA. The physics of computed radiography. Phys Med Biol. 2002 Dec 7;47:R123–66. doi: 10.1088/0031-9155/47/23/201. [DOI] [PubMed] [Google Scholar]
- 57.Del Bianco S, Martelli F, Cignini F, Zaccanti G, Pifferi A, Torricelli A, Bassi A, Taroni P, Cubeddu R. Liquid phantom for investigating light propagation through layered diffusive media. Optics Express. 2004;12:2102–2111. doi: 10.1364/opex.12.002102. [DOI] [PubMed] [Google Scholar]
- 58.Matsuda T, Arakawa S, Koda K, Torii S, Nakajima N. Fuji Computed Radiography: Technical Review No. 2 - New technical developments in the FCR9000. Fuji Photo Film Co Ltd; Japan: 1993. [Google Scholar]
- 59.Thoms M, Von Seggern H. Radiographic imaging with image plates: The influence of the readout intensity on the image quality. J Appl Phys. 1997;81:5887–5895. [Google Scholar]
- 60.Ogawa E, Arakawa S, Ishida M, Kato H. Quantitative analysis of imaging performance for computed radiography systems. In: Van Metter RL, Beutel J, editors. Medical Imaging 1995: Physics of Medical Imaging, Proc. of SPIE. Vol. 2432. SPIE; 1995. pp. 421–431. [Google Scholar]
- 61.Kurobori T, Inabe K, Aoshima S, Itoh T, Takeuchi M, Radzhabov E. Time-resolved study and molecular dynamics simulation of defect centers in BaFX (X = Cl, Br) crystals. Journal of Luminescence. 2000 May;87–9:558–560. [Google Scholar]
- 62.Gunde MK, Logar JK, Orel ZC, Orel B. Optimum thickness determination to maximise the spectral selectivity of black pigmented coatings for solar collectors. Thin Solid Films. 1996 May;277:185–191. [Google Scholar]
- 63.DuPont. DuPont™ Ti-Pure® titanium dioxide - Titanium Dioxide for Coatings. 2007. [Google Scholar]
- 64.Akl AA, Kamal H, Abdel-Hady K. Fabrication and characterization of sputtered titanium dioxide films. Applied Surface Science. 2006 Oct;252:8651–8656. [Google Scholar]
- 65.Prahl SA. Mie Scattering Calculator. Oregon Medical Laser Center; Portland, OR: 2007. Available: http://omlc.ogi.edu/calc/mie_calc.html. [Google Scholar]
- 66.IPEM. Produced for the diagnostic radiology and magnetic resonance special interest group. The Institute of Physics and Engineering in Medicine; 1997. Catalogue of diagnostic x-ray spectra and other data. Report No. 78. CD-ROM, Electronic version prepared by Sutton, D. [Google Scholar]
- 67.Johns HE, Cunningham JR. The Physics of Radiology. 4. Springfield, IL: C. C. Thomas; 1983. [Google Scholar]
- 68.Berger MJ, Hubbell JH, Seltzer SM, Chang J, Coursey JS, Sukumar R, Zucker DS. XCOM: Photon Cross Sections Database, NIST Standard Reference Database 8 (XGAM) National Institute of Standards and Technology; Gaithersburg, MD: 2005. Available: http://physics.nist.gov/PhysRefData/Xcom/Text/XCOM.html. [Google Scholar]
- 69.Barnes GT. Radiographic mottle: a comprehensive theory. Med Phys. 1982 Sep-Oct;9:656–67. doi: 10.1118/1.595126. [DOI] [PubMed] [Google Scholar]
- 70.Kortright JB, Thompson AC. X-ray Data Booklet. Section 1.2 X-ray Emission Energies. Berkeley, CA: 2000. Available: http://xdb.lbl.gov/Section1/Sec_1-2.html. [Google Scholar]
- 71.Chantler CT, Olsen K, Dragoset RA, Kishore AR, Kotochigova SA, Zucker DS. X-Ray Form Factor, Attenuation and Scattering Tables (Version 2.0) Gaithersburg, MD: 2003. Available: http://physics.nist.gov/ffast. [Google Scholar]
- 72.Chan HP, Doi K. Energy and angular dependence of x-ray absorption and its effect on radiographic response in screen--film systems. Phys Med Biol. 1983 May;28:565–79. doi: 10.1088/0031-9155/28/5/009. [DOI] [PubMed] [Google Scholar]
- 73.Metz CE, Vyborny CJ. Wiener spectral effects of spatial correlation between the sites of characteristic x-ray emission and reabsorption in radiographic screen-film systems. Phys Med Biol. 1983 May;28:547–64. doi: 10.1088/0031-9155/28/5/008. [DOI] [PubMed] [Google Scholar]
- 74.Jacques SL. Light distributions from point, line and plane sources for photochemical reactions and fluorescence in turbid biological tissues. Photochem Photobiol. 1998 Jan;67:23–32. [PubMed] [Google Scholar]
- 75.Wang LH, Jacques SL, Zheng LQ. MCML - Monte-Carlo Modeling of Light Transport in Multilayered Tissues. Computer Methods and Programs in Biomedicine. 1995 Jul;47:131–146. doi: 10.1016/0169-2607(95)01640-f. [DOI] [PubMed] [Google Scholar]
- 76.Wang LH, Jacques SL, Zheng LQ. CONV - convolution for responses to a finite diameter photon beam incident on multi-layered tissues. Computer Methods and Programs in Biomedicine. 1997 Nov;54:141–150. doi: 10.1016/s0169-2607(97)00021-7. [DOI] [PubMed] [Google Scholar]
- 77.Li H, Hackenschmied P, Epelbaum E, Batentschuk M. Imaging performance of polycrystalline BaFBr:Eu2+ storage phosphor plates. Materials Science and Engineering B. 2002;94:32–39. [Google Scholar]
- 78.Thoms M, Von Seggern H, Winnacker A. Spatial correlation and photostimulability of defect centers in the x-ray storage phosphor BaFBr:Eu2+ Phys Rev B. 1991;44:9240–9247. doi: 10.1103/physrevb.44.9240. [DOI] [PubMed] [Google Scholar]
- 79.Li HH, Gonzalez AL, Ji H, Duggan DM. Dose response of BaFBrl: Eu2+ storage phosphor plates exposed to megavoltage photon beams. Med Phys. 2007 Jan;34:103–11. doi: 10.1118/1.2400617. [DOI] [PubMed] [Google Scholar]
- 80.Lubberts G. Random Noise Produced by X-Ray Fluorescent Screens. Journal of the Optical Society of America. 1968;58:1475. [Google Scholar]
- 81.Fujita H, Morishita J, Ueda K, Tsai DY, Ohtsuka A, Fujikawa T. Resolution properties of a computed radiographic system. In: Dwyer SJ, Jost R, Schneider RH, editors. Proc of SPIE, Medical Imaging III: Image Formation. Vol. 1090. SPIE; 1989. pp. 263–275. [Google Scholar]