Abstract
Pancreatic ductal adenocarcinoma (PDAC) is an aggressive disease characterized by an intense fibrotic stromal response and deregulated metabolism1–4. The role of the stroma in PDAC biology is complex and it has been shown to play critical roles that differ depending on the biological context5–10. The stromal reaction also impairs the vasculature, leading to a highly hypoxic, nutrient-poor environment4,11,12. As such, these tumours must alter how they capture and use nutrients to support their metabolic needs11,13. Here we show that stroma-associated pancreatic stellate cells (PSCs) are critical for PDAC metabolism through the secretion of non-essential amino acids (NEAA). Specifically, we uncover a previously undescribed role for alanine, which outcompetes glucose and glutamine-derived carbon in PDAC to fuel the tricarboxylic acid (TCA) cycle, and thus NEAA and lipid biosynthesis. This shift in fuel source decreases the tumour’s dependence on glucose and serum-derived nutrients, which are limited in the pancreatic tumour microenvironment4,11. Moreover, we demonstrate that alanine secretion by PSCs is dependent on PSC autophagy, a process that is stimulated by cancer cells. Thus, our results demonstrate a novel metabolic interaction between PSCs and cancer cells, in which PSC-derived alanine acts as an alternative carbon source. This finding highlights a previously unappreciated metabolic network within pancreatic tumours in which diverse fuel sources are used to promote growth in an austere tumour microenvironment.
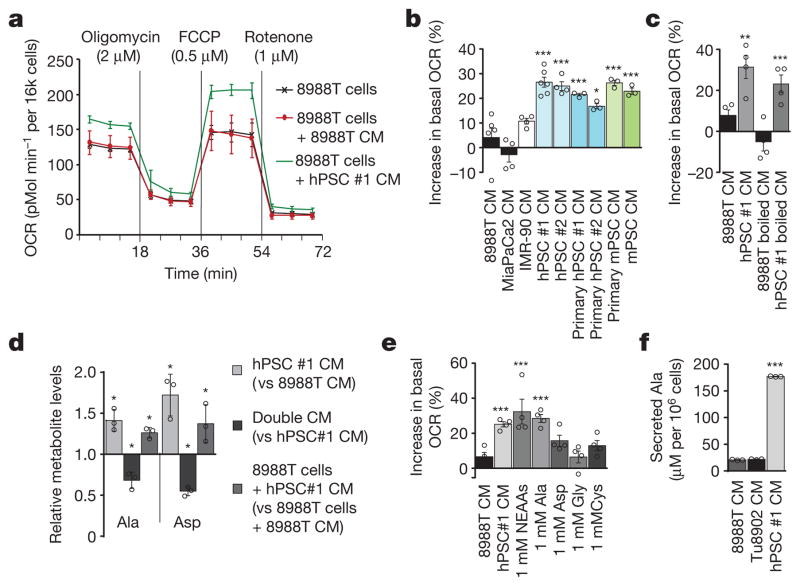
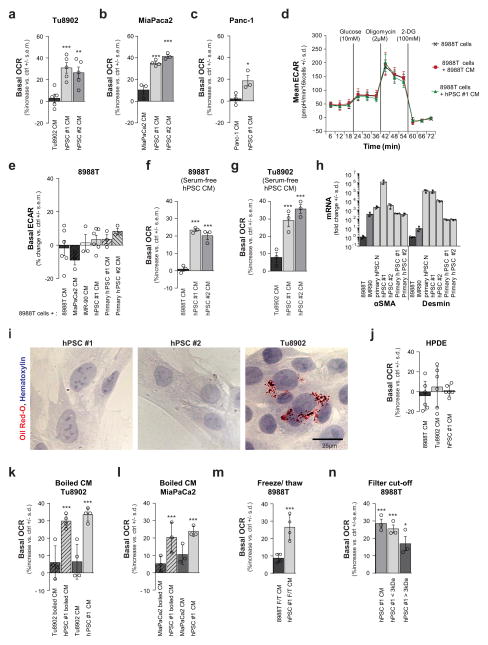
We previously demonstrated that metabolism is rewired in pancreatic cancer cells to facilitate biosynthesis and maintain redox balance in the nutrient-poor conditions of a pancreatic tumour2,14,15. While extracellular protein can provide nutrients to the starved cancer cells11,13, we hypothesized that the stroma may provide additional avenues of metabolic support for the tumour. Pancreatic stellate cells (PSCs) are a predominant cell type in the pancreatic tumour stroma and are important mediators of the desmoplastic response. Their abundance suggests that they may contribute to the metabolism of cancer cells. To test this idea, we assessed changes in the oxygen consumption rate (OCR) and extracellular media acidification rate (ECAR), measures of mitochondrial activity and glycolysis, respectively, in PDAC cells treated with conditioned medium from a well characterized human PSC (hPSC) line16 (Fig. 1a, b and Extended Data Fig. 1a–e). PDAC glycolysis showed minimal changes when cells were treated with PSC-conditioned medium, as measured by ECAR (Extended Data Fig. 1d, e). By contrast, we observed a consistent increase of 20–40% in the basal OCR after treatment with hPSC medium (Fig. 1a, b and Extended Data Fig. 1a–c), a feature that was independent of serum during the conditioning process (Extended Data Fig. 1f, g) and reproducible with multiple primary specimens (Fig. 1b and Extended Data Fig. 1h, i). Notably, this metabolic phenotype was specific to pancreatic cancer cells; non-transformed pancreatic ductal epithelial cells did not exhibit increased OCR in response to PSC medium (Extended Data Fig. 1j).
Figure 1. Pancreatic stellate cells secrete metabolites that fuel pancreatic cancer metabolism.
a, Conditioned medium (CM) from hPSCs increases PDAC OCR (green line), as compared to cells treated with PDAC CM (red line) or control (DMEM with 10% serum, black line). A representative trace showing change in OCR during a mitochondrial stress test. Error bars depict s.d. of 6 independent wells from a representative tracing from 6 independent experiments (depicted in b). b, Per cent change in basal OCR for 8988T cells treated with conditioned medium from different cell lines relative to 8988T cells treated with standard culture medium. Error bars depict s.e.m. of pooled independent experiments (n = 3 for primary hPSC #1, #2, primary mPSC; n =4 for hPSC#2, IMR90 and MiaPaCa2; n = 6 for 8988T, hPSC#1). c, OCR activity of PSC-conditioned medium is retained after heating at 100 °C for 15 min. Error bars, s.e.m. of independent experiments (n =4). d, Metabolites that were significantly elevated in PSC-conditioned medium, decreased in double-conditioned medium (PSC-conditioned medium added to 8988T cells and then collected), and elevated intracellularly in PDAC cells treated with PSC-conditioned medium. Error bars, s.d. (n =3). e, A mixture of NEAAs (1 mM alanine, aspartate, asparagine, glycine, glutamate, proline and serine) or alanine alone increases PDAC OCR. Data are normalized to cells treated with standard culture medium. Error bars, s.e.m. of independent experiments (n =4). f, The concentration of alanine was measured in conditioned medium samples using liquid chromatography with tandem mass spectrometry (LC–MS/MS). Error bars, s.d. (n =3). Significance determined with one-way ANOVA in b, c, e; t-test in d, f. Panels d, f, n =3 technical replicates from independently prepared samples from individual wells. * P < 0.05, ** P < 0.01, *** P < 0.001. The calculated P values and comparisons are reported in Supplementary Information.
To identify the nature of the PSC-secreted factors that alter PDAC metabolism, we subjected conditioned medium to three freeze-thaw cycles (−80 °C, 60 °C) or heating (100 °C, 15 min) and observed that it retained the ability to increase PDAC OCR (Fig. 1c and Extended Data Fig. 1k–m), indicating that the factor(s) lacked tertiary structure. Moreover, the activity was retained in medium passed through a 3-kDa cut-off filter (Extended Data Fig. 1n). The small size and resistance to extreme temperatures of the OCR-increasing factor(s) excluded large candidate molecules such as proteins, indicating that the factor(s) could be metabolites.
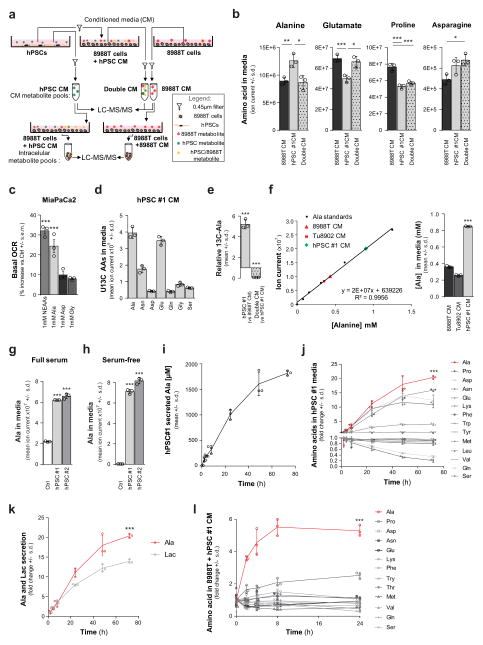
We next performed a series of metabolomic studies17 to identify metabolites that were secreted by PSCs and taken up by PDAC cells (Extended Data Fig. 2a). Specifically, we sought molecules that were over-represented in PSC medium (and therefore secreted by PSCs); under-represented in the PSC medium after contact with PDAC cells (removed by PDAC cells); and over-represented inside PDAC cells treated with the PSC medium (taken up by PDAC cells). Of approximately 200 metabolites analysed, only the non-essential amino acids (NEAA) alanine and aspartate followed this pattern (Fig. 1d and Extended Data Fig. 2b). Treatment of PDAC cells with the individual amino acids revealed that only alanine had the ability to increase PDAC OCR to a degree comparable to that of PSC-conditioned medium (Fig. 1e and Extended Data Fig. 2c).
To demonstrate that PSC-derived metabolites, and alanine specifically, were being taken up by PDAC cells, we performed metabolite tracing experiments in which PSCs were grown to saturation in medium containing uniformly carbon-13-labelled (U13C-)glucose and U13C-glutamine to label secreted NEAAs (Extended Data Fig. 2d). The conditioned medium from the labelled cells was then added to PDAC cells, allowing us to track the production and secretion of alanine by the PSCs and to follow its depletion from PSC medium upon contact with PDAC cells (Extended Data Fig. 2e). Quantification revealed that secreted alanine in the PSC medium reached millimolar concentration within 24 h of conditioning (Fig. 1f and Extended Data Fig. 2f–i), and this occurred independent of serum in the medium (Extended Data Fig. 2h). In the context of a tumour in vivo, the more important parameters to assess are the release and uptake of alanine relative to other nutrients. Accordingly, we performed kinetic studies and found that alanine was secreted by the PSCs at the greatest rate of the 14 amino acids measured and more rapidly than even lactate (Extended Data Fig. 2j, k). Alanine was also one of only two amino acids to accumulate in PDAC cells, achieving an enrichment of greater than fivefold (Extended Data Fig. 2l).
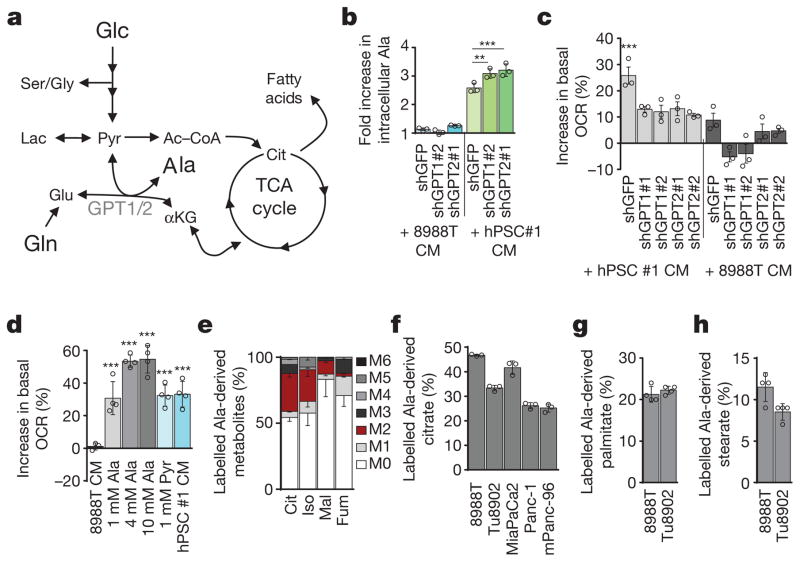
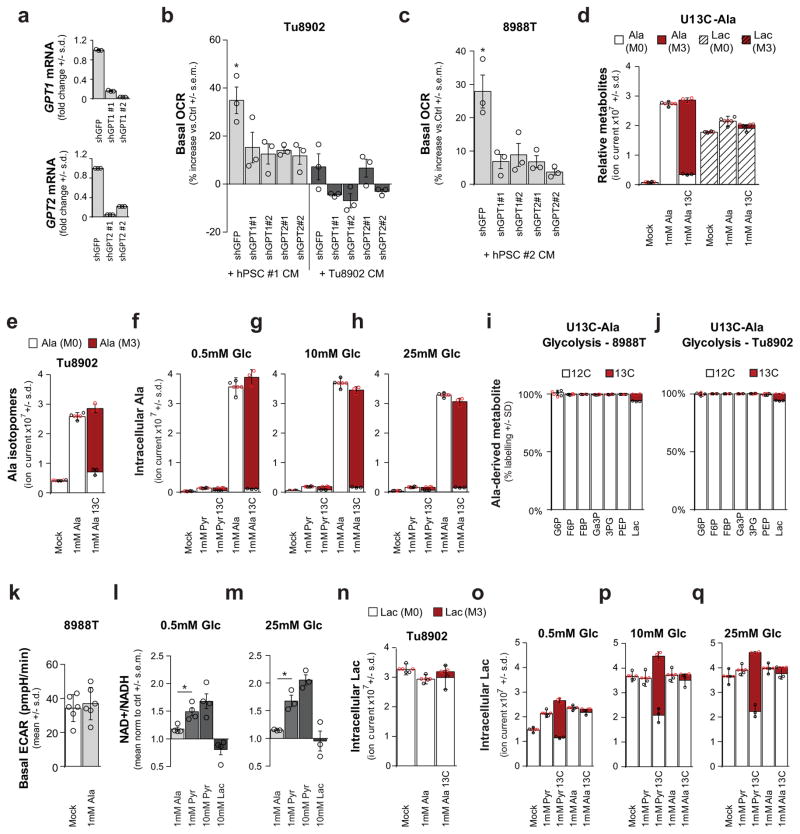
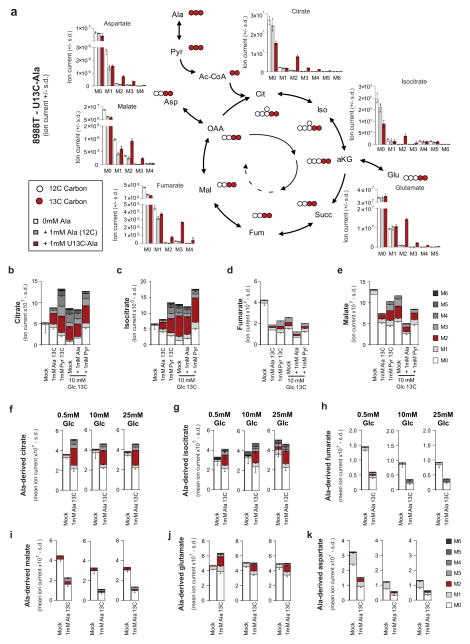
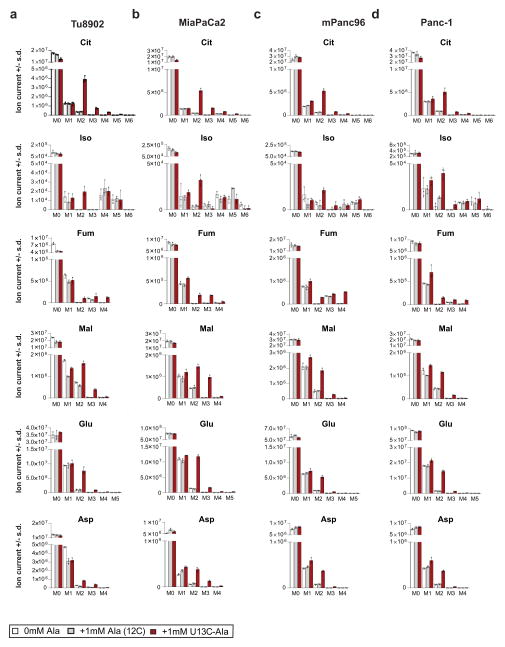
We next investigated how PDAC cells metabolize PSC-derived alanine. Alanine could increase OCR by fuelling the TCA cycle, and a likely route for this is through transamination of alanine into pyruvate (Fig. 2a). Consistently, depletion of the cytosolic or mitochondrial alanine transaminase (GPT1 or GPT2, respectively) in PDAC cells (Extended Data Fig. 3a) resulted in an increase in accumulation of alanine (Fig. 2b) and a decrease in OCR in PSC medium-treated PDAC cells (Fig. 2c and Extended Data Fig. 3b, c). Moreover, direct addition of pyruvate to PDAC cells increased OCR (Fig. 2d). We then performed U-13C-Ala tracing studies to assess how alanine was being used in PDAC metabolism. Treatment of cells with 1 mM U-13C-Ala led to a 5–10-fold increase in the intracellular alanine pool (Extended Data Fig. 3d–h). Carbon from alanine did not contribute to upstream glycolytic intermediates (Extended Data Fig. 3i, j) or alter glycolytic flux (Extended Data Fig. 3k) or the NAD+/NADH ratio (Extended Data Fig. 3l, m), and it contributed minimally to the intracellular lactate pool (Extended Data Fig. 3d, n), irrespective of the extracellular glucose concentration (Extended Data Fig. 3o–q). These results suggested that alanine-derived pyruvate was being used in the mitochondria, because it was not affecting cytosolic glycolytic metabolism. Indeed, alanine was a major carbon source for the TCA cycle; 13C was markedly incorporated into citrate and isocitrate, and, to a lesser extent, malate and fumarate (Fig. 2e and Extended Data Figs 4, 5), as well as into the NEAAs aspartate and glutamate (Extended Data Fig. 4–5), which can be biosynthesized from TCA cycle intermediates in PDAC cells14. Indeed, citrate was one of the major recipients of alanine carbon, with labelling ranging from 23% to 46% among PDAC lines (Fig. 2f and Extended Data Figs 4, 5).
Figure 2. Alanine is secreted by stellate cells and is used by PDAC to fuel biosynthetic reactions.
a, Role of the alanine transaminases (GPT1/2) in central carbon metabolism. Glucose (Glc), pyruvate (Pyr), lactate (Lac), Ac–CoA, citrate (Cit), and α-ketoglutarate (αKG). b, Knockdown of GPT1 or GPT2 in PDAC cells results in a further increase in intracellular alanine upon treatment with PSC-conditioned medium. Error bars depict s.d. (n = 3). Data are normalized to cells treated with standard culture medium for each shRNA. c, Knockdown of GPT1 or GPT2 in PDAC cells significantly attenuates the ability of PSC-conditioned medium to increase OCR. Data normalized to cells treated with standard culture medium. Error bars depict s.e.m. of independent experiments (n =3). d, Alanine treatment of PDAC cells increases OCR in a dose-dependent fashion and can be recapitulated by pyruvate. Data normalized to cells treated with standard culture medium. Error bars depict s.d. of 4 independent wells from a representative experiment (of 3 experiments). e, Alanine-derived carbon labelling patterns of metabolites in PDAC cells treated with U-13C-Ala demonstrate substantial label incorporation into the TCA cycle metabolites citrate, isocitrate (Iso), malate (Mal) and fumarate (Fum). Error bars depict s.d. (n =3). f, U-13C-alanine labelling of citrate in a panel of PDAC cell lines represented as fraction of citrate with labelled carbon. Error bars depict s.d. (n =3). g, h, U-13C-Ala labelled PDAC cells show substantial incorporation of alanine into the de novo biosynthesis of the fatty acids palmitate (g) and stearate (h). Data presented as the sum of all isotopomers containing alanine-derived label. Error bars depict s.d. (n = 4). Significance determined with one-way ANOVA in b–d. Panels b, f, n =3; panels g, h, n = 4 technical replicates from independently prepared samples from individual wells. * P < 0.05, ** P < 0.01, *** P < 0.001. The calculated P values and comparisons are reported in Supplementary Information.
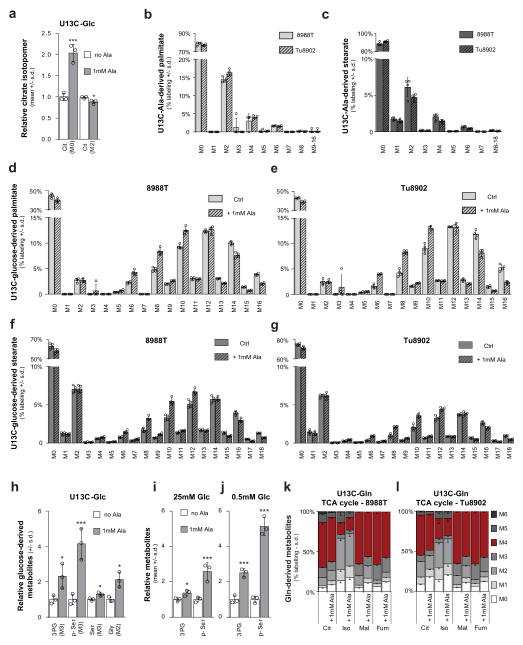
We also observed that the alanine-derived pyruvate competed meaningfully with mitochondrial but not cytosolic glucose-derived pyruvate based on the citrate (M2, where M refers to metabolite and 2 the number of 13C atoms present) and lactate (M3) labelling patterns following U-13C-Ala or U-13C-glucose tracing studies (Extended Data Figs 3d, i, j, o–q, 4, 5, 6a). These results illustrate that alanine carbon is being used selectively to fuel mitochondrial metabolism and are consistent with our earlier observations that the addition of alanine does not disrupt glycolysis (Extended Data Fig. 3i–k). A principle function of mitochondrial pyruvate in proliferating cells is to contribute to citrate generation via its conversion to acetyl coenzyme A (Ac-CoA). This citrate (labelled with the two Ac-CoA carbons, M2) is then released into the cytosol and used as a building block for fatty acid biosynthesis. As shown in Fig. 2g, h, more than 20% of total palmitate and 10% of total stearate contained alanine-derived 13C, rivalling the contribution derived from glucose (around 50% and 20%, respectively; Extended Data Fig. 6b–g), and illustrating the importance of alanine in lipid biosynthesis. The production of citrate from alanine for fatty acid biosynthesis requires an additional TCA cycle input to support anaplerosis. Indeed, we observed that alanine could also serve in this role through pyruvate carboxylase, as evidenced by M3 labelling of citrate and other TCA cycle intermediates from U-13C–Ala (Extended Data Figs 4, 5).
We also found that addition of alanine increased flux through the serine biosynthetic pathway in PDAC cells (Extended Data Fig. 6h–j). This pathway uses glucose to generate the NEAAs serine and glycine, which are used for, among other processes, the de novo biosynthesis of nucleic acids. U-13C-glucose tracing studies confirmed that alanine promoted flux of glucose-derived carbon through this pathway (Extended Data Fig. 6h), an effect that was more pronounced under the glucose-limiting conditions, which resemble poorly perfused pancreatic tumours (Extended Data Fig. 6j). Collectively, these results demonstrated that alanine-derived carbon could supplant glucose-derived carbon in TCA cycle metabolism (to make lipids and NEAAs), thereby enabling glucose to be used for additional biosynthetic functions such as the serine biosynthetic pathway. Glutamine metabolism was also altered in the presence of exogenous alanine, with more alanine being incorporated into the TCA cycle in place of glutamine carbon (Extended Data Fig. 6k, l), but this occurred to a much lower degree relative to glucose-derived carbon in most PDAC lines.
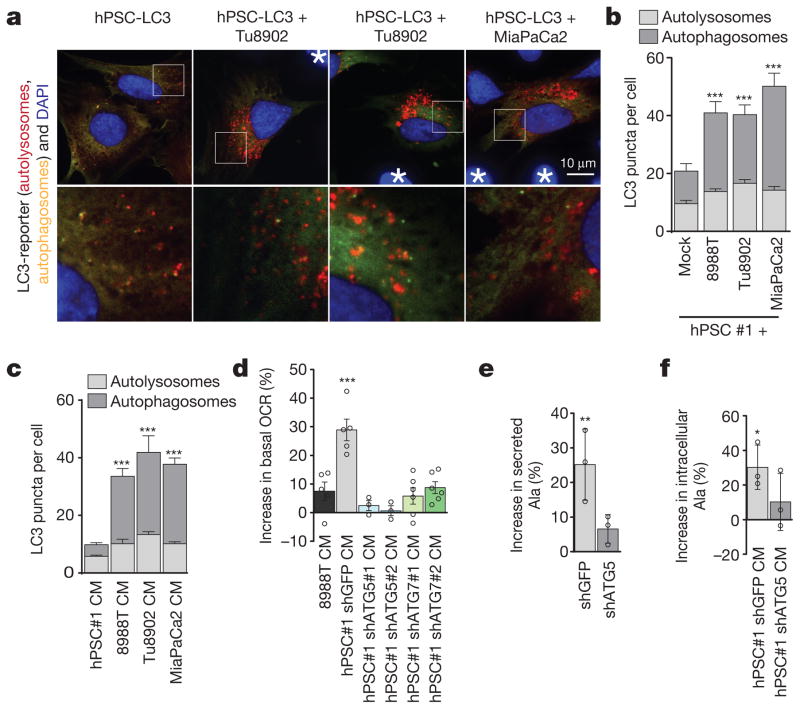
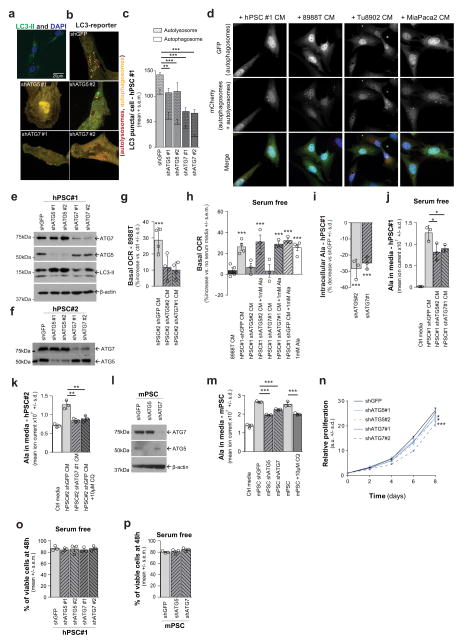
One possible source of PSC-secreted alanine was protein catabolism. Given the critical role of autophagy in PDAC18,19, we tested whether the secretion of alanine was autophagy-dependent. PSCs in culture exhibit readily detectable levels of basal autophagy, as demonstrated by LC3 puncta (representing autophagosomes; Extended Data Fig. 7a), and exhibit appreciable levels of autophagic flux (Fig. 3a–c and Extended Data Fig. 7b–d). Notably, co-culture with PDAC cells (Fig. 3a, b), or treatment with PDAC-conditioned medium (Fig. 3c and Extended Data Fig. 7d), significantly increased autophagic flux in PSCs. To assess the importance of autophagy in the secretion of alanine, we inhibited autophagy in PSCs using short hairpin (sh)RNAs targeting the essential autophagy genes ATG5 and ATG7 (Extended Data Fig. 7b, c, e, f) and measured the ability of the PSC-conditioned medium to increase PDAC OCR. The ability of PSC medium to increase OCR in PDAC cells was abolished upon knockdown of autophagy genes (Fig. 3d and Extended Data Fig. 7g) and could be rescued by addition of exogenous alanine (Extended Data Fig. 7h). Consistently, we observed a drop in the levels of both intracellular alanine and secreted alanine when autophagy was impaired in hPSCs (Fig. 3e and Extended Data Fig. 7i–m). Furthermore, intracellular alanine accumulation in PDAC cells was also diminished following treatment with autophagy-impaired PSC-conditioned medium (Fig. 3f). In contrast to PDAC cells, which respond robustly to autophagy inhibition18,19, PSC proliferation was largely insensitive to autophagy impairment (Extended Data Fig. 7n). Even under nutrient-depleted conditions, PSC survival was not altered when autophagy was impaired (Extended Data Fig. 7o, p), indicating that altered PSC survival was not the cause of decreased alanine secretion. In sum, these data provide evidence for two-way intratumoral metabolic cross-talk, in which cancer cells release a signal to PSCs that results in the induction of autophagy and the release of alanine.
Figure 3. Alanine secretion is dependent on stellate cell autophagy.
a, Representative images of basal autophagic flux in PSCs using an LC3 tandem fluorescence (GFP–RFP) reporter. PDAC cells are not fluorescently labelled and are indicated by asterisks. b, Autophagy in PSCs is increased upon co-culture with multiple PDAC lines, demonstrated by increased autolysosomes. Error bars, s.e.m. of n = 32 for hPSC alone; n = 38 for 8988T co-culture; n = 41 for Tu8902 co-culture; n =24 for MiaPaCa2 co-culture pooled from 3 independent experiments. c, Quantification of autophagic flux in stellate cells treated with conditioned medium from PDAC lines. Error bars, s.e.m. of n =65 hPSC-conditioned medium; n = 50 8988T-conditioned medium; n =61 Tu8902-conditioned medium; n = 62 MiaPaca2-conditioned medium in independent hPSC cells per condition pooled from 3 independent experiments. d, Suppression of PSC autophagy by ATG5 or ATG7 knockdown attenuates the ability of PSC-conditioned medium to increase OCR in 8988T PDAC cells. Data normalized to cells treated with standard culture medium. Error bars show s.e.m. of pooled experiments (n = 6 for ATG7 #1, #2; n = 5 for shGFP, 8988T conditioned medium; n = 3 for ATG5 #1, #2). e, PSC-conditioned medium contains elevated alanine, which is significantly decreased when autophagy is inhibited. f, PDAC cells treated with PSC conditioned medium display elevated intracellular alanine, which is significantly suppressed when autophagy is inhibited in PSCs. Error bars for e, f, show s.d. of n =3 technical replicates from independently prepared samples from individual wells. Significance determined with two-way ANOVA in b, c; one-way ANOVA in d–f. * P < 0.05, ** P < 0.01, *** P < 0.001. The calculated P values and comparisons are reported in Supplementary Information.
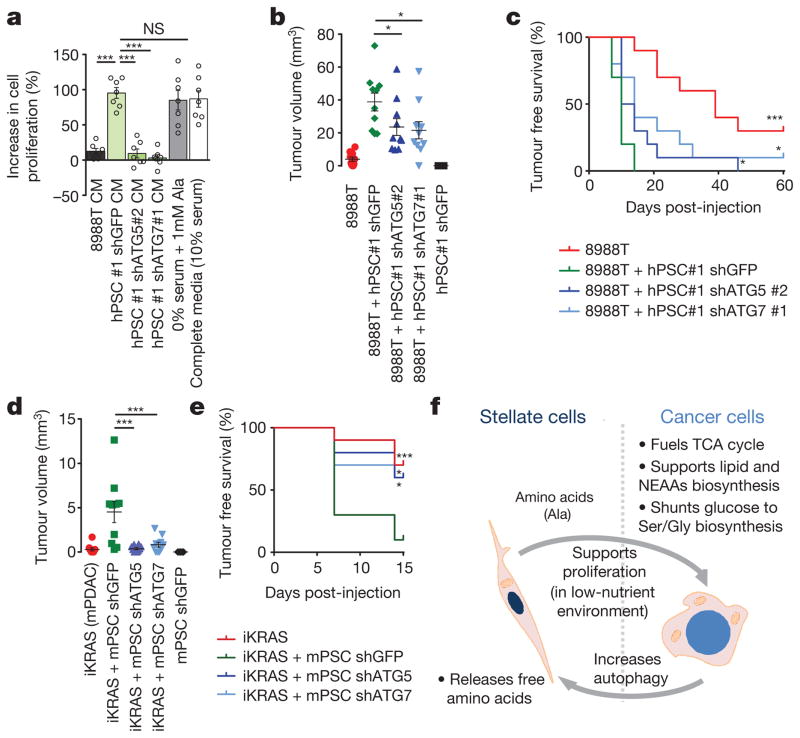
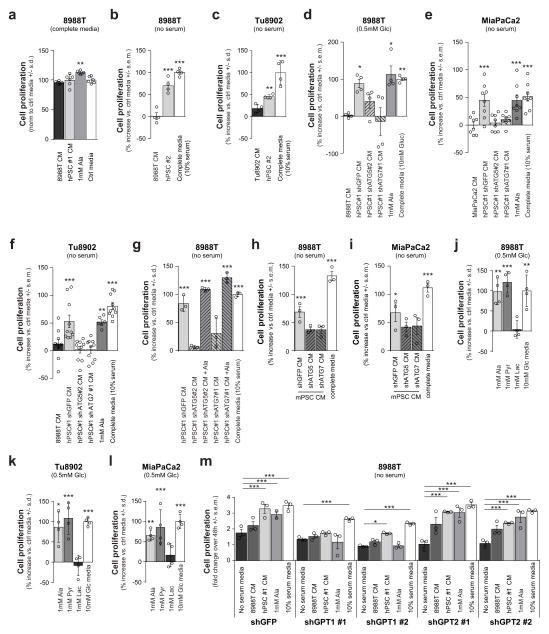
We next sought to determine whether these PSC-induced metabolic alterations in PDAC would have an impact on PDAC proliferation. Not surprisingly, in high-nutrient medium (25 mM glucose, 4 mM Gln, full serum), the impact of PSC medium on PDAC proliferation was not significant (Extended Data Fig. 8a). By contrast, when grown in a low-nutrient setting (serum-free or glucose-limiting conditions), recapitulating the austere microenvironment in vivo, there was a significant positive effect of PSC medium on PDAC proliferation (Fig. 4a and Extended Data Fig. 8b–f). Notably, PSC medium from autophagy-impaired cells did not produce this growth-promoting effect (Fig. 4a and Extended Data Fig. 8d–i). Supplementation of serum-free or low-glucose medium with alanine was also able to rescue growth in a manner similar to PSC medium (Fig. 4a and Extended Data Fig. 8d–f, j–l), while having a minimal effect in nutrient-rich settings (Extended Data Fig. 8a). Moreover, alanine was able to restore the growth-promoting ability of PSC medium from autophagy-impaired cells (Extended Data Fig. 8g). Consistent with the proposed mechanism, pyruvate (the product of the transamination of alanine), but not lactate, was able to sustain PDAC proliferation in glucose-limited medium (Extended Data Fig. 8j–l). Similarly, GPT1 knockdown in PDAC cells grown under serum-free conditions significantly attenuated the effects of PSC medium or alanine on proliferation (Extended Data Fig. 8m).
Figure 4. Stellate cell metabolite secretion supports PDAC growth under nutrient-limiting conditions and facilitates tumour growth.
a, PSC-conditioned medium increases proliferation of 8988T cells grown in serum-free medium, a feature recapitulated with exogenous alanine supplementation. By contrast, conditioned medium from PSCs where autophagy is inhibited is unable to support PDAC growth. The addition of 10% serum is included as a positive control. Error bars, s.e.m. (n =7) independent experiments. b, c, Co-injection of 8988T PDAC cells with PSCs significantly enhances early tumour growth, analysed at 35 days post-injection (b), and decreases tumour-free survival (c), in a xenograft model. This effect is significantly attenuated when autophagy is suppressed in the PSCs. Error bars, s.e.m. (n = 10) tumours per condition per time point, except for the PSC–shGFP control, for which (n = 5) animals were injected. d, e Co-injection of inducible KRAS mouse PDAC cells with mPSCs in the pancreas of syngeneic mice significantly enhances early tumour growth at 7 days post-injection (d) and decreases tumour-free survival (e) in an orthotopic syngeneic graft model, whereas this effect is significantly attenuated when autophagy is suppressed in the PSCs. Error bars, s.e.m. (n = 10) tumours per condition per time-point, except for the mPSC–shGFP control, for which (n = 5) animals were injected. f, Model of tumour–stroma metabolic cross-talk. Significance determined with a one-way ANOVA in a, b, d; log-rank Mantel–Cox test in c, e. * P < 0.05, ** P < 0.01, *** P < 0.001. The calculated P values and comparisons are reported in Supplementary Information.
To determine whether this cross-feeding mechanism was operative in vivo, we developed a co-injection system in which PSCs could be manipulated genetically and then implanted alongside cancer cells into the flanks of mice. Although previous studies have shown that co-injection of PSCs with PDAC cells promotes tumour growth16, the contribution of metabolic cross-talk to this effect has not been explored. The fact that autophagy is required for PSC alanine secretion, while having a minimal impact on proliferation and no effect on survival (Extended Data Fig. 7n–p), permits selective attenuation of this metabolic cross-talk so that its role in tumour growth can be assessed. We therefore performed co-injection studies with limiting numbers of PDAC cells along with autophagy-competent or incompetent PSCs (Extended Data Fig. 9a). Consistent with the in vitro proliferation data, both tumour take and tumour growth kinetics were increased significantly when co-injected with autophagy-competent PSCs, and this increase was significantly attenuated when PDAC cells were co-injected with autophagy-incompetent PSCs (Fig. 4b, c and Extended Data Fig. 9b–e). Notably, the predominant effect of PSC growth support in these assays appears to be during tumour initiation or tumour take (Fig. 4b, c and Extended Data Fig. 9c, d); at later time points the autophagy-incompetent PSC-containing tumours approximate their autophagy-competent counterparts (Extended Data Fig. 9b, e). Indeed, the cancer cells ultimately form the majority of the grafted tumours, even with the wild-type PSCs (Extended Data Fig. 9f, g). Quantification of stellate cells by western blot for RFP (exogenous PSCs were marked with RFP) showed that while the levels of RFP expression varied by individual tumour, there were no significant differences between groups based on autophagy status (Extended Data Fig. 9h, i).
Consistent with the results from the subcutaneous model, diminution of autophagy in PSCs slowed tumour growth and increased tumour-free survival in orthotopic assays (Extended Data Fig. 10a–d). The orthotopic tumours contained more PSCs than the subcutaneous tumours, but again PSCs were less abundant than tumour cells (Extended Data Fig. 10e). To further validate the in vivo relevance of this mechanism, we used a syngeneic system consisting of cancer cells and PSCs derived from our murine PDAC autochthonous models15. Consistent with our findings using human PDAC and PSC lines, murine PSCs improved tumour engraftment in an autophagy-dependent manner (Fig. 4d, e and Extended Data Fig. 7l, m).
Our work demonstrates growth-promoting metabolic cross-talk between stromal PSCs and epithelial cancer cells (Fig. 4f). Previous work has illustrated that intratumoral metabolic cross-talk can occur between different populations of cells in a tumour20,21. For example, hypoxic cancer cells in colorectal and lung cancer models preferentially consume glucose and provide well-oxygenated cancer cells with lactate for oxidative metabolism21. More recently, others have suggested that stromal cells can alter the metabolism of pancreatic cancer cells22 and that this can occur with exosomes as a vehicle for non-selective metabolite delivery20. While alterations in lactate and alanine were recently reported using imaging studies during pancreatic cancer progression in mouse models, these studies did not have the spatial resolution to distinguish between different cell types within the tumour and would not be able to detect metabolic cross-talk between cancer cells and fibroblasts23. Our work, using pancreatic cancer model systems and in vivo co-transplantation assays, demonstrate a specific role of PSC-derived alanine, whose carbon competes with glucose-derived carbon as a metabolic substrate—effects not recapitulated with exogenous lactate.
Protein catabolized through autophagy is the source of secreted alanine from PSCs. Given that alanine is the second most represented amino acid in proteins, catabolism can provide an important source of free alanine24. We found that PDAC cells stimulate autophagy in PSCs and selectively consume the released alanine, using this carbon in the TCA cycle following its conversion to pyruvate. Notably, alanine-derived pyruvate does not equilibrate with cytosolic pyruvate. As such, it provides a direct mitochondrial carbon source without changing the cytosolic NAD+/NADH redox balance. This results in increased mitochondrial oxygen consumption as well as lipid biosynthesis. Importantly, the metabolism of alanine allows traditional carbon sources such as glucose to be more available for other biosynthetic processes, such as the synthesis of serine and glycine, which are precursors for nucleic acid biosynthesis. This cooperative metabolism promotes tumour growth and is particularly relevant in nutrient-limited conditions.
According to this mechanism, we would predict that PSC-mediated alanine secretion would be less relevant under circumstances in which pancreatic cancer cells are able to access nutrients through the vasculature directly, such as those in PSC-ablated pancreatic tumours8,9. In contrast, alteration of PSC features (inhibiting autophagy, for example) without their ablation would allow the continued, PSC-mediated restraint of tumour growth while potentially sensitizing the tumour to treatment. A recent example of this strategy demonstrated that stromal reprogramming of PDAC with vitamin D sensitized them to chemotherapy25.
Collectively, these findings are important for the following reasons. First, they shed light on the complex biology of tumour–stroma interactions. Furthermore, they highlight the importance of studying the metabolism of highly desmoplastic tumours such as PDAC in the proper context, in this case in the presence of relevant supporting cell types. Last, this cooperative metabolism between cancer cells and PSCs, which is dependent on autophagy, further substantiates the critical role of metabolic scavenging in PDAC and suggests that inhibition of autophagy and other lysosomal degradation pathways may have an even greater therapeutic utility in this disease than previously appreciated.
METHODS
Cell culture
The cell lines 8988T, MiaPaCa2, Tu8902, Panc1, MPanc96 and IMR90 were obtained from ATCC or the DSMZ. hPSCs (hPSC#1) have been previously described16. hPSC#2 was isolated from an untreated human PDAC resection and considered de-identified ‘surgical waste’ tissue under IRB approved protocols 03-189 and 11-104. Patients gave informed consent for tissue collection. Stromal cells that outgrew the cancer cells in culture were isolated by differential trypsinization and immortalized by infection with hTERT and SV40gp6 (Addgene plasmids #22396 and #10891, respectively) retro-viruses. These cells were kept in DMEM (Life Technologies 11965) supplemented with 10% FBS and 1% Pen/Strep (Life Technologies 15140). Primary human pancreatic cancer-associated fibroblasts were isolated from tumour resections in a similar manner as above, under IRB approved protocol STU 102010-051, but were not immortalized. Cells were kept in DMEM supplemented with 10% CCS (Thermo Scientific) and 1% Pen/Strep. PSCs were verified by measuring Desmin and SMA expression. HPDE have been previously described and grown as indicated26. All cells were routinely tested for mycoplasma by PCR and PDAC lines were typically authenticated by fingerprinting as well as visual inspection and carefully maintained in a centralized cell bank. mPSCs were isolated from normal mice pancreata and purified by centrifugation using a Nycodenz gradient and activated by in vitro culture, as described25.
Black 6 (B6) mPSCs were generated from B6 females (Taconic, B6NTac) harbouring mouse PDAC. These animals were pre-treated with doxycycline diet and kept in doxycycline regimen for the duration of the experiment and were injected with 5 × 10⁵ iKRAS mPDAC cells15 into the pancreas. Pancreatic tumours were resected at 2 weeks, digested in collagenase and dispase and mechanically minced. Cells were plated in cell culture dishes in DMEM (Gibco) with 15% FBS in the absence of doxycycline to limit the growth of iKRAS mouse PDAC cells. mPSCs were immortalized by infection with hTERT and SV40gp6 (Adgene plasmids #22396 and #10891, respectively) retro-viruses. Cells were kept in DMEM (Gibco) with 10% FBS and 1% Pen/strep.
mCherry-hPSCs are hPSC#1 labelled with mCherry through infection with a lentivirus expressing mCherry.
Conditioned medium was generated by adding fresh medium to cells at >50% confluence. Medium was harvested 48 h later and passed through 0.45-μm filters. For size cut-off experiments conditioned medium was filtered through 3-kDa cutoff columns (EMD Millipore, UFC900308). Concentrated (>3kDa) medium was resuspended in a DMEM volume matching the initial medium volume. Boiled medium experiments were performed by heating conditioned medium at 100 °C for 15 min followed by filtration at 0.45 μm to remove precipitate. Freeze-thaw medium was treated by 3 consecutive cycles of 15 min at −80 °C followed by 15 min at 60 °C and then filtered to remove precipitate.
The tandem fluorescence LC3-reporter stable hPSC cells were generated by retroviral infection of hPSCs with pBABE-puro mCherry-EGFP-LC3B (Addgene plasmid #22418). For autophagic flux quantification experiments, 7.5 × 10⁴ hPSC-LC3 cells were plated in 12-well plates with cover slips and 3 × 10⁵ PDAC or hPSC cells were added 4 h later. Cover slips were fixed in 4% paraformaldehyde (ThermoFisher, 28908) after cells had been in contact for 24 h. Coverslips were mounted in DAPI containing mounting solution (Life Technologies P36931). Cells were imaged on a Yokogawa Spinning Disk Confocal in FITC, RFP and DAPI channels. The ratio of red:yellow puncta was determined by counting puncta using the Cell Counter imageJ plugin.
Oil-red O staining was performed on cells plated on glass cover slips and fixed 24 h after plating in 4% paraformaldehyde (Thermo-Fisher, 28908) for 15 min. Cells were rinsed with PBS followed by a rinse with 60% isopropanol and stained with freshly prepared Oil Red O working solution comprised of 3 ml of 0.5% solution (Sigma, O1391) and 2 ml of H2O for 15 min, rinsed with 60% isopropanol and counterstained with Heamatoxylin. Cover slips were then washed in H2O, mounted in Vectashield and imaged using a Leica DM2000 bright-field microscope.
Growth assays
Growth curves were obtained as previously described19. Cell growth over 48 h was assessed in clear bottom 96-well plates (Costar 3603, Corning Incorporated) by CellTiter-Glo (Promega G7572) analysis 48 h post treatment with conditioned medium or metabolites and determined by the mean of at least three wells per condition. Luminescence was measured on a POLARstar Omega plate reader.
Metabolism experiments
OCR and ECAR experiments were performed using the XF-96 apparatus from Seahorse Bioscience. Cells were plated (16,000 cells per well for 8988T; 20,000 cells for Tu8902 or Panc-1; 50,000 cells for HPDE) in at least quadruplicate for each condition the day before the experiment. The next day, medium was completely replaced with conditioned medium (75 μl of conditioned medium and 25 μl of fresh medium) or fresh medium containing either 1 mM L-alanine (Sigma A7469), 1 mM of NEAAs (Gibco 11140), 1 mM glycine (Sigma G8790), 1 mM aspartate (Sigma A4534) or 1 mM cysteine (Sigma A9165). 20 h later, medium was replaced by reconstituted DMEM with 25 mM glucose and 2 mM glutamine (no sodium bicarbonate) adjusted to pH~7.4 and incubated for 30 min at 37% in a CO2-free incubator. For the mitochondrial stress test (Seahorse 101706-100), oligomycin, FCCP and rotenone were injected to a final concentration of 2 μM, 0.5μM and 4 μM, respectively. For the glycolysis stress test (Seahorse 102194-100), glucose, oligomycin and 2-deoxyglucose were injected to a final concentration of 10 mM, 2 μM and 100 mM, respectively. OCR and ECAR were normalized to cell number as determined by CellTiter-Glo analysis at the end of the experiments.
Metabolomics
Steady-state metabolomics experiments were performed as previously described14. Briefly, PDAC cell lines were grown to ~80% confluence in growth medium (DMEM, 2 mM glutamine, 10 mM glucose, 10% CCS) on 6 cm dishes in biological triplicate. A complete medium change was performed two hours before metabolite collection. To trace the effect of alanine on glutamine and glucose metabolism, PDAC cell lines were grown as above and then transferred into glutamine-free (with 10 mM glucose) or glucose-free (with 2 mM glutamine) DMEM containing 10% dialysed FBS and supplemented with either 2 mM U-13C-glutamine (± 1 mM alanine) or 10 mM U-13C-glucose (± 1 mM alanine), respectively, overnight. To trace alanine metabolism, PDAC cell lines were grown as above and then transferred into DMEM (with 10 mM glucose, 2 mM glutamine, 10% dialysed FBS) and supplemented with 1 mM U-13C-alanine overnight. Additionally, fresh medium containing the labelled metabolite was exchanged 2 h before metabolite extraction for steady-state analyses. To trace glucose metabolism in low-glucose conditions, cells were grown in 0.5 mM of glucose and medium was refreshed every 8 h for the 24 h labelling period to achieve steady-state labelling. For all metabolomics experiments, the quantity of the metabolite fraction analysed was adjusted to the corresponding protein concentration calculated upon processing a parallel well in a 6-cm dish.
To collect labelled conditioned medium, hPSC or 8988T cells were grown for three passages in DMEM containing 10 mM U-13C-glucose, 2 mM U-13C-Gln and 10% dialysed FBS. This medium was then replaced by DMEM with unlabelled glucose, glutamine and 10% dialysed FBS, and incubated for 48 h, filtered and processed for metabolite extraction. Metabolite extraction of medium was performed by adding 200 μl of filtered fresh conditioned medium to 800 μl of cold (−80 °C) methanol, incubated at −80 °C for 30 min followed by centrifugation at 10,000g for 10 min at 4 °C. The resultant supernatant was lyophilized by speedvac and stored at −80 °C until analysis. Dried metabolite pellets were re-suspended in 20 μl LC–MS grade water, 5 μl were injected onto a Prominence UFLC and separated using a 4.6 mm i.d. × 100 mm Amide XBridge HILIC column at 360 μl per minute starting from 85% buffer B (100% ACN) to 0% B over 16 min. Buffer A: 20 mM NH4OH/20 mM CH3COONH4 (pH = 9.0) in 95:5 water/ACN. 287 selected reaction monitoring (SRM) transitions were captured using positive/negative polarity switching by targeted LC-MS/MS using a 5500 QTRAP hybrid triple quadrupole mass spectrometer.
For kinetics of metabolite secretion by hPSCs, triplicate samples of subconfluent hPSCs cultured under normal conditions were changed to fresh DMEM with 10% dialysed FBS, which was allowed to condition for 2, 4, 8, 24, 48, or 72 h. Fresh DMEM with 10% dialysed FBS was used as a blank control. Metabolites were then extracted from conditioned medium by adding ice cold 100% MeOH to a final concentration of 80% MeOH.
For PDAC metabolite uptake kinetics, conditioned DMEM with 10% dialysed FBS from subconfluent hPSCs was collected after 48 h of culture, and then filtered through a 0.45 μm filter. 8988T PDAC cells were plated in triplicate and treated with the PSC-conditioned medium or fresh DMEM with 10% dialysed FBS for 1, 2, 4, 8, or 24 h. The medium was removed and the cell lysate harvested with ice cold 80% MeOH. The soluble metabolite fractions were cleared by centrifugation, dried under nitrogen, then resuspended in 50:50 MeOH:H2O mixture for LC–MS analysis.
For the kinetic analyses, a Shimadzu Nexera X2 UHPLC combined with a Sciex 5600 Triple TOFMS was used, which was controlled by Sciex Analyst 1.7.1 instrument acquiring software. A Supelco Ascentis Express HILIC (7.5 cm × 3mm, 2.7 μm) column was used with mobile phase (A) consisting of 5 mM NH4OAc and 0.1% formic acid; mobile phase (B) consisting of 98% CAN, 2% 5 mM NH4OAc and 0.1% formic acid. Gradient program: mobile phase (A) was held at 10% for 0.5 min and then increased to 50% in 3 min; then to 99% in 4.1 min and held for 1.4 min before returning initial condition. The column was held at 40 °C and 5 μl of sample was injected into the LC–MS with a flow rate of 0.4 ml/min.
Calibrations of TOFMS were achieved through reference APCI source with average mass accuracy of less than 5 ppm except for alanine, which was 20 ppm. Key MS parameters were the collision energy and spread of 25 eV and 10 eV for positive product ion acquisition and −35 eV and 15 eV for negative acquisition. 100 MRM transitions were set on the MS method. Data Processing Software included Sciex PeakView 2.2, MasterView 1.1, LibraryView (64 bit) and MultiQuant 3.0.2.
For analysis of palmitate and stearate, PDAC cells in log growth were labelled in biological quadruplicate with either 5.5 mM U-13C-glucose or 1 mM U-13C-Ala in DMEM containing 2 mM glutamine and 10% dialysed FBS for 3 days. Unlabelled species were used at equivalent concentrations, where relevant. Labelled medium was refreshed every day. At 72 h, medium was refreshed for 2 h, and samples were collected by quick rinse in ddH2O followed by liquid nitrogen quenching directly on cells. Plates were then stored at −80 °C before extraction. Polar metabolites and fatty acids were extracted using methanol/water/chloroform, as described27. Samples were placed on ice and 10 μl of 1.2 mM D27 myristic acid as internal standard was introduced to each cell plate. 400 μl of cold water and 400 μl of methanol were added to each sample. Cells were collected in a centrifuge tube and 400 μl of ice-cold chloroform was added to each tube. Extracts were vortexed at 4 °C for 30 min and centrifuged at 14,000×G for 20 min at 4 °C. The lower (organic) phase was recovered, and samples were nitrogen dried before reconstitution in 50 μl of Methyl-8 reagent (Thermo) at 60 °C for 1 h to generate fatty acid methyl esters (FAMEs).
GC–MS analysis was performed using an Agilent 7890A GC equipped with a 30 m DB-5MS+DG capillary column and a Leap CTC PAL ALS as the sample injector. The GC was connected to an Agilent 5975C quadrupole MS operating under positive electron impact ionization at 70 eV. Tunings and data acquisition were done with ChemStation E.02.01, PAL Loader 1.1.1, Agilent Pal Control Software Rev A and Pal Object Manager updated firmware. MS tuning parameters were optimized so that PFTBA tuning ion abundance ratios of 69:219:512 were 100:114:12, increasing high ion abundance. Agilent Fiehn retention time locking (RLT) GC method was used and calibrated with standard FAMEs (Agilent) and confirmed with Agilent G1677AA Fiehn GC/MS metabolomics RTL Library. For measurement of FAMEs, the GC injection port was set at 250 °C and GC oven temperature was held at 60 °C for 1 min and increased to 320 °C at a rate of 10 °C/minute, then held for 10 min under constant flow with initial pressure of 10.91 psi. The MS source and quadrupole were held at 230 °C and 159 °C, respectively, and the detector was run in scanning mode, recording ion abundance in the range of 35–600 m/z with solvent delay time of 5.9 min. Data extraction was done with Agilent MassHunter WorkStation Software GCMS Quantitative Analysis Version B.07. Additional isotope correction was performed using an in-house software tool from MATLab28.
All 13C isotopic reagents were purchased from Cambridge Isotope Laboratories.
Quantitative PCR
Total RNA was extracted using TRIzol (Invitrogen) and reverse transcription was performed from 2 μg of total RNA using oligo-dT and MMLV HP reverse transcriptase (Epicentre), according to the manufacturer’s instructions. Quantitative RT–PCR was performed with SYBR Green dye using an Mx3000PTM instrument (Stratagene). PCR reactions were performed in triplicate and the relative amount of cDNA was calculated by the comparative CT method using the 18S ribosomal or actin RNA sequences as a control.
Antibodies
LC3B (Novus Biologicals NB100-2220) was used for IF at a 1:200 dilution. Secondary anti-rabbit–GFP antibody (Invitrogen A21206) was used at 1:200. For western blot ATG5 (Novus Biologicals NB110-53818), ATG7 (Sigma A2856), β-actin (Sigma A5441), LC3B (Novus Biologicals NB600-1384), RFP (Rockland 600-401-379), and secondary HRP conjugated anti-rabbit (Thermo-Fisher, 31460) and anti-mouse (Thermo-Fisher 31430) antibodies were used, as described14. For IHC analysis, αSMA (Dako M0851) was used at 1:500 followed by anti-mouse–HRP secondary antibody (Vector labs PK6101).
Lentiviral mRNA targets
shRNA vectors were obtained from the RNA Interference Screening Facility of Dana-Farber Cancer Institute. The sequences and/or RNAi Consortium clone IDs for each shRNA are as follows: shGFP: GCAAGCTGACCCTGAAGTTCAT (Addgene plasmid #30323); shATG5 #1: TRCN0000150645 (sequence: GATTCATGGAATTGAGCCAAT); shATG5 #2: TRCN0000150940 (sequence: GCAGAACCATACTATTTGCTT); shATG7 #1: TRCN0000007584 (sequence: GCCTGCTGAGGAGCTCTCCAT); shATG7 #2: TRCN0000007587 (sequence: CCCAGCTATTGGAACACTGTA); shGPT1 #1: TRCN0000034979 (sequence: GCAGTTCCACTCATTCAAGAA); shGPT1 #2: TRCN0000034983 (sequence: CTCATTCAAGAAGGTGCTCAT); shGPT2 #1: TRCN0000035024 (sequence: CGGCATTTCTACGATCCTGAA); shGPT2 #2: TRCN0000035025 (sequence: CCATCAAATGGCTCCAGACAT). Mouse shATG5: TRCN0000099430 (sequence: GCCAAGTATCTGTCTATGATA); mouse shATG7 TRCN0000092163 (sequence: CCAGCTCTGAACTCAATAATA).
Chemicals
U-13C-labelled glucose (Cambridge Isotope Laboratories CLM-1396-10), U-13C labelled L-glutamine (Cambridge Isotope Laboratories CLM-1822-H-0.1), U-13C labelled L-alanine (Cambridge Isotope Laboratories CLM-2184-H-0.1). NEAAs (Gibco 11140), D-glucose (Sigma G7528), L-glutamine (Sigma G3126), L-alanine (Sigma A7469), glycine (Sigma G8790), L-serine (Sigma S4311), sodium pyruvate (Sigma P5280), sodium L-lactate (Sigma L7022), chloroquine (Waterstone technology 32152).
Primer sequences
Sequences for qPCR primers are as follows: αSMA_Fw, GTGTTGCCCCTGAAGAGCAT, αSMA_Rv: GCTGGGACATTGAAAGTCTCA, Desmin_Fw: TCGGCTCTAAGGGCTCCTC, Desmin_Rv: CGTGGTCAGAAA CTCCTGGTT, GPT1_Fw: GTGCGGAGAGTGGAGTACG, GPT1_Rv: GATGACCTCGGTGAAAGGCT, GPT2_Fw: CATGGACATTGTCGTGAACC, GPT2_Rv: TTACCCAGGACCGACTCCTT.
Kits
Mitochondrial stress test (Seahorse 101706-100) and glycolysis stress test (Seahorse 102194-100) kits were purchased from Seahorse Bioscience. NAD+/NADH kit was purchased from Biovision (Biovision K337-100) and used according to the manufacturer’s instructions.
Statistical analysis
Statistical analysis was done using GraphPad PRISM software. No statistical methods were used to predetermine sample size.
When comparing multiple groups with more than one changing variable (for example, experiments where cells were treated with different shRNAs and with different conditioned media) a two-way ANOVA test was performed. For experiments where we analysed one variable for multiple conditions, a one-way ANOVA was performed. In both cases, ANOVA analyses were followed by Tukey’s post hoc tests to allow multiple group comparisons. Survival curve statistical analysis was performed using the log-rank (Mantel–Cox) test. When comparing two groups to each other, a Student’s t-test (unpaired, 2-tailed) was performed.
Groups were considered significantly different when P < 0.05. The relevant calculated P values are reported in Supplementary Information, where detailed statistical information for each experiment can also be found.
Ultrasound tumour monitoring
Tumours were identified and dimensions and volume were measured as previously described using high-resolution ultrasound (Vevo 770)29. Briefly, mice were anaesthetized using 3% isoflurane, and abdominal fur was removed using fine clippers and depilatory cream. Pre-warmed sterile saline (100–200 μl) was administered via intraperitoneal injection. Ultrasound gel was applied over the abdominal area and the ultrasound transducer was used to identify abdominal landmark organs (liver/spleen) followed by the pancreas and the tumour. Once identified, the transducer was transferred to the 3D motor stage and a 3D scan was performed for measurement of tumour dimensions and volume. Tumour volumes were contoured as described29.
Trypan blue-exclusion assays
To determine cell viability in starved conditions, cells were plated in complete medium at 50% confluency. Once the cells were attached, medium was replaced with serum-free DMEM. 48 h later, cells were trypsinized, re-suspended in their own medium, diluted in trypan blue (Thermo-scientific 15250061) and counted using a haematocytometer. The percentage of dead cells was determined by trypan blue incorporation.
Xenografts
Xenograft studies were performed as described previously14. Briefly, 2 × 10⁵ 8988T or MiaPaCa2 cells were either injected alone or co-injected into the flanks of nude female mice at 6 weeks of age (Taconic ncrnu-f) with 1 × 10⁶ hPSCs previously infected with shGFP, shATG5 or shATG7 shRNAs under protocol 10-055. Tumour take was monitored visually and by palpation bi-weekly. Tumour diameter and volume were calculated based on caliper measurements of tumour length and height using the formula tumour volume =(length × width2)/2. Animals were considered to have a tumour when the maximal tumour diameter was over 2 mm.
For syngeneic orthotopic injections, black6 female mice at 12 weeks of age (Taconic B6NTac), pre-conditioned with doxycycline diet and kept in doxycycline regimen for the duration of the experiment, were injected in the pancreas with 1 × 10⁵ iKRAS mPDAC cells isolated from a pure black6 PDAC GEMM (KrasG12D, P53 L/+)15 either alone or co-injected with 5 × 10⁵ mPSCs that were previously infected with shGFP, shATG5 or shATG7 shRNAs (or mPSC–shGFP was used alone as a negative control). Briefly, an incision was made on the flank, above the spleen. The spleen was identified and gently pulled out through the incision to expose the pancreas. 10 μl of cell suspension containing 20% of Matrigel (BD-Biosciences 354234) was injected in the tail of the pancreas using a Hamilton syringe that was held in place for 30 s to allow Matrigel polymerization. The spleen and pancreas were carefully re-introduced in the animal and the peritoneum sutured. The wound was clipped with surgical staples and the animals were allowed to recover for 1 week until the beginning of weekly ultra-sound monitoring of tumour take and progression.
Human PDAC orthotopic injections were performed in a similar way, by injecting 5 × 10⁵ MiaPaCa2 and/or 1 × 10⁶ hPSC #1 infected with shGFP, shATG5 or shATG7 shRNAs into the tail of the pancreas of nude female mice (Taconic ncrnu-f) at 8 weeks of age. Animals were considered as tumour-positive when a mass detected in the pancreas reached a volume of at least 1 mm3 as calculated by 3D ultrasound. All animal studies were not blinded or randomized. Studies were performed under DFCI IACUC protocol # 10-055, where the maximal tumour size allowed is less than 2 cm.
Extended Data
Extended Data Figure 1. Pancreatic stellate cells secrete metabolites that PDAC utilize to fuel their metabolism.
a–c, Conditioned medium (CM) from human pancreatic stellate cell (PSC) lines (hPSC#1 and hPSC#2) increases oxygen consumption (OCR) in multiple PDAC cell lines: a, Tu8902, b, MiaPaCa2 and c, Panc-1. Data are represented as per cent increase in OCR in cells treated with conditioned medium versus cells treated with fresh DMEM containing 10% serum. Error bars represent the s.e.m. of n =5 for a and n =3 for b, c, except hPSC#1-conditioned medium in b where n = 4, from independent experiments. One-way ANOVA was performed. a, ***P = 0.0004 for hPSC#1 versus control, P =0.0018 for hPSC#2 versus control; b, ***P < 0.0001; c, *P =0.0293. d, e, Extracellular acidification rate (ECAR) is not significantly altered in 8988T cells when treated with conditioned medium from different cell lines. A representative Seahorse trace is shown in d. Error bars show s.d. of 6 independent wells from a representative tracing from 6 independent experiments (depicted in e). e, Results using conditioned medium from multiple PDAC and PSC lines including primary hPSCs. Error bars represent the s.e.m of n = 3 for MiaPaCa2, IMR-90, primary hPSC#1 and #2, and n = 6 for 8988T conditioned medium and hPSC#1, in independent experiments. f, g, Conditioned medium from hPSC#1 and hPSC#2 harvested in serum-free conditions retains the capacity to increase OCR in 8988T (f) and Tu8902 (g) cell lines. Data are represented as per cent increase in OCR in cells treated with conditioned medium versus cells treated with fresh DMEM without serum. Error bars represent the s.e.m of 3 independent experiments. 1-way ANOVA. f, ***P < 0.0001; g, ***P = 0.0005 for hPSC#1 versus control, P < 0.0001 for hPSC#2 versus control. h, Characterization of PSCs (primary hPSC #1 and #2 and hPSC#1 and #2) by RT–qPCR. Primary PSCs from tumours display an activated stellate cell signature in a similar fashion to that of the hPSC lines, as evidenced by the high levels of expression of the activated fibroblast marker, smooth muscle actin (αSMA), and the stellate cell marker, desmin. mRNA levels are represented as fold change compared to 8988T cells. IMR90 (human fibroblasts derived from lung tissue) and human PSCs derived from disease-free pancreata (primary hPSC N) are included as controls. Note: the transfer of normal PSCs to the tissue culture setting also leads to activation. Expression levels are normalized to β-actin. Error bars represent the s.d. of triplicate wells. i, Activated hPSCs are devoid of lipid droplets, an indicator of the activated state, as illustrated using oil red O staining. Tu8902 is included as a positive staining control. j, Conditioned medium from hPSCs does not alter OCR of non-transformed pancreatic ductal cells (HPDE). Error bars represent the s.d. of quintuplicate wells from a representative experiment (of 3 independent experiments). One-way ANOVA: P > 0.9. k–m, The ability of hPSC-conditioned medium to increase PDAC OCR is retained after boiling at 100 °C for 15 min in both Tu8902 (k) and MiaPaCa2 (l) as well as after three consecutive freeze (−80 °C, 10 min)-thaw (60 °C, 10 min) cycles in 8988T, as depicted in m. Error bars represent the s.d. of 4 independent wells from representative experiments (of 3 experiments). One-way ANOVA. k, *P = 0.0004 for hPSC#1 boiled conditioned medium versus control, P = 0.0001 for hPSC#1-conditioned medium versus control; l, ***P = 0.0002 for hPSC boiled versus control, P < 0.0001 for hPSC versus control; m, *P =0.0011. n, The factor secreted by hPSCs that increases PDAC OCR is retained in the <3-kDa fraction of hPSC-conditioned medium. Error bars represent the s.e.m of 3 independent experiments. One-way ANOVA. *P =0.0175, ***P = 0.0007 for hPSC versus control, P =0.0015 for <3kDa versus control.
Extended Data Figure 2. Alanine is secreted by pancreatic stellate cells and consumed by PDAC cells.
a, Schematic of the metabolomic experiments depicted in Fig. 1d. b, The amino acids alanine, glutamate, proline and asparagine are differentially secreted by PSCs and consumed by PDAC cells. The alanine data here are also presented in Fig. 1d. Error bars represent the s.d. of n = 3 technical replicates from independently prepared samples from individual wells. t-tests were performed, for alanine: *P =0.0176, **P = 0.0097; for glutamate, *P =0.0108, ***P = 0.0024; for proline, *P = 0.0013 for hPSC#1 conditioned medium versus 8988T-conditioned medium, P = 0.0024 for double-conditioned medium versus 8988T-conditioned medium; for asparagine, *P =0.0125. c, A mixture of non-essential amino acids (1 mM of NEAA: alanine, asparagine, aspartate, glutamate, proline and serine) increases MiaPaCa2 OCR in a similar fashion to PSC-conditioned medium. Among these NEAAs, only alanine can increase PDAC OCR to an extent comparable to the NEAA mixture. Data are normalized to cells treated with fresh DMEM with 10% serum. Error bars represent the s.e.m of 3 experiments. ***P < 0.0001. d, Profile of the U-13C-glucose and U-13C-glutamine derived NEAA secretome of hPSCs. Error bars represent the s.d. of n = 3 technical replicates from independently prepared samples from individual wells. e, PSCs were labelled to saturation with U-13C-glucose and U-13C-glutamine. Alanine was the only labelled metabolite that showed a statistically significant increase in the PSC-conditioned medium (compared to 8988T-conditioned medium) and a decrease in the double conditioned medium (PSC-conditioned medium added to 8998T cells). Error bars, s.d. of n = 3 technical replicates from independently prepared samples from individual wells. A two-tailed t-test was performed, ***P < 0.0001. f, Alanine standard curve as determined by LC–MS/MS. Data points for conditioned medium from hPSC (green diamond), 8988T (red triangle) and Tu8902 (red square) are displayed on the alanine standard curve. These data are presented in Fig. 1f in μM per 106 cells. Error bars represent the s.d. of n = 3 technical replicates from independently prepared samples from individual wells. t-test, ***P < 0.0001. g, h, Alanine is secreted by PSCs in the presence (g) or absence (h) of serum. Error bars represent the s.d. of n =3 technical replicates from independently prepared samples from individual wells. t-test performed; g, ***P < 0.0001 for control versus hPSC#1, P =0.0007 for control versus hPSC#2; h, ***P = 0.0003 for control versus hPSC#1, P = 0.0004 for control versus hPSC#2. i, The rate of PSC Ala secretion into conditioned medium was determined over a 72-h period using LC–MS; error bars represent s.d. of n = 4 technical replicates from independently prepared samples from individual wells. j, k, The levels of amino acids (j) and lactate (k) in complete medium conditioned by hPSC#1 were monitored over a 72-h period. Alanine was the most relatively secreted metabolite and surpassed even lactate. Metabolite levels are normalized to time 0 (fresh DMEM with 10% dialysed serum). Error bars represent the s.d. of n = 4 technical replicates from independently prepared samples from individual wells. Two-way ANOVA was performed; ***P < 0.0001. The same data are used for alanine and presented in curves in i–k. l, Alanine was the most avidly consumed amino acid by 8988T cells treated with hPSC#1-conditioned medium. Error bars represent the s.d. of n =4 technical replicates from independently prepared samples from individual wells. Two-way ANOVA was performed; ***P < 0.0001 for the last time-point.
Extended Data Figure 3. Alanine secreted by stellate cells is used by PDAC to fuel biosynthetic reactions.
a–c, Knockdown of GPT1 or GPT2 in PDAC cells (a) significantly attenuates the ability of hPSC-conditioned medium to increase OCR in Tu8902 cells (b). This observation was repeated with conditioned medium from an independent hPSC line in 8988T cells (c). Error bars represent the s.e.m of 3 independent experiments. One-way ANOVA; b, *P =0.0134; c, *P =0.0129. d–j, Metabolic tracing studies using U-13C-Ala and U-13C-pyruvate (Pyr) (f–h). d, Metabolic tracing studies using U-13C-Ala in 8988T cells. Error bars, s.d. of n = 3. Two-way ANOVA was performed: for alanine, ***P < 0.0001; for lactate, ***P =0.0001, **P =0.0086. e, Intracellular accumulation and labelling of alanine in Tu8902 cells treated with 1 mM alanine. Two-way ANOVA was performed: ***P < 0.0001. f–h, Intracellular accumulation and labelling of alanine in 8988T cells treated with 1 mM pyruvate or 1 mM alanine grown in media containing different glucose (Glc) concentrations (0.5, 10, 25 mM). Error bars represent s.d. of n =3. i, j, U-13C-Ala does not contribute to glycolysis or gluconeogenesis as seen for the metabolites glucose 6-phosphate (G6P), fructose 6-phosphate (F6P), fructose bis-phosphate (FBP), glyceraldehyde 3-phosphate (Ga3P), 3-phosphoglycerate (3PG), and phosphoenolpyruvate (PEP) in 8988T (i) or Tu8902 (j) PDAC cell lines. Label can be incorporated in lactate (Lac) independent of glycolysis. Error bars represent s.d. of n =3. k, 1 mM alanine does not significantly increase basal extra cellular acidification rate (ECAR) of 8988T cells. Error bars represent s.d. of 6 replicates. Data presented for a representative experiment (of 3 experiments), P =0.6082. l, m, Alanine does not alter the NAD+/NADH ratio in 8988T cells to the same extent as pyruvate in medium containing either 0.5 mM (l) or 25 mM (m) extracellular glucose. 10 mM pyruvate and 10 mM lactate were included as controls; error bars represent s.e.m of n =4 (l) or n =3 (m) independent experiments. t-test performed; l, *P =0.0205; m, *P =0.0291. n–q, Alanine contributes minimally to lactate in both Tu8902 (n) and 8988T (o–q) cells, and independently of glucose concentrations in medium, as seen by tracing of U-13C-Ala: 0.5 mM (o), 10 mM (p) or 25 mM (q) glucose. Pyruvate labels ~50% of the lactate pool in 8988T cells (o–q) independent of the glucose concentration in the medium. Error bars represent the s.d. of n =3. d–j, n–o, n = 3 technical replicates from independently prepared samples from individual wells
Extended Data Figure 4. Alanine fuels the TCA cycle in 8988T PDAC cells.
a, 1 mM U-13C-Ala labelling of 8988T cells for 24 h shows incorporation of alanine carbon into the TCA cycle metabolites citrate (Cit), isocitrate (Iso), fumarate (Fum), malate (Mal) and NEAAs, aspartate and glutamate, derived thereof. These data are presented in Fig. 2 as fractional labelling (Fig. 2e) and as the percentage of the citrate pool incorporating the label (Fig. 2f). M0 refers to an unlabelled metabolite with no heavy carbons (unlabelled isotopomer, 12C), M1 is an isotopomer with one heavy (13C) carbon that can be in any position in the molecule, M2 is a metabolite with any two heavy carbons (13C), M3 with 3 and so on. The maximal M for a given species represents the fully 13C labelled isotopomer (for example, for citrate that has a 6-carbon skeleton, it would be M6). In the schematic illustration, U-13C-Ala is represented as three red balls, each depicting a labelled carbon atom. This is converted into U-13C-Pyr (M3) and shuttled into the mitochondria. The conversion of U-13C-Pyr to Ac-CoA results in the loss of one carbon as CO2. Ac-CoA is then added to oxaloacetate (OAA) to form 2-13C labelled citrate (M2). This citrate traverses around the TCA cycle and is metabolized into the other TCA cycle metabolites. The carbon labelling patterns are indicated with red (labelled) and white (unlabelled) balls. αKG, α-ketoglutarate; Succ, succinate. b–e, Contribution of alanine and pyruvate to TCA cycle metabolites citrate (b), isocitrate (c), fumarate (d) and malate (e) as shown by U-13C-Ala and U-13C-Pyr tracing in 8988T cells in medium containing 10 mM glucose and 2 mM glutamine. f–k, Contribution of alanine to TCA cycle metabolites citrate (f), isocitrate (g), fumarate (h) and malate (i) as well as the NEAAs Glu (j) and Asp (k) is independent of glucose concentration in the medium, as shown by U-13C-Ala tracing in medium containing 0.5 mM, 10 mM or 25 mM glucose. Data are presented as total ion currents; error bars represent the s.d. of n =3 technical replicates from independently prepared samples from individual wells. The raw data for b–k are presented in Supplementary Information Fig. 2a–j.
Extended Data Figure 5. Alanine carbon contributes to the TCA cycle in multiple PDAC cell lines.
a–d, 1 mM U-13C-Ala labelling of Tu8902 (a), MiaPaCa2 (b), Panc-1 (c) and mPanc96 (d) cells show incorporation of alanine carbon into the TCA cycle metabolites citrate, isocitrate, malate and fumarate and the NEAAs Asp and Glu. Data are presented as total ion currents; error bars represent the s.d. of n = 3 technical replicates from independently prepared samples from individual wells. These data are presented in Fig. 2f as the percentage of the citrate pool incorporating label.
Extended Data Figure 6. Alanine relieves the demand of PDAC cells on glucose and glutamine carbon so that it can fuel other biosynthetic processes.
a, The addition of alanine to PDAC cells labelled with U-13C-glucose significantly increases the unlabelled citrate, with a corresponding reduction in the labelled (M2) citrate. A t-test was performed; ***P =0.0009, *P =0.0169. b–c, Alanine is a meaningful source of carbon for the de novo biosynthesis of the free fatty acids palmitate (b) and stearate (c) in two PDAC cell lines. The sum of the isotopomers from these data are presented in Fig. 2g, h. d–g, The addition of alanine to PDAC cells labelled with U-13C-glucose reduces glucose carbon incorporation into palmitate in 8988T (d) and Tu8902 (e) cells as well as into stearate in both 8988T (f) and Tu8902 (g) PDAC cells. This is shown by a decrease in highly enriched species (M14, M16 for palmitate and M16, M18 for stearate) and an increase in less enriched species (M6, M8, M10 for palmitate and M6, M8, M10, M12 for stearate). h, U-13C-glucose tracing studies illustrate that alanine drives glucose carbon into the serine biosynthetic pathway, as demonstrated by significant increases in fully labelled (M3), glucose-derived 3-phosphoglycerate (3PG), 3-phosphoserine (p-Ser), serine (Ser), and M2 glycine. A t-test was performed; *P = 0.0355 for 3PG (Ala) versus control; ***P = 0.0041 for p-Ser (Ala) versus control; *P = 0.0172 for Ser (Ala) versus control; *P = 0.0123 for Gly (Ala) versus control. i, j, Alanine increases serine biosynthetic pathway activity, as seen for changes in the precursors 3PG and p-Ser. This effect is enhanced in cells grown under low glucose (0.5 mM) conditions (j). A t-test was performed; i, *P =0.0355, ***P =0.0041; j, ***P = 0.0005 for 3PG Ala versus mock, P < 0.0001 for pSer Ala versus mock. k, l, Alanine alters the contribution of glutamine carbon to the TCA cycle as seen by changes in the U-13C-Gln-derived fractional labelling of the TCA metabolites citrate, isocitrate, fumarate and malate upon addition of 1 mM alanine in 8988T (k) and Tu8902 (l) PDAC cell lines. Data are presented as relative metabolite for a, per cent labelling for b–g, k, l, and total ion currents for h–j. Error bars represent the s.d. of n =3 (a, h–l) and n =4 (b–g) technical replicates from independently prepared samples from individual wells. The raw data for k, l are presented in Supplementary Information Fig. 2k, l.
Extended Data Figure 7. Stellate cell autophagy is required to support PDAC cell metabolism through the secretion of alanine.
a, PSCs immunostained for LC3-II display basal autophagy in standard culture conditions as shown by the presence of autophagosomes represented by LC3 puncta (green). Nuclei are counterstained with DAPI (blue). b, Representative images of autophagic puncta in control (shGFP) or autophagy impaired (shATG5 and shATG7) PSCs using an LC3 tandem fluorescence (GFP–RFP) reporter. Knockdown of ATG5 or ATG7 significantly decreases autophagosome formation. c, Quantification of autophagy in PSCs. Error bars represent the s.e.m of n = 13 for shGFP; n = 12 for shATG5#1, shATG7#1 and #2; n = 10 for shATG5#2. Two-way ANOVA: **P = 0.0067 for shGFP versus shATG5#1, ***P =0.0009 for shGFP versus shATG5#2, ***P < 0.0001 for shGFP versus shATG7#1 or #2. d, PDAC-conditioned medium increases autophagy in hPSC cells, as determined using an LC3 tandem fluorescence (GFP–RFP) reporter. The relative abundance of autolysosomes and autophagosomes (red and yellow puncta, respectively) is a measure of flux; data are quantified in Fig. 3c. e, f, Western blot demonstrating knockdown of ATG5 and ATG7 using two independent shRNAs in hPSC#1 (e) and hPSC#2 (f). A decrease in autophagy is shown by a decrease in LC3-II (lower band). g, Suppression of PSC autophagy by ATG5 or ATG7 knockdown attenuates the ability of PSC- (hPSC#2)-conditioned medium to increase PDAC OCR. Error bars represent the s.d. of quadruplicate wells from a representative experiment (of 3 experiments). One-way ANOVA; ***P =0.0006. h, Suppression of PSC autophagy by ATG5 or ATG7 knockdown attenuates the ability of PSC- (hPSC#1)-conditioned medium to increase PDAC OCR in serum-free conditions and this phenotype can be rescued by addition of 1 mM exogenous alanine. Data are normalized to cells treated with serum-free DMEM. Error bars represent the s.e.m of n = 4 for 8988T, 1mM Ala, shGFP groups; n = 3 for shATG5#2, shATG7#1, shATG5#2 + Ala, shATG7#1 + Ala and shGFP + Ala groups in independent experiments. One-way ANOVA; ***P = 0.0004 for control versus 1 mM Ala, P =0.0003 for control versus hPSC, P < 0.0001 for control versus hPSC shATG5 #2 + Ala, P = 0.0002 for control versus hPSC shATG7 #1 + Ala, P < 0.0001 for control versus hPSC + Ala. i, ATG5 or ATG7 knockdown in hPSCs decreases intracellular alanine concentrations compared to shGFP controls. Error bars, s.d. of n = 3 technical replicates from independently prepared samples from individual wells. One-way ANOVA: *** P =0.0020 for hPSC-shGFP versus hPSC-shATG5; P = 0.0040 for hPSC-shGFP versus hPSC-shATG7. j, In serum-free conditions, ATG5 or ATG7 knockdown in hPSCs also decreases the secretion of alanine relative to shGFP controls. Error bars represent s.d. of n = 3 technical replicates from independently prepared samples from individual wells. t-test; *P = 0.0428 for hPSC versus hPSC-shATG5, P = 0.0477 for hPSC versus hPSC-shATG7. k–m, Autophagy inhibition by ATG5 or ATG7 knockdown (e, f, l) or chloroquine (CQ) treatment (10 μM) decreases alanine levels in conditioned medium from hPSC#2 (k) and mouse PSC (m) as compared to shGFP or mock-treated controls. Error bars represent s.d. of n =3 technical replicates from independently prepared samples from individual wells. t-test; k, *P = 0.0213 for shGFP versus shATG7, P =0.02061 for shGFP versus CQ; m, ***P < 0.0001 for shGFP versus shATG5, P =0.0003 for shGFP versus shATG7, P = 0.0001 for shGFP versus CQ. n, Autophagy inhibition has a modest impact on PSC proliferation. Data are plotted as relative cell proliferation in arbitrary units (a.u.). Error bars, s.d. of 4 independent wells from a representative experiment (of 4 experiments). One-way ANOVA; P values for the last time point are as follows: *P = 0.0103 for shGFP versus shATG5#1, *P =0.0124 for shGFP vs shATG5#2, P = 0.6657 for shGFP versus shATG7#1, ***P < 0.0001 for shGFP vs shATG7#2. o, p, Autophagy inhibition does not significantly impact hPSC (o) or mPSC (p) viability following growth for 48 h in serum-free conditions, as shown by a trypan-blue exclusion assay. Error bars represent s.e.m of n = 3 independent experiments.
Extended Data Figure 8. Stellate cell metabolite secretion can support PDAC growth under nutrient-limiting conditions.
a, hPSC-conditioned medium does not significantly affect proliferation of 8988T cells grown in complete medium (25 mM glucose, 4 mM Gln, 10% serum). Alanine supplementation contributes modestly to PDAC growth in complete medium. Error bars represent the s.d. of 6 replicate wells from a representative experiment (of 4 experiments). One-way ANOVA; **P =0.0079. b, c, hPSC #2 or hPSC #3-conditioned medium can sustain in vitro proliferation over 48 h for 8988T (b) and Tu8902 (c) cells, as compared to PDAC-conditioned medium. Data are normalized to growth in serum-free DMEM and complete serum medium is included as a positive control. Error bars represent s.e.m of n = 4 experiments for b and s.d. of quadruplicate wells from a representative experiment (of 3 experiments) for c. One-way ANOVA; b, ***P < 0.0001; c, **P =0.0091, ***P < 0.0001. d, hPSC-conditioned medium facilitates proliferation of 8988T cells grown in low glucose (0.5 mM) medium. Conditioned medium from hPSCs in which autophagy is inhibited loses the ability to support PDAC growth. Supplementation of medium with exogenous alanine rescues PDAC proliferation under low glucose conditions in a manner akin to the positive control, 10 mM glucose-containing medium. Error bars represent the s.e.m of 4 independent experiments. One-way ANOVA; *P = 0.0420 for GFP versus control, P = 0.0158 for complete medium versus control; **P =0.0054. e–g, hPSC#1-conditioned medium increases PDAC proliferation in MiaPaCa2 (e), Tu8902 (f) and 8988T (g) cells in serum-free medium. Conditioned medium from hPSCs in which autophagy is inhibited is less effective at maintaining PDAC proliferation. Alanine increases PDAC proliferation under serum-free conditions, and it can rescue the proliferation-inducing capacity of autophagy-deficient hPSC-conditioned medium (g). The addition of 10% serum is included as a positive control. Error bars represent the s.e.m of 8 independent experiments for e, f and 3 independent experiments for g. One-way ANOVA; e, ***P = 0.0011 for shGFP versus control, ***P =0.0013 for 1 mM alanine versus control, ***P = 0.0001 for complete medium versus control; f, ***P = 0.0007 for shGFP versus control, **P =0.0042 for alanine versus control, ***P < 0.0001 for complete medium versus control; g, ***P < 0.0001. h, i, Mouse PSC-conditioned medium increases proliferation in 8988T (h) and MiaPaCa2 (i) PDAC cell lines over 48 h in serum-free conditions. This effect is impaired when the conditioned medium is collected from mouse PSCs in which autophagy is inhibited. Error bars represent s.e.m of n = 3 experiments. One-way ANOVA; h, ***P = 0.0002 for shGFP versus control, ***P < 0.0001 for complete medium versus control; i, *P =0.0108, ***P =0.0002. j–l, PDAC proliferation under low glucose (0.5 mM) conditions can be rescued by 1 mM alanine or pyruvate, but not by 1 mM lactate in 8988T (j), Tu8902 (k) and MiaPaCa2 (l) PDAC cell lines. Error bars represent the s.d. of quadruplicate wells from a representative experiment (of 4 experiments). One-way ANOVA; j, ***P =0.0013, **P = 0.0085 for 1 mM alanine versus control, P = 0.0070 for 10 mM glucose versus control; k, *P =0.0323 for 1 mM alanine versus control, ***P = 0.0044 for 1 mM pyruvate versus control, ***P = 0.0010 for 10mM glucose versus control; l, **P =0.0060 for 1 mM alanine versus control, ***P = 0.0008 for 1 mM pyruvate versus control, ***P = 0.0018 for 10 mM glucose media versus control. m, 8988T PDAC cells depleted for GPT1 and grown in serum-free medium do not proliferate in response to hPSC-conditioned medium or alanine, relative to control shGFP or GPT2-depleted cells. Data are represented as fold-change over 48 h and complete medium is included as a positive control. Error bars represent s.e.m. from 3 independent experiments. Two-way ANOVA; for shGFP, ***P < 0.0001 for control versus hPSC#1, ***P = 0.0060 for control versus alanine, ***P < 0.0001 for control versus complete medium; for shGPT1 #1, ***P = 0.0005; for shGPT1 #2, ***P < 0.0001, *P = 0.0493; for shGPT2 #1, ***P < 0.0001; for shGPT2 #2, ***P = 0.0004 for control versus hPSC#1, ***P < 0.0001 for others.
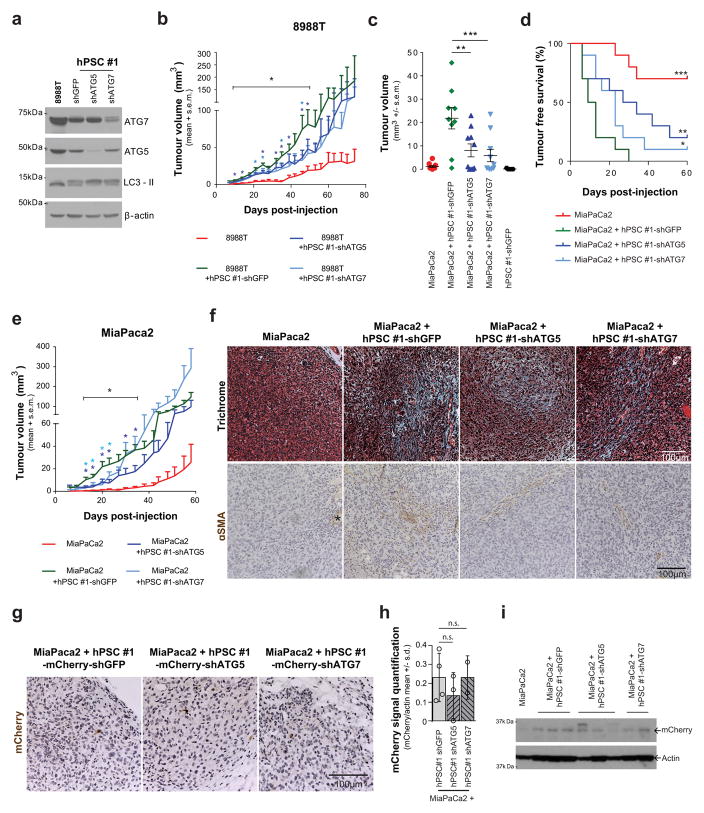
Extended Data Figure 9. Subcutaneous PDAC xenograft tumour growth is supported by autophagy-competent pancreatic stellate cells.
a, Immunoblot for ATG5 and ATG7 knock-down in hPSC#1 cells infected before subcutaneous co-injection. LC3-II shows the inhibition of autophagy in these cells. b, Tumour growth is enhanced following co-injection of hPSCs with 8988T PDAC cells. This affect is significantly attenuated when autophagy is suppressed in the hPSCs during the initial phases of tumour growth. Error bars represent the s.e.m for 10 tumours per condition at each time point. t-tests were performed for each time point; *P < 0.05. c–e, Co-injection of MiaPaCa-2 PDAC cells with PSCs significantly enhances early tumour growth, analysed at 25 days post-injection (c) and decreases tumour-free survival (d). This effect is significantly attenuated when autophagy is suppressed in the PSCs. e, Tumour growth kinetics. Error bars represent the s.e.m. of 10 tumours per condition per time point, except for the PSC-shGFP control, for which only 5 animals were injected. c, One-way ANOVA, **P =0.0099, ***P =0.0020; d, log-rank Mantel-Cox test, *P =0.0450, **P =0.00174, ***P < 0.0001; e, t-tests for each time point, *P < 0.05. f, Representative sections for endpoint analysis from tumours for each experimental group stained with trichrome (top, blue) or α-smooth muscle actin (αSMA) (bottom, brown). Minimal residual intra-tumour collagen deposition and stromal content remains at endpoint. The asterisk in the αSMA staining images indicates a vessel and serves as a positive control. g–i, Early time-point analysis of MiaPaCa2 cells co-injected with RFP-labelled hPSCs in nude mouse flanks; tumours removed at 2 weeks post-injection. g, Representative sections of tumours stained with mCherry, a lineage label for the injected PSCs, illustrating minimal stromal content even at early time points. h, RFP immunoblot quantification as a marker of remaining RFP-labelled stellate cells injected. Four tumours originating from MiaPaCa2 cells co-injected with control shGFP-hPSCs, three tumours from MiaPaCa2 cells co-injected with shATG5-hPSCs and two tumours from MiaPaCa2 cells co-injected with shATG7-hPSCs were quantified. Error bars represent the s.d. of 2–4 lanes quantified per condition, as indicated. t-test; n.s., P = 0.5982 for shGFP versus shATG5, P > 0.9999 for shGFP versus shATG7. i, RFP immunoblot as a marker of remaining RFP-labelled stellate cells injected. Quantification shown in h. The full blot containing all nine samples is presented in Supplementary Fig. 1e.
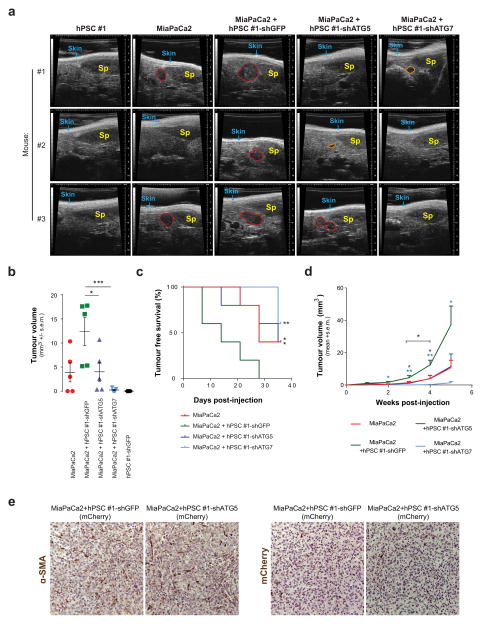
Extended Data Figure 10. Orthotopic PDAC xenograft tumour growth is supported by autophagy-competent pancreatic stellate cells.
a, Representative high-resolution ultrasound images of the pancreata of nude mice 4 weeks after intra-pancreatic injection with MiaPaCa2 cells alone or with control shGFP or autophagy-impaired shATG5 or shATG7 hPSCs. hPSC-only injections are included as negative controls. Skin and spleen (Sp) are indicated as spatial references; tumours are outlined in red; prospective tumours that did not meet threshold at the time of imaging are outlined in orange. b, c, Co-injection of MiaPaCa-2 PDAC cells with PSCs in the pancreata of nude mice significantly enhances early tumour growth at 21 days post-injection (b) and decreases tumour-free survival (c) in this orthotopic xenograft model. Again, this effect is significantly attenuated when autophagy is suppressed in the PSCs. Error bars, s.e.m. of 5 tumours per condition per time point. b, One-way ANOVA; *P =0.0283, ***P =0.0010; c, log-rank Mantel-Cox test; *P = 0.0278 for MiaPaCa2 + hPSC#1-shGFP versus MiaPaCa2 + hPSC#1-shATG5, *P =0.0288, ***P = 0.0017 for MiaPaCa2 + hPSC#1-shGFP versus MiaPaCa2. d, Tumour growth kinetics following co-injection of MiaPaCa2 PDAC cells with hPSCs show enhanced tumour growth. This affect is significantly attenuated when autophagy is suppressed in the hPSCs during the initial phases of tumour growth. Error bars represent the s.e.m. of tumours from 5 animals measured per condition at each time point. t-tests for each time point; *P < 0.05. e, Representative endpoint sections of tumours 5 weeks post-injection stained with αSMA, a marker of PSCs, and the lineage label mCherry. Together, these stains illustrate that minimal stromal content remains at endpoint.
Supplementary Material
Acknowledgments
We thank Kimmelman laboratory members for reading the manuscript, A. Yang for help with orthotopic injections, M. Yuan and S. Breitkopf for technical support with mass spectrometry, E. Sicinska for resected PDAC specimens, and the Dana-Farber/Harvard Cancer Center Rodent Histopathology Core for assistance with tissue processing. DFHCC is supported in part by NIH 5P30CA06516. A.C.K. is supported by NIH grant GM095567, NCI grants R01CA157490, R01CA188048, ACS Research Scholar Grant (RSG-13-298-01-TBG), and the Lustgarten Foundation. C.A.L. is supported by a PanCAN-AACR Pathway to Leadership award and a Dale F. Frey award from the Damon Runyon Cancer Research Foundation (DFS-09-14). Metabolomics studies performed at the University of Michigan were supported by NIH grant DK097153. L.C.C. was supported by P01CA117969, PanCAN-AACR and the Lustgarten Foundation. J.M.A. was supported by P30CA006516 and P01CA120964. R.M.E. is an investigator of the Howard Hughes Medical Institute and March of Dimes Chair in Molecular and Developmental Biology at the Salk Institute, and is supported in part by grants from The Lustgarten Foundation and a Stand Up to Cancer Dream Team Translational Cancer Research Grant, a Program of the Entertainment Industry Foundation (SU2C-AACR-DT0509).
Footnotes
Online Content Methods, along with any additional Extended Data display items and Source Data, are available in the online version of the paper; references unique to these sections appear only in the online paper.
Supplementary Information is available in the online version of the paper.
The authors declare competing financial interests: details are available in the online version of the paper.
Readers are welcome to comment on the online version of the paper.
Reviewer Information Nature thanks J. Debnath and the other anonymous reviewer(s) for their contribution to the peer review of this work.
Author Contributions C.M.S. performed or participated in the conception and performance of all experiments. D.E.B. and X.W. participated in tissue culture imaging and animal studies. C.J.H. conducted kinetic metabolite release, capture and quantification metabolomics studies with support from D.K. L.Z. performed the associated metabolomics and fatty acid analyses. J.M.A. supervised the metabolite tracing metabolomics experiments as a core service. M.H.S., D.K., R.F.H, A.K.W. and H.Y. provided essential reagents. R.M.E. and L.C.C. provided intellectual feedback and support. C.M.S., C.A.L. and A.C.K. conceived the project, planned and guided the research, and wrote the paper.
References
- 1.Hidalgo M. Pancreatic cancer. N Engl J Med. 2010;362:1605–1617. doi: 10.1056/NEJMra0901557. [DOI] [PubMed] [Google Scholar]
- 2.Sousa CM, Kimmelman AC. The complex landscape of pancreatic cancer metabolism. Carcinogenesis. 2014;35:1441–1450. doi: 10.1093/carcin/bgu097. [DOI] [PMC free article] [PubMed] [Google Scholar]
- 3.Whatcott CJ, et al. Desmoplasia in primary tumors and metastatic lesions of pancreatic cancer. Clin Cancer Res. 2015;21:3561–3568. doi: 10.1158/1078-0432.CCR-14-1051. [DOI] [PMC free article] [PubMed] [Google Scholar]
- 4.Feig C, et al. The pancreas cancer microenvironment. Clin Cancer Res. 2012;18:4266–4276. doi: 10.1158/1078-0432.CCR-11-3114. [DOI] [PMC free article] [PubMed] [Google Scholar]
- 5.Erkan M, et al. StellaTUM: current consensus and discussion on pancreatic stellate cell research. Gut. 2012;61:172–178. doi: 10.1136/gutjnl-2011-301220. [DOI] [PMC free article] [PubMed] [Google Scholar]
- 6.Gore J, Korc M. Pancreatic cancer stroma: friend or foe? Cancer Cell. 2014;25:711–712. doi: 10.1016/j.ccr.2014.05.026. [DOI] [PMC free article] [PubMed] [Google Scholar]
- 7.Apte MV, Wilson JS. Dangerous liaisons: pancreatic stellate cells and pancreatic cancer cells. J Gastroenterol Hepatol. 2012;27(Suppl 2):69–74. doi: 10.1111/j.1440-1746.2011.07000.x. [DOI] [PubMed] [Google Scholar]
- 8.Özdemir BC, et al. Depletion of carcinoma-associated fibroblasts and fibrosis induces immunosuppression and accelerates pancreas cancer with reduced survival. Cancer Cell. 2014;25:719–734. doi: 10.1016/j.ccr.2014.04.005. [DOI] [PMC free article] [PubMed] [Google Scholar]
- 9.Rhim AD, et al. Stromal elements act to restrain, rather than support, pancreatic ductal adenocarcinoma. Cancer Cell. 2014;25:735–747. doi: 10.1016/j.ccr.2014.04.021. [DOI] [PMC free article] [PubMed] [Google Scholar]
- 10.Feig C, et al. Targeting CXCL12 from FAP-expressing carcinoma-associated fibroblasts synergizes with anti-PD-L1 immunotherapy in pancreatic cancer. Proc Natl Acad Sci USA. 2013;110:20212–20217. doi: 10.1073/pnas.1320318110. [DOI] [PMC free article] [PubMed] [Google Scholar]
- 11.Kamphorst JJ, et al. Human pancreatic cancer tumors are nutrient poor and tumor cells actively scavenge extracellular protein. Cancer Res. 2015;75:544–553. doi: 10.1158/0008-5472.CAN-14-2211. [DOI] [PMC free article] [PubMed] [Google Scholar]
- 12.Olive KP, et al. Inhibition of Hedgehog signaling enhances delivery of chemotherapy in a mouse model of pancreatic cancer. Science. 2009;324:1457–1461. doi: 10.1126/science.1171362. [DOI] [PMC free article] [PubMed] [Google Scholar]
- 13.Commisso C, et al. Macropinocytosis of protein is an amino acid supply route in Ras-transformed cells. Nature. 2013;497:633–637. doi: 10.1038/nature12138. [DOI] [PMC free article] [PubMed] [Google Scholar]
- 14.Son J, et al. Glutamine supports pancreatic cancer growth through a KRAS-regulated metabolic pathway. Nature. 2013;496:101–105. doi: 10.1038/nature12040. [DOI] [PMC free article] [PubMed] [Google Scholar]
- 15.Ying H, et al. Oncogenic Kras maintains pancreatic tumors through regulation of anabolic glucose metabolism. Cell. 2012;149:656–670. doi: 10.1016/j.cell.2012.01.058. [DOI] [PMC free article] [PubMed] [Google Scholar]
- 16.Hwang RF, et al. Cancer-associated stromal fibroblasts promote pancreatic tumor progression. Cancer Res. 2008;68:918–926. doi: 10.1158/0008-5472.CAN-07-5714. [DOI] [PMC free article] [PubMed] [Google Scholar]
- 17.Yuan M, Breitkopf SB, Yang X, Asara JM. A positive/negative ion–switching, targeted mass spectrometry–based metabolomics platform for bodily fluids, cells, and fresh and fixed tissue. Nat Protocols. 2012;7:872–881. doi: 10.1038/nprot.2012.024. [DOI] [PMC free article] [PubMed] [Google Scholar]
- 18.Yang A, et al. Autophagy is critical for pancreatic tumor growth and progression in tumors with p53 alterations. Cancer Discov. 2014;4:905–913. doi: 10.1158/2159-8290.CD-14-0362. [DOI] [PMC free article] [PubMed] [Google Scholar]
- 19.Yang S, et al. Pancreatic cancers require autophagy for tumor growth. Genes Dev. 2011;25:717–729. doi: 10.1101/gad.2016111. [DOI] [PMC free article] [PubMed] [Google Scholar]
- 20.Zhao H, et al. Tumor microenvironment derived exosomes pleiotropically modulate cancer cell metabolism. eLife. 2016;5:e10250. doi: 10.7554/eLife.10250. [DOI] [PMC free article] [PubMed] [Google Scholar]
- 21.Sonveaux P, et al. Targeting lactate-fueled respiration selectively kills hypoxic tumor cells in mice. J Clin Invest. 2008;118:3930–3942. doi: 10.1172/JCI36843. [DOI] [PMC free article] [PubMed] [Google Scholar]
- 22.Tape CJ, et al. Oncogenic KRAS regulates tumor cell signaling via stromal reciprocation. Cell. 2016;165:910–920. doi: 10.1016/j.cell.2016.03.029. [DOI] [PMC free article] [PubMed] [Google Scholar]
- 23.Serrao EM, et al. MRI with hyperpolarised [1-13C] pyruvate detects advanced pancreatic preneoplasia prior to invasive disease in a mouse model. Gut. 2015 doi: 10.1136/gutjnl-2015-310114. http://dx.doi.org/10.1136/gutjnl-2015-310114. [DOI] [PMC free article] [PubMed]
- 24.Trinquier G, Sanejouand YH. Which effective property of amino acids is best preserved by the genetic code? Protein Eng. 1998;11:153–169. doi: 10.1093/protein/11.3.153. [DOI] [PubMed] [Google Scholar]
- 25.Sherman MH, et al. Vitamin D receptor-mediated stromal reprogramming suppresses pancreatitis and enhances pancreatic cancer therapy. Cell. 2014;159:80–93. doi: 10.1016/j.cell.2014.08.007. [DOI] [PMC free article] [PubMed] [Google Scholar]
- 26.Ouyang H, et al. Immortal human pancreatic duct epithelial cell lines with near normal genotype and phenotype. Am J Pathol. 2000;157:1623–1631. doi: 10.1016/S0002-9440(10)64800-6. [DOI] [PMC free article] [PubMed] [Google Scholar]
- 27.Metallo CM, et al. Reductive glutamine metabolism by IDH1 mediates lipogenesis under hypoxia. Nature. 2012;481:380–384. doi: 10.1038/nature10602. [DOI] [PMC free article] [PubMed] [Google Scholar]
- 28.Fernandez CA, Des Rosiers C, Previs SF, David F, Brunengraber H. Correction of 13C mass isotopomer distributions for natural stable isotope abundance. J Mass Spectrom. 1996;31:255–262. doi: 10.1002/(SICI)1096-9888(199603)31:3<255::AID-JMS290>3.0.CO;2-3. [DOI] [PubMed] [Google Scholar]
- 29.Sastra SA, Olive KP. Quantification of murine pancreatic tumors by high-resolution ultrasound. Methods Mol Biol. 2013;980:249–266. doi: 10.1007/978-1-62703-287-2_13. [DOI] [PMC free article] [PubMed] [Google Scholar]
Associated Data
This section collects any data citations, data availability statements, or supplementary materials included in this article.


