Abstract
In this work we utilize optical coherence elastography (OCE) to assess the effects of UV-A/riboflavin corneal collagen crosslinking (CXL) on the mechanical anisotropy of in situ porcine corneas at various intraocular pressures (IOP). There was a distinct meridian of increased Young’s modulus in all samples, and the mechanical anisotropy increased as a function of IOP and also after CXL. The presented noncontact OCE technique was able to quantify the Young’s modulus and elastic anisotropy of the cornea and their changes as a function of IOP and CXL, opening new avenues of research for evaluating the effects of CXL on corneal biomechanical properties.
OCIS codes: (170.4460) Ophthalmic optics and devices, (170.4470) Ophthalmology, (170.4500) Optical coherence tomography, (170.6935) Tissue characterization
1. Introduction
The anisotropic characteristics of corneal elastic properties may provide valuable information for determining the onset and severity of many diseases. For example, the collagen fibril orientation in human corneas with keratoconus is distinctly different than in healthy corneas [1]. While techniques, such as X-ray scattering analysis have provided a wealth of information about collagen fibril organization in the cornea due to their very high spatial resolutions, they require fixed samples and are fundamentally infeasible for in vivo applications.
The mechanical anisotropy of the cornea has previously been studied by various methods, such as inflation tests combined with finite element modeling [2], mechanical testing on excised strips of corneal tissue at orthogonal angles [3], and computational modeling utilizing X-ray scattering data [4]. These techniques have provided valuable insight into the elastic anisotropy of the cornea, but they are currently impractical for in vivo use.
In addition to the inherent collagen structure, intraocular pressure (IOP) can also influence dynamic biomechanical measurements of the cornea [5], including the elastic anisotropy [6, 7]. Supersonic shear wave imaging (SSI) has measured the elastic anisotropy of the cornea at various IOPs in vivo, but required general anesthesia and immersion of the cornea in water [6]. The Young’s modulus of the cornea shows a measurable hysteresis while cycling IOP (i.e. increasing then decreasing IOP) [8], but the elastic anisotropic hysteresis has not yet been investigated.
Riboflavin/UV-A corneal collagen cross-linking (CXL) is a clinical technique for treating keratoconus that stiffens the cornea and increases its resistance to further degeneration [9, 10]. While it has been shown that CXL alters corneal collagen fibril organization [11], subsequently altering corneal mechanical properties [12], there have been no direct investigations on the changes in the elastic anisotropy of the cornea caused by CXL.
Various approaches have been used to evaluate corneal biomechanical properties. The Ocular Response Analyzer (Reichert Technologies, Buffalo, NY, USA) and CorVis ST (Oculus Optigeräte GmbH, Wetzlar, Germany) detect corneal dynamic movement in response to a large air puff [13, 14]. However, there is conflicting evidence in the literature on the ability of these devices to detect changes in corneal biomechanical properties due to pathologies or therapeutic interventions such as CXL [15–18]. Evaluating the mechanical anisotropy with these measurements may not be feasible because of the type of the load and detection techniques. Brillouin microscopy, on the other hand, is an emerging noninvasive optical technique that can provide depth-resolved maps of elasticity distribution by investigating the Brillouin frequency shift within the corneal tissue and may be able to provide measurements of shear anisotropy with recent developments [19]. However, accurately quantifying mechanical parameters such as viscoelasticity from the Brillouin shift is still under investigation.
Optical coherence tomography [20] (OCT) based elastography, which is termed optical coherence elastography [21, 22] (OCE), is a rapidly emerging technique to obtain the local biomechanical information of tissues. OCE is similar in principle to traditional elastography imaging techniques where the respective parent imaging modality is used to detect externally-induced mechanical deformations [22]. While the OCT structural image has spatial resolution on the order of a few micrometers, displacement sensitivity can reach the sub-nanometer scale by analyzing the phase of the complex OCT signal [23]. OCT is generally limited to an imaging depth of a few millimeters in scattering media such as skin, but optical penetration is not an issue for the majority of ophthalmological applications due to the transparency of the anterior segment of the eye. Thus, OCE is specifically suitable for noninvasively evaluating the biomechanical properties of ocular tissues such as the cornea and crystalline lens [22].
In this work, we describe a noncontact method of assessing the elastic anisotropy and hysteresis of the cornea while increasing and decreasing IOP utilizing noncontact OCE. A focused air-pulse induced low amplitude (µm scale) elastic waves in fresh in situ porcine corneas, which is in contrast to the bulk displacement of the entire cornea (and even eye-globe) induced by the air puff in the ORA and CorVis. The elastic wave propagation was imaged at stepped meridional angles by a phase-stabilized swept source optical coherence tomography (PhS-SSOCT) system. The group velocity of the elastic wave was translated to Young’s modulus and was spatially mapped to investigate the elastic anisotropy of the cornea at various IOPs. Furthermore, the effects of CXL on corneal Young’s modulus and mechanical anisotropy was investigated.
2. Methods
2.1. Experimental setup
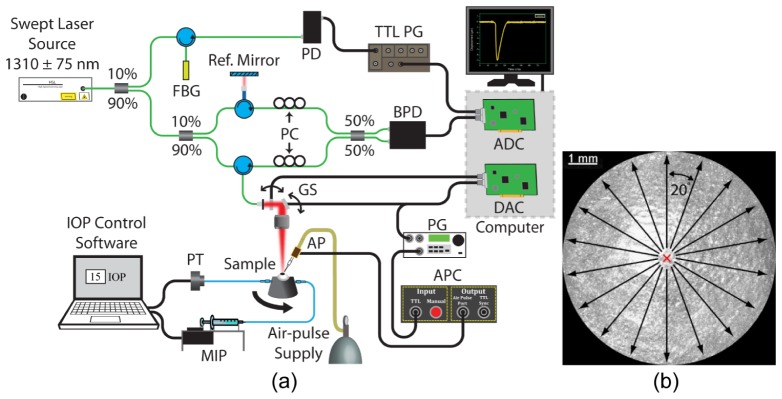
A home-built OCE system (schematic illustration is shown in Fig. 1(a)) consisted of three primary subsystems: PhS-SSOCT system, a focused air-pulse delivery system, and an artificial IOP control system. The PhS-SSOCT system was composed of a broadband swept laser source (HSL2000, Santec, Inc., Hackensack, NJ) with a central wavelength of ~1310 nm, scan range of ~150 nm, A-scan rate of 30 kHz, output power of ~39 mW, axial resolution of ~11 µm in air, and phase stability of ~40 nm in the cornea. Further information regarding the PhS-SSOCT system can be found in our previous work [24]. The air-pulse delivery system consisted of an air-pulse controller which drove a solenoid-controlled air gate [25]. The focused air-pulse was expelled through the air gate and out of the air-port, which had a flat edge and inner diameter of ~150 µm. The air-pulse induced a small amplitude displacement in the sample, which then propagated as an elastic wave. Successive M-mode images (holding the OCT probe beam stationary and recording over time) were taken along a ~7 mm line (M-B-mode imaging). By synchronizing air-pulses with each M-mode image, the PhS-SSOCT system effectively imaged the same elastic wave [26].
Fig. 1.
(a) OCE experimental setup. ADC: analog to digital converter; AP: air-port; APC: air-port controller; BPD: balanced photodetector; DAC: digital to analog converter; FBG; fiber Bragg grating; GS: galvanometer scanners; MIP: micro-infusion pump; PC: polarization controller; PD: photodetector; PG: pulse generator; PT: pressure transducer; TTL PG: transistor-transistor logic pulse generator. (b) En-face view of a 3D OCT image of a porcine cornea. The red “X” indicates the excitation position, and the arrows are elastic wave propagation meridional angles that were imaged.
Fresh juvenile (4 to 6 months) porcine eyes (Sioux-Preme Packing Co., Sioux City, IA) were obtained and kept fresh at 4°C in saline. In total, 4 pairs of eyes were used, where each pair of eyes was from the same animal (i.e. fellow eyes), for a total of 8 samples. All experiments were conducted immediately upon receipt of the samples, which was within 24 hours of enucleation. During the OCE experiments, the whole eye-globes were positioned in a custom holder that was mounted on a rotational stage. After removal of extraneous tissues such as muscles, the eye-globes were cannulated with two needles for artificial IOP control [27]. One needle was connected to a micro-infusion pump, and the other needle was connected to a pressure transducer to form the closed-loop IOP control system. The distance between the air-pulse port and the sample was kept at ~500 μm. The air source pressure was controlled by a pneumatic valve and monitored by a standard air pressure gauge. The air-pulse pressure on the sample from the port was ~1 to ~9 Pa, depending on the IOP. The air-port was precisely positioned with a 3D linear micrometer stage, and the air-pulse was directed at the apex of the cornea with an incidence angle of approximately 40°.
The elastic waves were imaged by 251 successive M-mode images that were 100 ms long each, spanning ~7 mm across the corneas with the apex at the middle of the OCE scanning meridian. After one angle was acquired, the eye-globes were rotated by 20°, and the OCE measurement was repeated along the new meridian. Because the elastic waves were induced at the apex, which was also at the center of the OCE scan region, two meridional angles were acquired at once. Thus, the samples were rotated only 9 times for 180° in order to obtain a full rotation. An illustration of the acquisition methodology is shown in Fig. 1(b). The OCE measurements were repeated at IOPs increasing from 15 to 30 mmHg at increments of 5 mmHg. To investigate the elastic anisotropic hysteresis, the IOP was then decreased from 30 to 15 mmHg, also in 5 mmHg steps. Before the OCE measurements were taken, the corneas were preconditioned by cycling the IOP between 15 and 30 mmHg twice. To ensure that the corneas were properly hydrated, the corneas were instilled with a saline solution every 4 minutes during the OCE measurements. The central corneal thickness (CCT) was monitored to ensure that any effects of dehydration on the corneal Young’s modulus were minimized.
CXL was performed by a technique that mimics the standard “Dresden” protocol [28]. The epithelium was removed with a blunt surgical instrument, and a 0.1% riboflavin solution in 20% Dextran was topically applied to the cornea every 5 minutes. After 30 minutes, the cornea was irradiated for 30 minutes (3 mW/cm2, 365 nm). During UV irradiation, the cornea was instilled with the riboflavin solution every 5 minutes. Immediately after the CXL procedure was completed, the OCE measurements were taken.
OCE measurements were made on a total of 8 eyes (4 pairs). In two pairs of fellow eyes, both corneas were untreated. In the two remaining pairs, OCE measurements were made on one untreated cornea and the CXL-treated fellow cornea.
2.2. Group velocity and Young’s modulus calculations
The raw unwrapped temporal phase profiles from the surface of the cornea were converted to axial displacement [29], and the raw unwrapped temporal phase profiles inside the cornea were corrected due to the motion of the corneal surface and the refractive index mismatch between air and the corneas [30] with the refractive index of the whole cornea as 1.376 [31].
A sliding window (~750 µm along the elastic wave propagation path) was utilized to obtain a spatial map of the elastic wave group velocity. The normalized temporal displacement profiles for a given imaged in-depth layer were cross-correlated with the displacement profile at the first position of that given window. Cross-correlation analysis yielded the elastic wave propagation delays, which were then linearly fitted to the corresponding propagation distances to calculate the velocity for that given in-depth layer and for that given velocity calculation window [32]. When calculating the elastic wave propagation distances, the velocity calculations utilized the curved path following the cornea surface, as determined from the structural OCT image, to ensure accuracy of the velocity calculations [33]. The velocity calculated for a given window was spatially mapped as the velocity for the central pixel of the window. The window was then shifted by one pixel (~28 µm along the elastic wave propagation path), and the procedure was repeated. The procedure was reiterated for each in-depth layer of the cornea and averaged depth-wise over the entire corneal thickness, which resulted in a 2D elastic wave group velocity map illustrating the depth-wise averaged spatial distribution of the elastic wave velocities.
The Young’s modulus, E, was quantified from the elastic wave group velocity, cg, by the surface wave equation (SWE) [22]:
| (1) |
where ρ = 1062 kg/m3 was the density of the cornea [34] and ν = 0.49 was the Poisson’s ratio to account for the near incompressibility of the corneal tissue [35]. Here, we assumed the density of the cornea was constant through the tissue.
2.3. Anisotropy calculations
The corneal mechanical anisotropy was quantified by a modified planar anisotropy coefficient, rθ [36]. While other anisotropic parameters such as fractional anisotropy can provide a single number to quickly provide information about the overall anisotropic behavior of the sample [37], rθ can illustrate the orientation of the anisotropy.
The planar anisotropy coefficient [36], rθ, was modified for use in this study by calculating rθ for every OCE measured meridional angle as:
| (2) |
where Eθ was the average Young’s modulus over all measured radial distances along that given meridional angle, Eθ + 90° was the mean Young’s modulus over all measured radial distances 90° clockwise from the given meridional angle, and Eθ + 45° was the average Young’s modulus over all measured radial distances 45° clockwise from the given meridional angle. Because angular measurements were taken every 20°, the values for Eθ + 90° and Eθ + 45° were linearly interpolated from the OCE measurements. The standard deviation of rθ for all angles was used to quantify the overall anisotropy of a sample at a given IOP. A lower standard deviation of rθ indicates a lesser degree of anisotropy, and a greater standard deviation of rθ related to a greater degree of anisotropy.
3. Results
The results from one pair of fellow samples, where one cornea was untreated and the fellow cornea was CXL-treated are presented, followed by a summary from all samples. Results from one pair of samples where both corneas were untreated are provided in the Appendix. The results from the untreated paired samples demonstrated that there was no noticeable difference in Young’s modulus or elastic anisotropy between fellow samples, and thus, we can utilize an untreated cornea as a control, while the fellow cornea can undergo the CXL treatment.
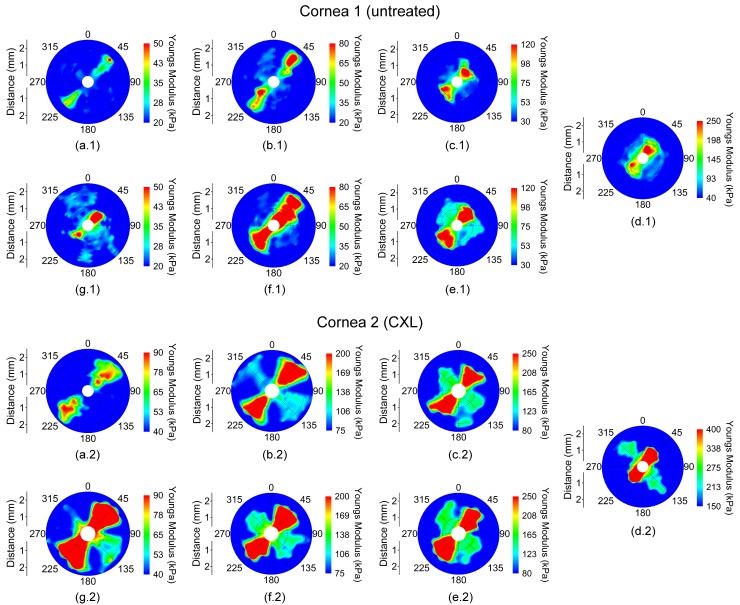
The spatially-mapped Young’s modulus for a pair of fellow eyes where cornea 1 was untreated and cornea 2 was CXL-treated while cycling IOP is shown in Fig. 2. The vertical axis (0°/180°) corresponds to the superior/inferior axis, and the horizontal axis (90°/270°) was the nasal/temporal axis of the eye. In the presented figures, the samples are oriented such that the aforementioned axes are parallel between fellow corneas instead of mirrored for easier contralateral comparison. The Young’s modulus scales (i.e. color) are not the same between the eyes to demonstrate the orientation and degree of elastic anisotropy.
Fig. 2.
Young’s modulus maps in a pair of fellow in situ porcine corneas (i.e from the same animal) in the whole eye-globe configuration while increasing IOP at (a) 15, (b) 20, (c) 25, and (d) 30 mmHg and while decreasing IOP at (e) 25, (f) 20, and (g) 15 mmHg. Cornea 1 was untreated while Cornea 2 was CXL-treated. Please note that the Young’s modulus scale is only the same for a given IOP for each sample.
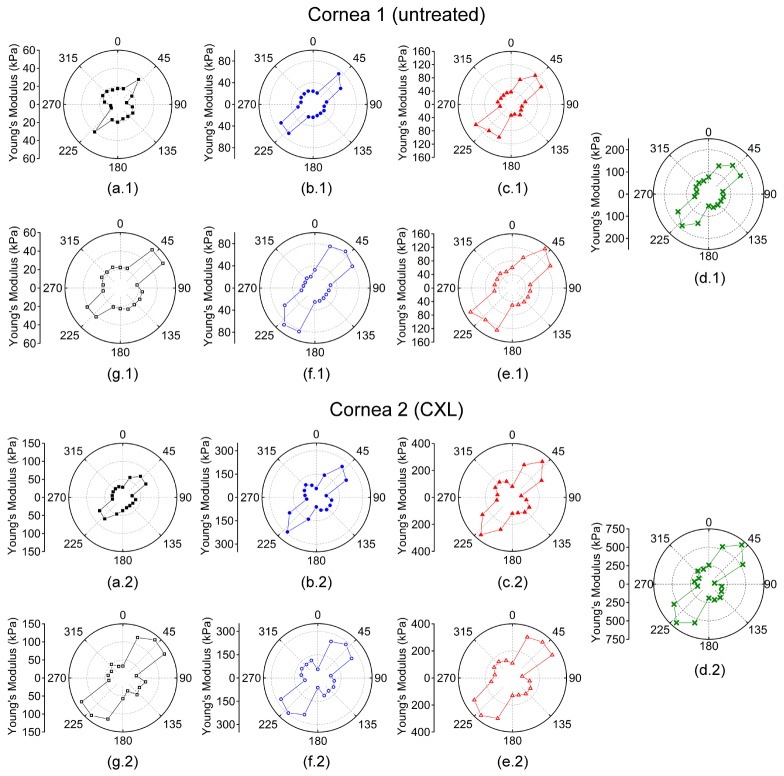
The Young’s modulus was averaged meridional angle-wise, as plotted in Fig. 3, for each sample at a given IOP to calculate rθ. From Figs. 2 and 3, the orientation of the elastic anisotropy is clearly evident. The corneas were stiffer along the 45° and 225° meridian. However, a secondary stiffer meridian appeared that was orthogonal to the primarily stiffer meridian after CXL. The overall Young’s modulus of the cornea increased as a function of IOP, and the untreated cornea had a lower overall Young’s modulus at any given IOP as compared to the CXL-treated sample at the same IOP.
Fig. 3.
Polar plots of the meridional angle-wise average Young’s modulus while increasing IOP at (a) 15, (b) 20, (c) 25, and (d) 30 mmHg and while decreasing IOP at (e) 25, (f) 20, and (g) 15 mmHg. Cornea 1 was untreated while Cornea 2 was CXL-treated. Please note that the Young’s modulus scale is only the same for a given IOP for each sample.
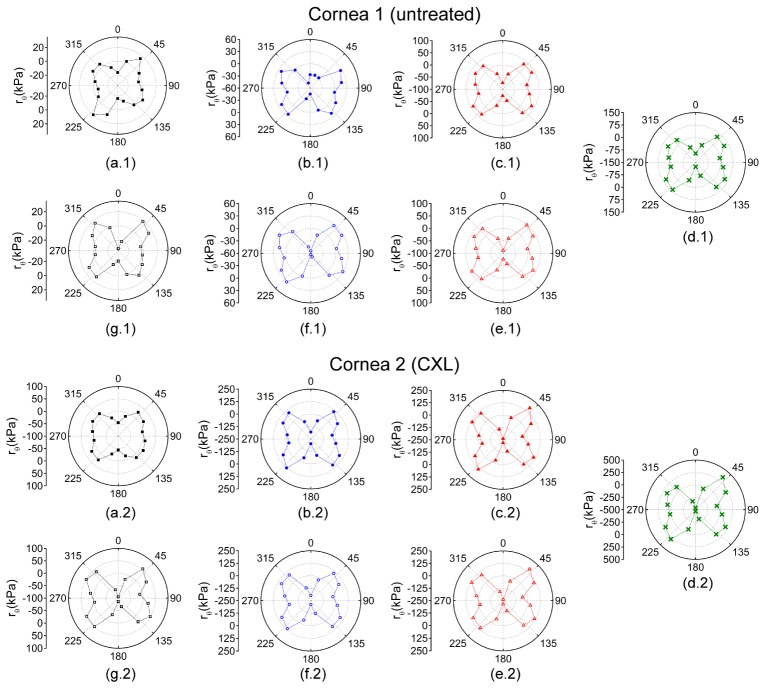
Figure 4 plots rθ for each OCE-measured meridional angle for the pair of untreated fellow corneas while increasing IOP. At lower IOPs, there was a lesser degree of mechanical anisotropy, which is shown by greater rθ values at higher IOPs. CXL increased the mechanical anisotropy at a given IOP as well.
Fig. 4.
Polar maps of rθ for while increasing IOP at (a) 15, (b) 20, (c) 25, and (d) 30 mmHg and while decreasing IOP at (e) 25, (f) 20, and (g) 15 mmHg. Cornea 1 was untreated while cornea 2 was CXL-treated. Please note, the rθ scales are only the same for a given IOP for each sample.
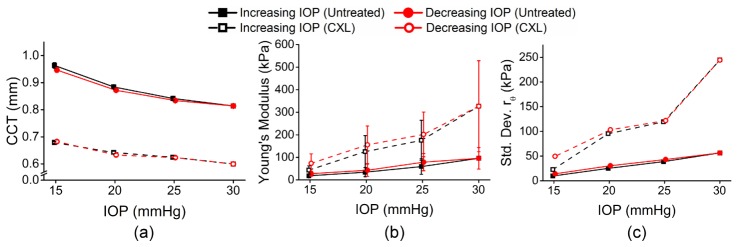
Figure 5(a) shows the average central corneal thickness (CCT) of all meridional angles for a given IOP and IOP change direction for both eyes. The CCT of the corneas was monitored from the OCT structural image and was rescaled to physical dimensions with the refractive index of the cornea as 1.376 [31]. Figure 5(b) shows the mean Young’s modulus for each of the corneas for a given IOP. The rθ maps can provide information about the elastic anisotropy characteristics of the cornea, but a single quantitative metric would provide a rapid assessment of the mechanical anisotropy. Thus, the standard deviation of rθ was used to describe the overall mechanical anisotropy at a given IOP and is plotted in Fig. 5(c). Table 1 is a summary of the data. The 95% confidence intervals are displayed to provide the reader with clear information about the magnitude of IOP and CXL treatment on the Young’s modulus, elastic anisotropy, and their hysteresis while cycling IOP.
Fig. 5.
(a) Mean CCT, (b) mean Young’s modulus, and (c) standard deviation of rθ for all OCE-measured meridional angles of a pair of fellow porcine cornea samples while IOP was increased. The error bars are the standard deviation of the data from all OCE-measured meridional angles for a given IOP and IOP change direction for each cornea.
Table 1. Summary of data from the pair of fellow porcine corneas. The CCT and Young’s moduli are represented as the 95% confidence interval of the respective data from all OCE-measured meridional angles for a given IOP and IOP change direction. The standard deviation of rθ is the standard deviation of rθ from all OCE-measured meridional angles for a given IOP.
| Cornea 1 (Untreated) |
Cornea 2 (CXL-treated) |
||||||
|---|---|---|---|---|---|---|---|
| IOP Direction | IOP (mmHg) |
CCT (µm) | Young’s modulus (kPa) | Standard Deviation of rθ (kPa) | CCT (µm) | Young’s modulus (kPa) | Standard Deviation of rθ (kPa) |
| + | 15 | 956;971 | 14.7;22.2 | 9.8 | 677;682 | 33.5;51.9 | 22.7 |
| 20 | 880;889 | 23.8;43.9 | 25.1 | 638;646 | 87.7;156.2 | 95.3 | |
| 25 | 837;846 | 42.0;74.4 | 38.7 | 621;629 | 127.8;213.5 | 119.3 | |
| 30 | 810;818 | 72.6;117.4 | 56.4 | 594;605 | 228.1;417.9 | 244.5 | |
| - | 25 | 829;838 | 59.8;95.7 | 43.1 | 619;628 | 149.4;244.7 | 121.9 |
| 20 | 867;877 | 29.6;55.3 | 30.6 | 628;638 | 109.9;191.2 | 103.2 | |
| 15 | 940;953 | 22.2;32.9 | 14.2 | 678;688 | 51.2;91.7 | 49.5 | |
Figure 6 plots a summary of the (a) mean Young’s modulus and (b) mean standard deviation of rθ for all four pairs of corneas. The error bars are the inter-sample standard deviations for a given IOP and IOP direction. Table 2 provides a summary of the data for all four pairs of corneas. Similar to Table 1, the 95% confidence intervals are displayed to provide the reader with clear information about the magnitude of the IOP and CXL treatment on the Young’s modulus and elastic anisotropy and their hysteresis.
Fig. 6.
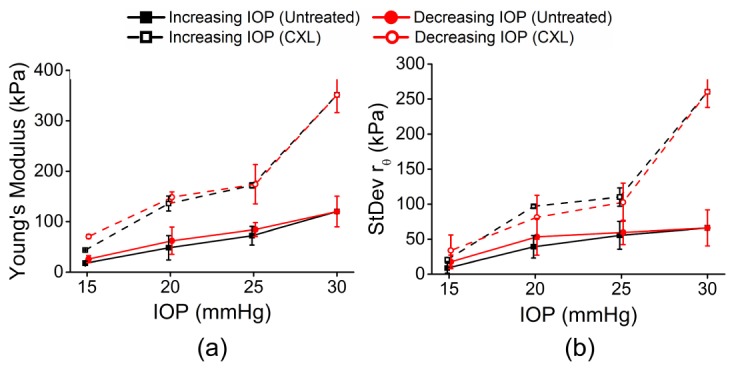
Summary of (a) mean Young’s modulus and (b) mean standard deviation of rθ for 4 pairs of corneas (6 untreated samples and 2 CXL-treated samples). In two fellow pairs of samples, both corneas were untreated. In the other two fellow pairs of samples, one cornea was untreated while the fellow cornea was CXL-treated. The error bars are the inter-sample standard deviations of all samples for a given IOP and treatment condition.
Table 2. Summary of data from all samples (n = 6 untreated and n = 2 CXL-treated corneas). The data is represented as 95% confidence interval of all samples at a given IOP and treatment.
| Untreated Samples n = 6 |
CXL-Treated Samples n = 2 |
||||||
|---|---|---|---|---|---|---|---|
| IOP Direction | IOP (mmHg) |
Young’s modulus (kPa) | Standard Deviation of rθ (kPa) | Young’s modulus (kPa) |
Standard Deviation of rθ (kPa) | ||
| + | 15 | 13.6; 21.5 | 1.1; 16.3 | 42.0; 45.3 | 0; 46.4 | ||
| 20 | 22.7; 73.6 | 22.1; 56.0 | 3.4; 268.6 | 76.5; 117.4 | |||
| 25 | 52.8; 91.6 | 34.5; 76.2 | 124.4; 219.4 | 0; 226.9 | |||
| 30 | 88.2; 152.0 | 39.0; 93.1 | 38.0; 664.7 | 60.5; 459.9 | |||
| - | 25 | 70.0; 98.7 | 41.3; 77.7 | 0; 525.1 | 0; 347.7 | ||
| 20 | 33.7; 90.6 | 25.7; 80.9 | 54.7; 242.2 | 0; 362.1 | |||
| 15 | 17.3; 34.3 | 5.6; 29.5 | 33.9; 107.5 | 0; 233.1 | |||
4. Discussion
We have utilized our noncontact OCE technique to investigate the mechanical anisotropy of the cornea by imaging air-pulse induced elastic waves at incremental meridional angles. Furthermore, the IOP-dependent biomechanical anisotropy and hysteresis were investigated while the IOP was cycled. Our results show that the elastic anisotropy of the cornea becomes much more pronounced as the IOP was increased and that there is a measureable, albeit small, hysteresis.
For further clinical application of this method, the acquisition time will need to be significantly reduced. Here, each M-mode image was ~100 ms in duration and 251 M-mode images were acquired for each meridional angle, resulting in clinically unfeasible imaging times. However, we have characterized the Young’s modulus of an in situ porcine cornea at various IOPs using noncontact OCE at speed of ~1.5 million A-scans per second [38]. Due to the drastically faster A-scan rate, the air-pulse induced elastic wave was directly imaged utilizing successive B-scans, resulting in a total acquisition time of ~30 ms for a single line scan. Apart from OCE, other optical elastography methods may be viable alternatives, such as holographic elastography [39, 40]. Holographic elastography can also dramatically reduce the acquisition time to milliseconds, and similar to the aforementioned ultra-fast OCE technique, would require a single excitation for a measurement and would not exceed the laser exposure limit for the cornea. The two aforementioned optical elastography techniques contrast with the M-B-mode imaging in this work, where each OCE measurement position had to be synchronized with an air-pulse stimulation, and the corneal laser safety limit was exceeded. There have been reports of OCT imaging at A-scan rates beyond 20 MHz [41, 42], which may be able to provide near real-time elastographic assessments when coupled with graphics processing unit accelerated OCE [43]. However, higher speeds come at the cost of reduced sensitivity [44], and therefore, a compromise between speed and sensitivity will need to be determined.
The Young’s modulus obtained from our OCE measurements is less than as measured by other techniques such as mechanical testing [12, 27]. This may be due to the non-linearity of the corneal stress-strain curve [45]. Thus, the large stresses and strains encountered in mechanical testing result in large values of Young’s modulus. Furthermore, assessing which strain corresponds to the OCE measurements is difficult and makes corroborating our OCE-measured Young’s modulus values with mechanical testing difficult. It has been hypothesized that the equivalent IOP during mechanical testing is quite high (up to a few hundred mmHg) [46], and thus, our OCE measurements cannot be directly compared to techniques such as mechanical testing. Our results showed that the overall Young’s modulus of the porcine cornea increased by ~154%, which is similar to the ~180% increase in Young’s modulus at a strain of 0.06 as measured by strip extensiometry [12]. However, SSI has shown an increase in the corneal Young’s modulus between 236% and 760% after CXL [47], inflation testing showed an increase of ~59% in Young’s modulus [48], and ultrasound elastography (USE) showed a ~55% decrease in tangential strain [49]. Our own previous work has shown an increase of ~200% and ~630% as measured by OCE [27, 50], showing that there is a wide variance in the literature of the changes in the biomechanical properties of the porcine cornea after CXL due to various factors such as age, testing conditions, measurement technique, and method for material parameter quantification.
We utilized porcine corneas in this work to demonstrate the capability of our technique to detect and quantify the elastic anisotropy of the porcine cornea. However, X-ray diffraction analysis has shown that the collagen fibril arrangement is species-dependent [51], and studying the biomechanical anisotropic behavior of different species, including humans, is an avenue of our future work.
In this study, the local mechanical anisotropy of the porcine cornea became more apparent at higher IOPs, which has also been recently shown by SSI [6]. This can also be explained by the non-linear corneal stress-strain curve [45]. Higher IOPs correspond to a larger stress and thus, differences in Young’s modulus became more pronounced as the slope of the stress-strain curve (i.e. Young’s modulus) increases. Mechanical testing on corneal strips excised at orthogonal angles showed minimal difference in the corresponding stress-strain curves [52]. However, after increasing the strain rate, the difference between the strip specimens widened, which may indicate that the rate, in addition to the magnitude of the stress, may play an important factor in how the collagen fibers align and react during loading. Nevertheless, our results showed that increasing IOP and CXL increased corneal Young’s modulus and the overall degree of mechanical anisotropy. However, the direction of the anisotropy was unchanged by either IOP or CXL.
The modified rθ [36] was utilized to quantify the elastic anisotropy of the porcine corneas by Eq. (4) to overcome the limitations of the more simplistic anisotropic parameters such fractional anisotropy [37]. Originally, rθ, was developed to assess the quality of rolled steel by calculating the strain of the metal at 0, 45, and 90 degrees [36]. However, this only provides a single value showing the overall performance of the metal by calculating a ratio of the strains of the three measured directions. Consequently, rθ was calculated for each OCE-measured meridional angle to quantify the relative anisotropic Young’s modulus for each direction rather than for the whole sample. The standard deviation of rθ for a given IOP was utilized to obtain a single metric for quantifying the anisotropy and showed a dramatic difference between the untreated and CXL-treated corneas as well as an increase as a function of IOP, which was similar to findings by SSI [6].
In this study, we have not investigated depth-resolved elastic anisotropy. The elastic wave velocities were averaged depth-wise, and therefore the Young’s modulus obtained from the velocity reflected the Young’s modulus over the entire thickness of the cornea. However, application of spectral analysis of the elastic wave propagation (as a function of frequency) or time reversal wavelength tomography can reveal the depth-resolved micro-scale elasticity distribution in the cornea [33] and may be able to elucidate the depth-dependent changes in the elastic anisotropy of the cornea. Moreover, the depth-wise effects of CXL are not uniform as evidenced by various techniques such as Brillouin microscopy [53], USE [49], and OCE [54]. Our future work will involve investigating if there are any anisotropic characteristics of the depth-wise mechanical anisotropy as a function of IOP or after CXL.
The SWE, Eq. (1), was used to quantify Young’s modulus, but there may be inaccuracies due to assumptions about the sample. For example, the SWE assumes the sample has an infinite depth, is homogeneous, is isotropic in half-space, and has no viscosity, which is not strictly true of the cornea [54–56]. As seen in Fig. 5(a), the thickness of the cornea decreased as IOP was increased and also after CXL. The change in thickness as IOP increases is intuitive as a greater pressure will compress the cornea, decreasing its thickness. The traditional “Dresden” CXL protocol utilizes dextran to dehydrate the cornea to aid the diffusion of riboflavin into the corneal tissue. This dehydration causes the CCT to decrease, as seen in Fig. 5(a), and changes in corneal tissue due to dehydration (or hyper-hydration leading to swelling) are noticeable [57–59]. Additionally, we have shown that changes in thickness when keeping all other parameters constant can also influence the elastic wave velocity [35]. The corneas were partially swollen due to storage and hydration with a saline solution [60], and alternative riboflavin solutions (e.g. hydroxypropyl methylcellulose based solutions) can stabilize corneal thickness during CXL treatments [61]. We are currently investigating the use of such solutions to minimize effects of thickness [35] on biomechanical characterization of the cornea. On the other hand, a mechanical model that can incorporate the effects of thickness would improve the accuracy of quantifying biomechanical properties [35, 62]. Nevertheless, the SWE can be used to obtain a reasonable first-order estimate of Young’s modulus [63].
Only the elastic anisotropy was investigated in this work, which is not fully indicative of the biomechanical properties of the cornea. We have recently developed a modified Rayleigh Lamb Frequency Equation (mRLFE) that can provide the Young’s modulus as well as viscosity of the cornea by utilizing the elastic wave dispersion characteristics and appropriate corneal boundary conditions [62, 64]. The viscosity may provide an insight into why the hysteresis was insignificant in the 15 to 30 mmHg IOP range. However, the mRLFE assumes the sample is isotropic, which the cornea clearly is not. Development of a more robust mechanical model that can incorporate the curvature of the cornea, depth-wise heterogeneity, and viscoelastic anisotropy is a direction of our future work.
In this work, only the elastic anisotropy close to the apex of the cornea was assessed. Generally, the entire central region, which is the location of the air-pulse excitation, is locally displaced concurrently, resulting in wave velocity quantification artifacts because there is no wave propagation. Hence, the central ~500 μm diameter region was excluded during quantification. Additionally, the collagen fibril orientation is distinctly different at the periphery of the cornea as compared to the apex [1], which changes the orientation of the mechanical anisotropy as well [6]. Future investigations will assess the elastic anisotropy of the cornea near the limbus, as well as assessing the mechanical anisotropy and hysteresis of other ocular tissues such as the sclera.
5. Conclusion
This work has presented a noncontact method of evaluating the elastic anisotropy of the cornea at various IOPs. The results show that the anisotropy was readily apparent even at physiological IOPs but became significantly more evident as IOP was increased. Moreover, CXL increased the anisotropy but did not alter the orientation. For example, the standard deviation of rθ of the untreated cornea increased from ~9 at 15 mmHg IOP to ~66 at 30 mmHg IOP, but went from ~21 at 15 mmHg IOP to ~260 at 30 mmHg after CXL. Because of the noncontact excitation and minimal force, the presented OCE technique may be useful for evaluating the integrity of corneal tissue in vivo, as well as evaluating the efficacy of therapeutic interventions such as CXL, particularly when coupled with recent advances in ultra-fast OCE techniques and more robust mechanical models.
Acknowledgements
The authors would like to thanks Ms. Tina Kazemi from the Department of Biomedical Engineering at the University of Houston for her help with data processing.
Appendix A.
A.1 Fellow untreated samples
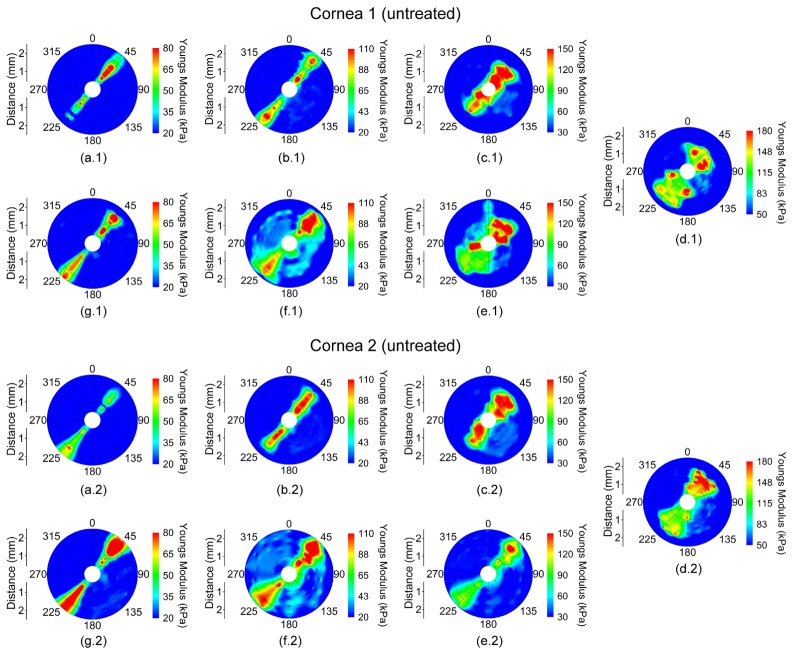
The spatially mapped Young’s modulus for a pair of untreated corneal samples is presented in Fig. 7
Fig. 7.
Young’s modulus of a pair of untreated fellow corneas while increasing IOP at (a) 15, (b) 20, (c) 25, and (d) 30 mmHg and while decreasing IOP at (e) 25, (f) 20, and (g) 15 mmHg. The Young’s modulus scales are the same for a given IOP for both samples.
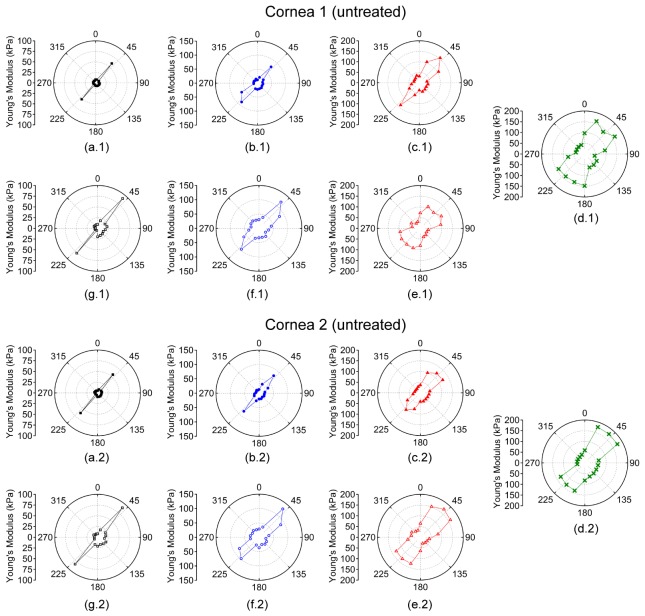
. The Young’s modulus (i.e. color) scales are the same for a given IOP for both directions of IOP change and for both eyes for easy comparison the Young’s modulus and elastic anisotropy between the fellow corneas. The meridional angle-wise polar plots of the corneal Young’s modulus are shown in Fig. 8
Fig. 8.
Polar plots of the meridional angle-wise average Young’s modulus while increasing IOP at (a) 15, (b) 20, (c) 25, and (d) 30 mmHg and while decreasing IOP at (e) 25, (f) 20, and (g) 15 mmHg. Both corneas were untreated, and the Young modulus scales are the same for a given IOP for both samples.
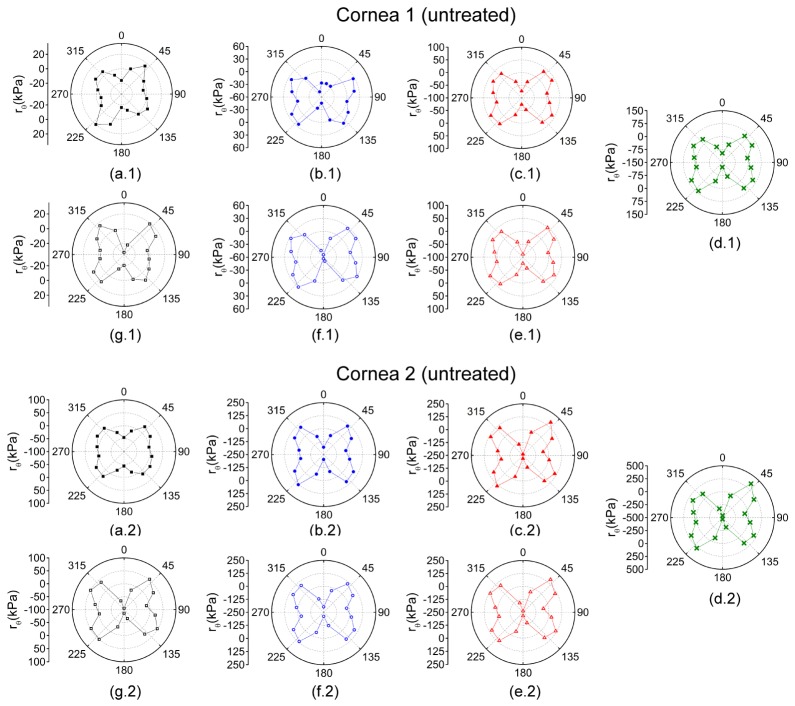
. The rθ values for each OCE-measured meridional angle and for the pair of untreated fellow eyes angle while cycling IOP are plotted in Fig. 9
Fig. 9.
The rθ values for a pair of untreated fellow corneas for each OCE-measured meridional angle in the cornea calculated by Eq. (5) while increasing IOP at (a) 15, (b) 20, (c) 25, and (d) 30 mmHg and while decreasing IOP at (e) 25, (f) 20, and (g) 15 mmHg. Please note that the rθ scales are the same only for a given IOP.
.
Fig. 10.
Summary of the first pair of untreated fellow porcine corneal samples. (a) The meridional angle-wise average CCT of each cornea, (b) the average Young’s modulus of both corneas, and (d) the average standard deviation of rθ of both corneas while cycling IOP.
is a summary of the first pair of untreated fellow eyes by plotting (a) the CCT, averaged over all meridional angles for a given IOP for each eye, (b) the mean Young’s modulus of both eyes for a given IOP, and (c) mean standard deviation of rθ of both eyes while cycling IOP.
Table 3. CCT, Young’s modulus, and standard deviation of rθ for the first pair of untreated fellow corneas. The data is presented as the 95% confidence intervals of the data from all meridional angles for a given IOP and IOP change direction for each sample.
| Cornea 1 (Untreated) |
Cornea 2 (Untreated) |
||||||
|---|---|---|---|---|---|---|---|
| IOP Direction | IOP (mmHg) |
CCT (µm) | Young’s modulus (kPa) | Standard Deviation of rθ (kPa) | CCT (µm) | Young’s modulus (kPa) | Standard Deviation of rθ (kPa) |
| + | 15 | 995; 1005 | 4.5; 20.3 | 16.8 | 1061; 1068 | 5.0; 21.5 | 17.5 |
| 20 | 985; 993 | 16.4; 39.2 | 26.9 | 1052; 1057 | 15.7; 36.7 | 23.6 | |
| 25 | 953; 958 | 38.3; 77.9 | 45.9 | 1035; 1041 | 40.1; 73.2 | 36.1 | |
| 30 | 932; 940 | 72.3; 117.5 | 42.0 | 1010; 1015 | 61.5; 113.4 | 54.4 | |
| - | 25 | 948; 952 | 54.7; 83.4 | 44.0 | 1025; 1032 | 55.4; 105.5 | 52.2 |
| 20 | 970; 979 | 33.4; 59.5 | 31.2 | 1045; 1050 | 30.3; 60.5 | 36.7 | |
| 15 | 984; 987 | 9.1; 32.5 | 23.8 | 1057; 1060 | 10.7; 34.2 | 25.6 | |
Presents the 95% confidence intervals for CCT and Young’s modulus over all meridional angles for a given IOP and IOP direction. Because there is only a single rθ value for each sample at a given IOP and IOP direction, no interval is presented. In order to monitor the changes in CCT during the OCE measurements, the CCTs were normalized to the maximum CCT of all meridional angles for a given IOP, IOP direction, and for each sample. The mean normalized CCTs showed that there was a negligible change (<2%) in CCT during the OCE measurements for a given IOP and IOP direction.
Fig. 11.
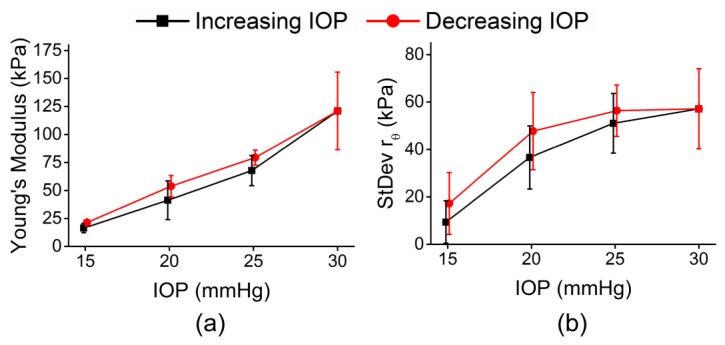
Summary of all 4 untreated eyes from 2 pairs of fellow untreated porcine corneal samples. (a) The average Young’s modulus and (b) the average standard deviation of rθ of all 4 eyes while IOP was cycled.
plots the average Young’s modulus and standard deviation of rθ for four corneas (two pairs of untreated fellow samples).
As seen in Table 3, the confidence intervals in Young’s modulus and elastic anisotropy were overlapped between fellow eyes in both pairs, thus there was no noticeable difference in tissue Young’s modulus or mechanical anisotropy between fellow corneas.
Funding
This work was funded in part by the U.S. NIH grants 2R01EY022362, 1R01HL120140, and U54HG006348 and DOD CDMRP grant PR150338.
References and links
- 1.Meek K. M., Boote C., “The use of X-ray scattering techniques to quantify the orientation and distribution of collagen in the corneal stroma,” Prog. Retin. Eye Res. 28(5), 369–392 (2009). 10.1016/j.preteyeres.2009.06.005 [DOI] [PubMed] [Google Scholar]
- 2.Nguyen T. D., Boyce B. L., “An inverse finite element method for determining the anisotropic properties of the cornea,” Biomech. Model. Mechanobiol. 10(3), 323–337 (2011). 10.1007/s10237-010-0237-3 [DOI] [PubMed] [Google Scholar]
- 3.Elsheikh A., Brown M., Alhasso D., Rama P., Campanelli M., Garway-Heath D., “Experimental assessment of corneal anisotropy,” J. Refract. Surg. 24(2), 178–187 (2008). [DOI] [PubMed] [Google Scholar]
- 4.Pinsky P. M., van der Heide D., Chernyak D., “Computational modeling of mechanical anisotropy in the cornea and sclera,” J. Cataract Refract. Surg. 31(1), 136–145 (2005). 10.1016/j.jcrs.2004.10.048 [DOI] [PubMed] [Google Scholar]
- 5.Li J., Han Z., Singh M., Twa M. D., Larin K. V., “Differentiating untreated and cross-linked porcine corneas of the same measured stiffness with optical coherence elastography,” J. Biomed. Opt. 19(11), 110502 (2014). 10.1117/1.JBO.19.11.110502 [DOI] [PMC free article] [PubMed] [Google Scholar]
- 6.Nguyen T. M., Aubry J. F., Fink M., Bercoff J., Tanter M., “In vivo evidence of porcine cornea anisotropy using supersonic shear wave imaging,” Invest. Ophthalmol. Vis. Sci. 55(11), 7545–7552 (2014). 10.1167/iovs.14-15127 [DOI] [PubMed] [Google Scholar]
- 7.Singh M., Li J., Han Z., Wu C., Aglyamov S. R., Twa M. D., Larin K. V., “Investigating Elastic Anisotropy of the Porcine Cornea as a Function of Intraocular Pressure With Optical Coherence Elastography,” J. Refract. Surg. 32(8), 562–567 (2016). 10.3928/1081597X-20160520-01 [DOI] [PMC free article] [PubMed] [Google Scholar]
- 8.Li C., Guan G., Huang Z., Johnstone M., Wang R. K., “Noncontact all-optical measurement of corneal elasticity,” Opt. Lett. 37(10), 1625–1627 (2012). 10.1364/OL.37.001625 [DOI] [PubMed] [Google Scholar]
- 9.Randleman J. B., Khandelwal S. S., Hafezi F., “Corneal cross-linking,” Surv. Ophthalmol. 60(6), 509–523 (2015). 10.1016/j.survophthal.2015.04.002 [DOI] [PubMed] [Google Scholar]
- 10.Wollensak G., Spoerl E., Seiler T., “Riboflavin/ultraviolet-a-induced collagen crosslinking for the treatment of keratoconus,” Am. J. Ophthalmol. 135(5), 620–627 (2003). 10.1016/S0002-9394(02)02220-1 [DOI] [PubMed] [Google Scholar]
- 11.Tan H. Y., Chang Y. L., Lo W., Hsueh C. M., Chen W. L., Ghazaryan A. A., Hu P. S., Young T. H., Chen S. J., Dong C. Y., “Characterizing the morphologic changes in collagen crosslinked-treated corneas by Fourier transform-second harmonic generation imaging,” J. Cataract Refract. Surg. 39(5), 779–788 (2013). 10.1016/j.jcrs.2012.11.036 [DOI] [PubMed] [Google Scholar]
- 12.Wollensak G., Spoerl E., Seiler T., “Stress-strain measurements of human and porcine corneas after riboflavin-ultraviolet-A-induced cross-linking,” J. Cataract Refract. Surg. 29(9), 1780–1785 (2003). 10.1016/S0886-3350(03)00407-3 [DOI] [PubMed] [Google Scholar]
- 13.Tian L., Ko M. W., Wang L. K., Zhang J. Y., Li T. J., Huang Y. F., Zheng Y. P., “Assessment of ocular biomechanics using dynamic ultra high-speed Scheimpflug imaging in keratoconic and normal eyes,” J. Refract. Surg. 30(11), 785–791 (2014). 10.3928/1081597X-20140930-01 [DOI] [PubMed] [Google Scholar]
- 14.Kotecha A., Russell R. A., Sinapis A., Pourjavan S., Sinapis D., Garway-Heath D. F., “Biomechanical parameters of the cornea measured with the Ocular Response Analyzer in normal eyes,” BMC Ophthalmol. 14(1), 11 (2014). 10.1186/1471-2415-14-11 [DOI] [PMC free article] [PubMed] [Google Scholar]
- 15.Bak-Nielsen S., Pedersen I. B., Ivarsen A., Hjortdal J., “Dynamic Scheimpflug-based assessment of keratoconus and the effects of corneal cross-linking,” J. Refract. Surg. 30(6), 408–414 (2014). 10.3928/1081597X-20140513-02 [DOI] [PubMed] [Google Scholar]
- 16.Gkika M., Labiris G., Giarmoukakis A., Koutsogianni A., Kozobolis V., “Evaluation of corneal hysteresis and corneal resistance factor after corneal cross-linking for keratoconus,” Graefes Arch. Clin. Exp. Ophthalmol. 250(4), 565–573 (2012). 10.1007/s00417-011-1897-0 [DOI] [PubMed] [Google Scholar]
- 17.Greenstein S. A., Fry K. L., Hersh P. S., “In vivo biomechanical changes after corneal collagen cross-linking for keratoconus and corneal ectasia: 1-year analysis of a randomized, controlled, clinical trial,” Cornea 31(1), 21–25 (2012). 10.1097/ICO.0b013e31821eea66 [DOI] [PubMed] [Google Scholar]
- 18.Goldich Y., Barkana Y., Morad Y., Hartstein M., Avni I., Zadok D., “Can we measure corneal biomechanical changes after collagen cross-linking in eyes with keratoconus?--a pilot study,” Cornea 28(5), 498–502 (2009). 10.1097/ICO.0b013e318190734d [DOI] [PubMed] [Google Scholar]
- 19.Kim M., Besner S., Ramier A., Kwok S. J. J., An J., Scarcelli G., Yun S. H., “Shear Brillouin light scattering microscope,” Opt. Express 24(1), 319–328 (2016). 10.1364/OE.24.000319 [DOI] [PMC free article] [PubMed] [Google Scholar]
- 20.Huang D., Swanson E. A., Lin C. P., Schuman J. S., Stinson W. G., Chang W., Hee M. R., Flotte T., Gregory K., Puliafito C. A., et, “Optical coherence tomography,” Science 254(5035), 1178–1181 (1991). 10.1126/science.1957169 [DOI] [PMC free article] [PubMed] [Google Scholar]
- 21.Schmitt J., “OCT elastography: imaging microscopic deformation and strain of tissue,” Opt. Express 3(6), 199–211 (1998). 10.1364/OE.3.000199 [DOI] [PubMed] [Google Scholar]
- 22.Wang S., Larin K. V., “Optical coherence elastography for tissue characterization: a review,” J. Biophotonics 8(4), 279–302 (2015). 10.1002/jbio.201400108 [DOI] [PMC free article] [PubMed] [Google Scholar]
- 23.Sticker M., Hitzenberger C. K., Leitgeb R., Fercher A. F., “Quantitative differential phase measurement and imaging in transparent and turbid media by optical coherence tomography,” Opt. Lett. 26(8), 518–520 (2001). 10.1364/OL.26.000518 [DOI] [PubMed] [Google Scholar]
- 24.Manapuram R. K., Manne V. G. R., Larin K. V., “Phase-sensitive swept source optical coherence tomography for imaging and quantifying of microbubbles in clear and scattering media,” J. Appl. Phys. 105(10), 102040 (2009). 10.1063/1.3116614 [DOI] [Google Scholar]
- 25.Wang S., Larin K. V., Li J. S., Vantipalli S., Manapuram R. K., Aglyamov S., Emelianov S., Twa M. D., “A focused air-pulse system for optical-coherence-tomography-based measurements of tissue elasticity,” Laser Phys. Lett. 10(7), 075605 (2013). 10.1088/1612-2011/10/7/075605 [DOI] [PMC free article] [PubMed] [Google Scholar]
- 26.Wang S., Larin K. V., “Shear wave imaging optical coherence tomography (SWI-OCT) for ocular tissue biomechanics,” Opt. Lett. 39(1), 41–44 (2014). 10.1364/OL.39.000041 [DOI] [PMC free article] [PubMed] [Google Scholar]
- 27.Twa M. D., Li J., Vantipalli S., Singh M., Aglyamov S., Emelianov S., Larin K. V., “Spatial characterization of corneal biomechanical properties with optical coherence elastography after UV cross-linking,” Biomed. Opt. Express 5(5), 1419–1427 (2014). 10.1364/BOE.5.001419 [DOI] [PMC free article] [PubMed] [Google Scholar]
- 28.Wollensak G., Iomdina E., Dittert D. D., Salamatina O., Stoltenburg G., “Cross-linking of scleral collagen in the rabbit using riboflavin and UVA,” Acta Ophthalmol. Scand. 83(4), 477–482 (2005). 10.1111/j.1600-0420.2005.00447.x [DOI] [PubMed] [Google Scholar]
- 29.Manapuram R. K., Manne V. G. R., Larin K. V., “Development of phase-stabilized swept-source OCT for the ultrasensitive quantification of microbubbles,” Laser Phys. 18(9), 1080–1086 (2008). 10.1134/S1054660X08090144 [DOI] [Google Scholar]
- 30.Song S., Huang Z., Wang R. K., “Tracking mechanical wave propagation within tissue using phase-sensitive optical coherence tomography: motion artifact and its compensation,” J. Biomed. Opt. 18(12), 121505 (2013). 10.1117/1.JBO.18.12.121505 [DOI] [PubMed] [Google Scholar]
- 31.Mandell R. B., “Corneal power correction factor for photorefractive keratectomy,” J. Refract. Corneal Surg. 10(2), 125–128 (1994). [PubMed] [Google Scholar]
- 32.Wang S., Lopez A. L., 3rd, Morikawa Y., Tao G., Li J., Larina I. V., Martin J. F., Larin K. V., “Noncontact quantitative biomechanical characterization of cardiac muscle using shear wave imaging optical coherence tomography,” Biomed. Opt. Express 5(7), 1980–1992 (2014). 10.1364/BOE.5.001980 [DOI] [PMC free article] [PubMed] [Google Scholar]
- 33.Wang S., Larin K. V., “Noncontact depth-resolved micro-scale optical coherence elastography of the cornea,” Biomed. Opt. Express 5(11), 3807–3821 (2014). 10.1364/BOE.5.003807 [DOI] [PMC free article] [PubMed] [Google Scholar]
- 34.Kampmeier J., Radt B., Birngruber R., Brinkmann R., “Thermal and biomechanical parameters of porcine cornea,” Cornea 19(3), 355–363 (2000). 10.1097/00003226-200005000-00020 [DOI] [PubMed] [Google Scholar]
- 35.Han Z., Li J., Singh M., Aglyamov S. R., Wu C., Liu C. H., Larin K. V., “Analysis of the effects of curvature and thickness on elastic wave velocity in cornea-like structures by finite element modeling and optical coherence elastography,” Appl. Phys. Lett. 106(23), 233702 (2015). 10.1063/1.4922728 [DOI] [PMC free article] [PubMed] [Google Scholar]
- 36.Lankford W. T., Snyder S. C., Bauscher J. A., “New Criteria for Predicting the Press Performance of Deep Drawing Sheets,” Trans. Am. Soc. Metal 42, 1197–1232 (1950). [Google Scholar]
- 37.Couade M., Pernot M., Messas E., Bel A., Ba M., Hagege A., Fink M., Tanter M., “In vivo quantitative mapping of myocardial stiffening and transmural anisotropy during the cardiac cycle,” IEEE Trans. Med. Imaging 30(2), 295–305 (2011). 10.1109/TMI.2010.2076829 [DOI] [PubMed] [Google Scholar]
- 38.Singh M., Wu C., Liu C. H., Li J., Schill A., Nair A., Larin K. V., “Phase-sensitive optical coherence elastography at 1.5 million A-Lines per second,” Opt. Lett. 40(11), 2588–2591 (2015). 10.1364/OL.40.002588 [DOI] [PMC free article] [PubMed] [Google Scholar]
- 39.Liu C. H., Schill A., Wu C., Singh M., Larin K. V., “Non-contact single shot elastography using line field low coherence holography,” Biomed. Opt. Express 7(8), 3021–3031 (2016). 10.1364/BOE.7.003021 [DOI] [PMC free article] [PubMed] [Google Scholar]
- 40.Li S., Mohan K. D., Sanders W. W., Oldenburg A. L., “Toward soft-tissue elastography using digital holography to monitor surface acoustic waves,” J. Biomed. Opt. 16(11), 116005 (2011). 10.1117/1.3646211 [DOI] [PubMed] [Google Scholar]
- 41.Wei X., Lau A. K., Xu Y., Tsia K. K., Wong K. K., “28 MHz swept source at 1.0 μm for ultrafast quantitative phase imaging,” Biomed. Opt. Express 6(10), 3855–3864 (2015). 10.1364/BOE.6.003855 [DOI] [PMC free article] [PubMed] [Google Scholar]
- 42.Wieser W., Biedermann B. R., Klein T., Eigenwillig C. M., Huber R., “Multi-megahertz OCT: High quality 3D imaging at 20 million A-scans and 4.5 GVoxels per second,” Opt. Express 18(14), 14685–14704 (2010). 10.1364/OE.18.014685 [DOI] [PubMed] [Google Scholar]
- 43.Kirk R. W., Kennedy B. F., Sampson D. D., McLaughlin R. A., “Near Video-Rate Optical Coherence Elastography by Acceleration With a Graphics Processing Unit,” J. Lightwave Technol. 33(16), 3481–3485 (2015). 10.1109/JLT.2015.2413402 [DOI] [Google Scholar]
- 44.Pfeiffer T., Wieser W., Klein T., Petermann M., Kolb J.-P., Eibl M., Huber R., “Flexible A-scan rate MHz OCT: computational downscaling by coherent averaging,” in SPIE BiOS, (International Society for Optics and Photonics, 2016), 96970S–96970S–96975. [Google Scholar]
- 45.Elsheikh A., Alhasso D., Rama P., “Biomechanical properties of human and porcine corneas,” Exp. Eye Res. 86(5), 783–790 (2008). 10.1016/j.exer.2008.02.006 [DOI] [PubMed] [Google Scholar]
- 46.Hoeltzel D. A., Altman P., Buzard K., Choe K., “Strip extensiometry for comparison of the mechanical response of bovine, rabbit, and human corneas,” J. Biomech. Eng. 114(2), 202–215 (1992). 10.1115/1.2891373 [DOI] [PubMed] [Google Scholar]
- 47.Nguyen T. M., Aubry J. F., Touboul D., Fink M., Gennisson J. L., Bercoff J., Tanter M., “Monitoring of cornea elastic properties changes during UV-A/riboflavin-induced corneal collagen cross-linking using supersonic shear wave imaging: a pilot study,” Invest. Ophthalmol. Vis. Sci. 53(9), 5948–5954 (2012). 10.1167/iovs.11-9142 [DOI] [PubMed] [Google Scholar]
- 48.Kling S., Remon L., Pérez-Escudero A., Merayo-Lloves J., Marcos S., “Corneal biomechanical changes after collagen cross-linking from porcine eye inflation experiments,” Invest. Ophthalmol. Vis. Sci. 51(8), 3961–3968 (2010). 10.1167/iovs.09-4536 [DOI] [PubMed] [Google Scholar]
- 49.Palko J. R., Tang J., Cruz Perez B., Pan X., Liu J., “Spatially heterogeneous corneal mechanical responses before and after riboflavin-ultraviolet-A crosslinking,” J. Cataract Refract. Surg. 40(6), 1021–1031 (2014). 10.1016/j.jcrs.2013.09.022 [DOI] [PMC free article] [PubMed] [Google Scholar]
- 50.Singh M., Li J., Vantipalli S., Wang S., Han Z., Nair A., Aglyamov S. R., Twa M. D., Larin K. V., “Noncontact Elastic Wave Imaging Optical Coherence Elastography for Evaluating Changes in Corneal Elasticity Due to Crosslinking,” IEEE J. Sel. Top. Quantum Electron. 22(3), 1–11 (2016). 10.1109/JQE.2016.2585338 [DOI] [PMC free article] [PubMed] [Google Scholar]
- 51.Hayes S., Boote C., Lewis J., Sheppard J., Abahussin M., Quantock A. J., Purslow C., Votruba M., Meek K. M., “Comparative study of fibrillar collagen arrangement in the corneas of primates and other mammals,” Anat. Rec. (Hoboken) 290(12), 1542–1550 (2007). 10.1002/ar.20613 [DOI] [PubMed] [Google Scholar]
- 52.Elsheikh A., Alhasso D., “Mechanical anisotropy of porcine cornea and correlation with stromal microstructure,” Exp. Eye Res. 88(6), 1084–1091 (2009). 10.1016/j.exer.2009.01.010 [DOI] [PubMed] [Google Scholar]
- 53.Scarcelli G., Kling S., Quijano E., Pineda R., Marcos S., Yun S. H., “Brillouin microscopy of collagen crosslinking: noncontact depth-dependent analysis of corneal elastic modulus,” Invest. Ophthalmol. Vis. Sci. 54(2), 1418–1425 (2013). 10.1167/iovs.12-11387 [DOI] [PMC free article] [PubMed] [Google Scholar]
- 54.Singh M., Li J., Han Z., Vantipalli S., Liu C. H., Wu C., Raghunathan R., Aglyamov S. R., Twa M. D., Larin K. V., “Evaluating the Effects of Riboflavin/UV-A and Rose-Bengal/Green Light Cross-Linking of the Rabbit Cornea by Noncontact Optical Coherence Elastography,” Invest. Ophthalmol. Vis. Sci. 57(9), OCT112 (2016). 10.1167/iovs.15-18888 [DOI] [PMC free article] [PubMed] [Google Scholar]
- 55.Doyle J. F., Wave Propagation in Structures: Spectral Analysis Using Fast Discrete Fourier Transforms (Springer, New York, 1997). [Google Scholar]
- 56.Han Z., Li J., Singh M., Wu C., Liu C. H., Wang S., Idugboe R., Raghunathan R., Sudheendran N., Aglyamov S. R., Twa M. D., Larin K. V., “Quantitative methods for reconstructing tissue biomechanical properties in optical coherence elastography: a comparison study,” Phys. Med. Biol. 60(9), 3531–3547 (2015). 10.1088/0031-9155/60/9/3531 [DOI] [PMC free article] [PubMed] [Google Scholar]
- 57.Twa M. D., Vantipalli S., Singh M., Li J., Larin K. V., “Influence of corneal hydration on optical coherence elastography,” in SPIE BiOS, (International Society for Optics and Photonics, 2016), 96930V–96930V–96938. [Google Scholar]
- 58.Dias J., Ziebarth N. M., “Impact of Hydration Media on Ex Vivo Corneal Elasticity Measurements,” Eye Contact Lens 41(5), 281–286 (2015). 10.1097/ICL.0000000000000119 [DOI] [PMC free article] [PubMed] [Google Scholar]
- 59.Hatami-Marbini H., Rahimi A., “Interrelation of Hydration, Collagen Cross-Linking Treatment, and Biomechanical Properties of the Cornea,” Curr. Eye Res. 41(5), 616–622 (2016). [DOI] [PubMed] [Google Scholar]
- 60.Kling S., Marcos S., “Effect of hydration state and storage media on corneal biomechanical response from in vitro inflation tests,” J. Refract. Surg. 29(7), 490–497 (2013). 10.3928/1081597X-20130617-08 [DOI] [PubMed] [Google Scholar]
- 61.Vetter J. M., Brueckner S., Tubic-Grozdanis M., Vossmerbäumer U., Pfeiffer N., Kurz S., “Modulation of central corneal thickness by various riboflavin eyedrop compositions in porcine corneas,” J. Cataract Refract. Surg. 38(3), 525–532 (2012). 10.1016/j.jcrs.2011.09.045 [DOI] [PubMed] [Google Scholar]
- 62.Han Z., Aglyamov S. R., Li J., Singh M., Wang S., Vantipalli S., Wu C., Liu C. H., Twa M. D., Larin K. V., “Quantitative assessment of corneal viscoelasticity using optical coherence elastography and a modified Rayleigh-Lamb equation,” J. Biomed. Opt. 20(2), 020501 (2015). 10.1117/1.JBO.20.2.020501 [DOI] [PMC free article] [PubMed] [Google Scholar]
- 63.Zhang X., Yin Y., Guo Y., Fan N., Lin H., Liu F., Diao X., Dong C., Chen X., Wang T., Chen S., “Measurement of quantitative viscoelasticity of bovine corneas based on lamb wave dispersion properties,” Ultrasound Med. Biol. 41(5), 1461–1472 (2015). 10.1016/j.ultrasmedbio.2014.12.017 [DOI] [PubMed] [Google Scholar]
- 64.Han Z., Li J., Singh M., Wu C., Liu C. H., Raghunathan R., Aglyamov S. R., Vantipalli S., Twa M. D., Larin K. V., “Optical coherence elastography assessment of corneal viscoelasticity with a modified Rayleigh-Lamb wave model,” J. Mech. Behav. Biomed. Mater. 66, 87–94 (2016). 10.1016/j.jmbbm.2016.11.004 [DOI] [PMC free article] [PubMed] [Google Scholar]


