Abstract
The choriocapillaris plays an important role in supporting the metabolic demands of the retina. Studies of the choriocapillaris in disease states with optical coherence tomography angiography (OCTA) have proven insightful. However, image artifacts complicate the identification and quantification of the choriocapillaris in degenerative diseases such as choroideremia. Here, we demonstrate a supervised machine learning approach to detect intact choriocapillaris based on training with results from an expert grader. We trained a random forest classifier to evaluate en face structural OCT and OCTA information along with spatial image features. Evaluation of the trained classifier using previously unseen data showed good agreement with manual grading.
OCIS codes: (110.4500) Optical coherence tomography, (170.3880) Medical and biological imaging, (100.0100) Image processing, (170.4470) Ophthalmology
1. Introduction
The retinal pigment epithelium (RPE) and choroidal vascular network in the eye are responsible for supporting the metabolic demands of the photoreceptors, which convert light to neural signals. Loss of these structures in degenerative diseases leads to vision loss. To better understand the pathophysiology of retinal degeneration, we previously used a multimodal imaging approach to assess the integrity of photoreceptors, RPE, and choriocapillaris in cases of choroideremia [1], a rare hereditary chorioretinal disease characterized by poor night vision and progressive loss of peripheral vision. Optical coherence tomography (OCT) and its functional extension OCT angiography (OCTA) were two of the main tools. OCT is an interferometric imaging technique that is analogous to ultrasound. It uses backscattered light to create depth-resolved reflectance profiles of the structure of interest. OCTA identifies vasculature by detecting the blood flow-induced change in the OCT reflectance signal over time. When assessing the choriocapillaris using OCTA, we found that shadowing and projection artifacts [2, 3] made it challenging to identify and quantify intact choriocapillaris.
Shadowing and projection artifacts are related, and the interplay between the two complicates the interpretation of choroidal angiograms derived from OCTA. Because red blood cells are highly scattering, flowing blood in vessels reduces light penetration deeper into the tissue and casts time-varying shadows which are also picked up by the OCTA algorithm as flow signal. This means that vessels in superficial layers project deeper and thus may also be seen in deeper layers. However, if shadowing reduces the OCT reflectance signal below the minimum threshold set by the OCTA algorithm to reduce noise, no flow signal will be detected. Furthermore, because of projection, larger choroidal vessels beneath the choriocapillaris are not observed when there is intact choriocapillaris.
Because of these artifacts, manual grading of OCTA has sometimes been necessary [4–6]. Here, we explored using supervised machine learning to leverage manual grading in development of a more automated approach to assessing intact choriocapillaris. We developed a random forest classifier [7] which was trained to evaluate en face structural OCT and OCTA information along with spatial information derived from standard deviation and Gabor directional filters [8, 9]. We then evaluated the trained classifier using a different group of scans.
2. Methods
2.1 Optical coherence tomography angiography
Study participants with a clinical diagnosis of choroideremia were recruited at the Casey Eye Institute. The research protocols were approved by the Institutional Review Board/Ethics Committee at the Oregon Health & Science University and carried out in accordance with the tenets of the Declaration of Helsinki. Written informed consent was obtained from all participants or their legal guardians.
Each participant received OCTA scans on a 70 kHz spectral domain OCT system (RTVue-XR Avanti, Optovue, Fremont, CA). The angiography scan protocol included two raster scans, each of which was comprised of two repeated cross-sectional B-scans at 304 locations covering a 6 × 6 mm area. Each B-scan contained 304 A-scans. The fast scanning directions for the two raster scans were orthogonal. To detect flow, the previously described split-spectrum amplitude-decorrelation angiography (SSADA) algorithm was implemented [10, 11]. Finally, the two raster scans were registered and merged to correct for saccadic motion [12].
Custom software written in Matlab (v2014a, MathWorks, Natick, MA) was used to segment the inner limiting membrane (ILM), outer boundary of the outer plexiform layer (OPL), and Bruch’s membrane (BM) [13, 14]. An expert grader reviewed and corrected any segmentation errors. The inner retinal slab was defined as between ILM and the outer boundary of OPL. The choroidal slab was everything below BM. The en face inner retinal and choroidal angiograms were then generated as the maximum flow projection between the inner retinal and choroidal slabs, respectively. We also generated two en face structural OCT images to aid the classifier. These were the mean reflectance projection between ILM and BM and the reflectance values of the voxel projected for the choroidal angiogram. All images were smoothed with a Gaussian filter with a diameter of 5 pixels (100 µm) and a standard deviation of 0.75 to reduce noise.
2.2 Manual grading
A trained grader used the freehand area selection tool in ImageJ to trace the region of intact choriocapillaris on the choroidal angiogram. This area was determined by the absence of deep choroidal vessels and corresponding presence of flow immediately beneath the RPE on cross-sectional OCTA. The selected regions of intact choriocapillaris were then converted into a binary image.
2.3 Features for evaluation
The two en face structural OCT images along with the inner retinal and choroidal angiograms were four of the features for the random forest classifier to evaluate. The inner retinal angiogram was included to give the classifier a reference for potential projection artifacts. The en face structural OCT images were included to account for reflectance variation and shadowing from, for example, opacities in the ocular media [15].
Eight additional features were derived from the choroidal angiogram. We applied standard deviation and directional Gabor filters to the choroidal angiogram to better highlight the dense and nearly confluent appearance of intact choriocapillaris. The standard deviation filter calculates the standard deviation of the values within the specified filter size. The Gabor filter highlights objects in the image which are oriented towards a specific direction by convolving the image with a Gaussian kernel modulated by an oriented, complex sinusoid [8,9]. Furthermore, we applied these filters at multiple scales to give the classifier more information to work with. This helped to account for cases where, for example, a smaller filter would fall within a large choroidal vessel and give a standard deviation value that is within the range for intact choriocapillaris (Fig. 1).
Fig. 1.
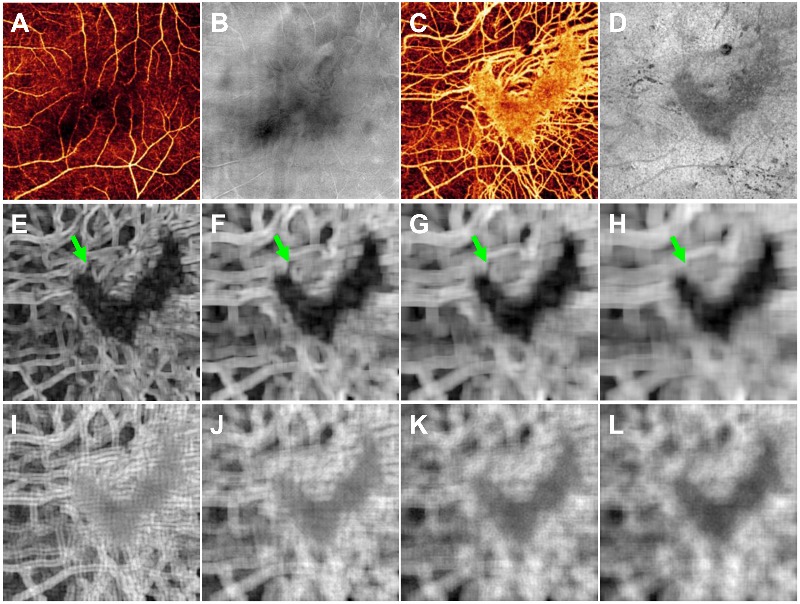
The 12 features for the random forest classifier. (A) Inner retinal angiogram. (B) En face structural OCT of the inner retina. (C) Choroidal angiogram with a V-shaped island of intact choriocapillaris. (D) Reflectance values of the voxel projected for the choroidal angiogram. (E-H) The choroidal angiogram after standard deviation filters of 180 × 180 µm (E), 300 × 300 µm (F), 380 × 380 µm (G), and 500 × 500 µm (H). Note the difference in appearance of a larger choroidal vessel after standard deviation filters of different sizes (green arrows). (I-L) The choroidal angiogram after Gabor directional filters of 200 × 200 µm (I), 320 × 320 µm (J), 400 × 400 µm (K), and 520 × 520 µm (L).
Four different sizes of the standard deviation filter were used: 180 × 180, 300 × 300, 380 × 380, 500 × 500 µm. Likewise, four different sizes of the Gabor filter were used: 200 × 200, 320 × 320, 400 × 400, 520 × 520 µm. These dimensions were roughly double and quadruple the sizes of the larger retinal vessel projections and larger choroidal vessels. For each size of the Gabor filter, we generated 240 images based on different combinations of orientations (every 45°), standard deviations of the Gaussian envelope (5 to 25, steps of 5), and frequencies of the sinusoid (0.075 to 0.2, steps of 0.025). To reduce the number of features and thus reduce the time required for training the classifier, we summed and normalized the results for each Gabor filter size. Figure 1 shows an example of these features for an OCTA scan.
2.4 Random forest classifier
The random forest classifier [7] is a popular and intuitive supervised machine learning tool which has previously been applied to OCT images for angle closure detection [16] and cyst identification [17] among others. It combines the results from multiple decision trees to make a classification, which in our case means determining whether a pixel on the choroidal angiogram represents intact choriocapillaris or not. We used the TreeBagger function in Matlab to generate a random forest classifier with 100 decision trees. A greater number of trees in the random forest results in improved performance, following an exponential decay curve, at the cost of additional training and processing time. Fifty or 100 trees are commonly used parameters. In this case, 100 trees showed a slight improvement, with a misclassification probability improvement of 2.6% for out-of-bag data (i.e., data not used for building the specific tree). The input into the TreeBagger function was an n × 12 matrix where each row in n is the same pixel on a set of 12 images corresponding to the 12 features and a binary vector of length n with the corresponding manual grading of intact choriocapillaris. For example, if training was done with only a single OCTA scan, the input would be a 92,416 × 12 (3042 × 12) matrix and a 92,416 × 1 vector. With 10 OCTA scans, the inputs would be a 924,160 × 12 matrix and a 924,160 × 1 vector (Fig. 2(A)).
Fig. 2.
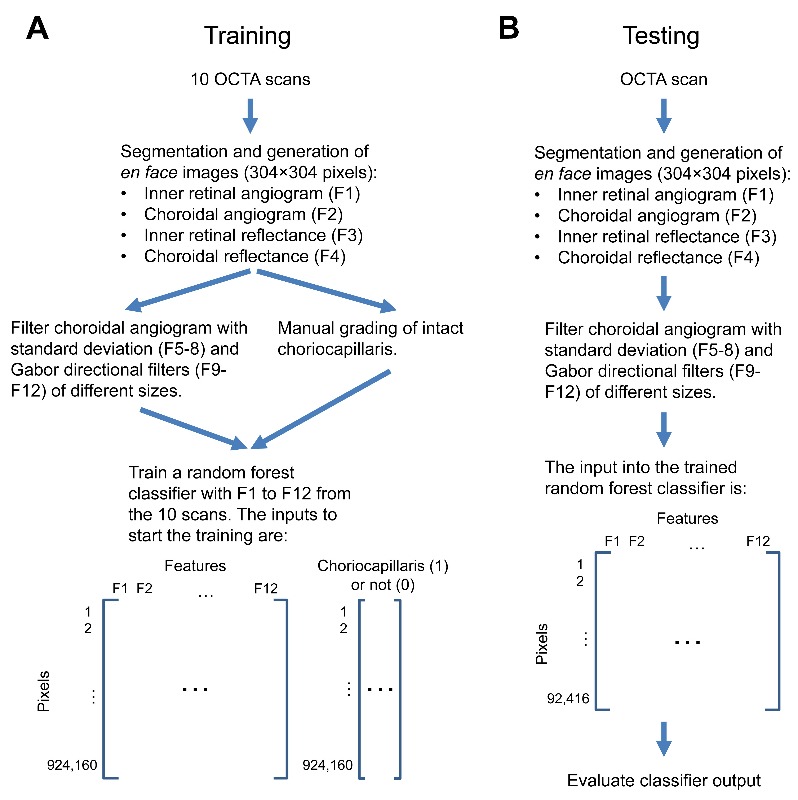
Flowchart of the training (A) and testing (B) process.
Each individual decision tree within the classifier was generated with a random sampling of half of the training data with replacement and is comprised of numerous nodes where a binary decision was made based on thresholding of a single feature. At each node, only three randomly selected features were considered. The randomness serves to reduce correlation between decision trees. The choice at each node and thus the decision tree itself was built by maximizing the information gain based on the Gini index [18]. Briefly, for a binary choriocapillaris (1) or not (0) decision, the Gini of a node n is
| (1) |
where p(n) is the relative frequency of the choriocapillaris classification in the node. The information gain I by splitting the parent node P into its children L and R based on thresholding of a feature is then
| (2) |
where q is the fraction of the data split into the left path. The thresholded feature with the highest I was then chosen. If a node had a Gini of 0, that indicated a terminal, or leaf, node.
3. Results
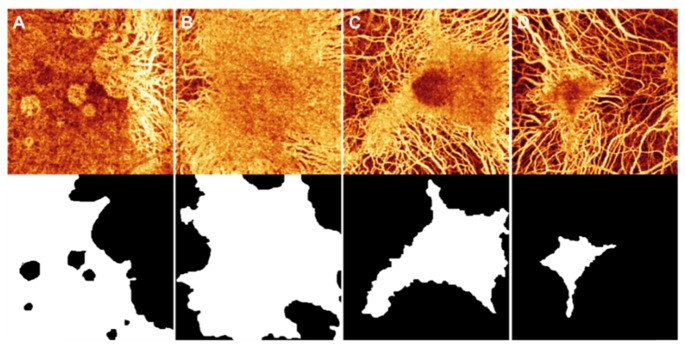
A total of 30 eyes from 19 participants with choroideremia (age: 45 ± 19, range: 14-79) were included in the study. Of the 30 eyes, 10 were selected as the training set. These were not selected randomly, but chosen such that they represent the spectrum of patterns that the classifier will be tasked with distinguishing. Figure 3 shows the choroidal angiogram and manual grading of intact choriocapillaris in 4 of the eyes.
Fig. 3.
The choroidal angiogram (top) and corresponding manual grading (bottom) of intact choriocapillaris in 4 (A to D) of the 10 training cases. In the graded images, white represents the selected intact choriocapillaris. All four choroidal angiograms are displayed on the same scale.
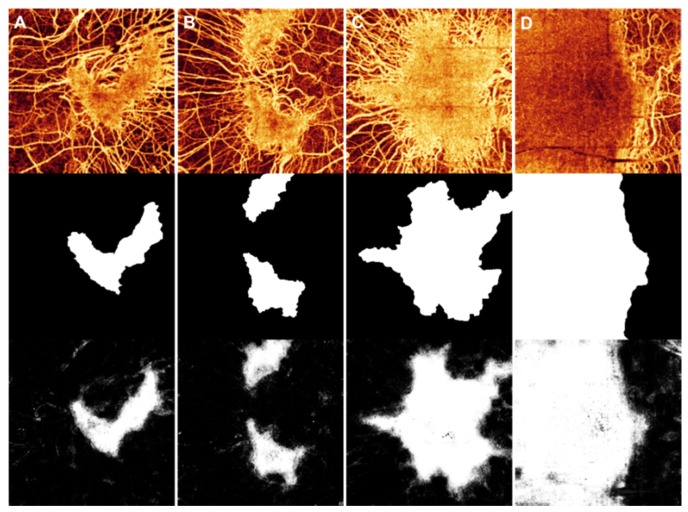
Training the random forest classifier took approximately 12 minutes (Intel i7-4770 3.4GHz CPU, without parallel processing). To test how well the classifier would perform (Fig. 2(B)), we used the remaining 20 eyes for cross-validation. The classifier output was the average result from the 100 decision trees. Each pixel of the output image has a value between 0 and 1, representing the likelihood that the pixel was intact choriocapillaris. Figure 4 shows the choroidal angiogram, manual grading, and classifier output from 4 of the eyes.
Fig. 4.
The choroidal angiogram (top), corresponding manual grading (middle), and random forest classifier output of intact choriocapillaris in 4 (A to D) of the 20 test cases. All four of the choroidal angiograms are displayed on the same scale.
To assess how well the classifier performed, we first used a 100 × 100 µm median filter on the classifier output to reduce noise and then binarized the image. Next, we compared the binarized classifier output to manual grading using the Jaccard similarity index [19,20], defined as the ratio between the intersection and union of what was identified as intact choriocapillaris (Figs. 5(A) and 5(B)). The Jaccard coefficient was calculated as follows
| (3) |
where CRF is identified choriocapillaris from the random forest classifier and CM is the manually identified choriocapillaris. The coefficient will be between 0 and 1, where 0 means that the two were completely dissimilar and 1 denotes that the two were identical. Over the range of thresholds used to binarize the classifier output, we see a local maximum at a threshold of 0.35 and a Jaccard of 0.81 ± 0.12 (mean ± standard deviation) for the 20 test eyes (Fig. 5(C)). If we take the highest Jaccard for each case irrespective of the threshold, the average Jaccard was 0.83. In general, cases with more preserved choriocapillaris had higher Jaccard values (R = 0.59).
Fig. 5.
(A) The choroidal angiogram. (B) Evaluation of the classifier output after binarization with a threshold of 0.5. The areas in white are where the classifier and grader agreed on what was intact choriocapillaris. The areas in grey show disagreement. The Jaccard for this example was 0.86. (C) The Jaccard (mean ± standard deviation) for the 20 test eyes across different binarization thresholds.
4. Discussion
OCTA is a new technique for assessing the choriocapillaris. Quantitative analysis of choriocapillaris in degenerative diseases may have important clinical implications. In this work, we developed a random forest classifier which could identify intact choriocapillaris amidst projection and shadowing artifacts in cases of choroideremia. The classifier was first trained on 10 eyes and then evaluated on 20 different eyes. A comparison of the classifier output to manual grading showed good agreement with an average Jaccard of 0.81.
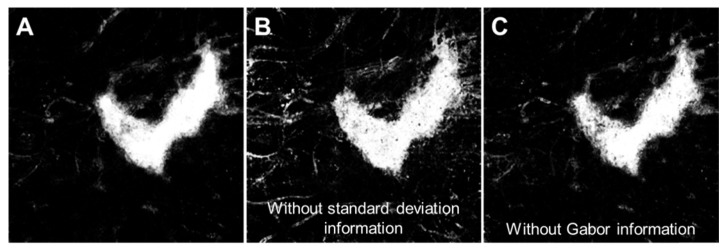
As expected, the features for the classifier to evaluate and the cases used for training are critical components in developing the classifier. When we excluded the standard deviation and Gabor filtered images of the choroidal angiogram as part of the features, the random forest classifier performed poorly. When we only included one of the two, the average Jaccard for the test eyes was reduced, to 0.72 without the standard deviation information and to 0.78 without the directional Gabor information. Closer inspection of the classifier output with both the standard deviation and Gabor information (Fig. 6(A)), without the standard deviation information (Fig. 6(B)), and without the Gabor information (Fig. 6(C)) for the case shown in the leftmost column of Fig. 4 was informative. We found that without the standard deviation information, there was more false positive signal in the regions without choriocapillaris. Without the Gabor information, we found that there was more false negative signal within the intact choriocapillaris.
Fig. 6.
Example of the classifier output without select features. (A) Classifier output with all features. (B) Classifier output without standard deviation information. (C) Classifier output without Gabor information.
We also assessed whether our choice of four different filter sizes for both the standard deviation and Gabor filters was necessary. If we only used the smallest or largest filter size, the average Jaccard was reduced by 0.02 and 0.01, respectively. If we removed the two middle filter sizes and used only the smallest and largest filter sizes, then the average Jaccard was reduced by 0.002. Adding two larger filter sizes for both the standard deviation (580 × 580 µm and 700 × 700 µm) and Gabor filters (600 × 600 µm and 720 × 720 µm) improved the average Jaccard by 0.003. It appears some optimization is possible, but the improvements would be minor.
Beyond the standard deviation and Gabor filters, we also explored the impact of including the retinal angiogram and structural OCT information as features. If we removed the retinal angiogram from the feature list, the average Jaccard was reduced by 0.003. This suggested that the retinal angiogram was mostly redundant and that the standard deviation and Gabor filters were enough for the classifier to identify vessel projections. When we removed the choroidal reflectance image instead, the average Jaccard dropped by 0.04 to 0.77. Removing the inner retinal and choroidal reflectance images resulted in the average Jaccard being 0.003 lower than without only the choroidal reflectance information. On the classifier output image, the effect was similar to those images without the Gabor information, where there was more false negative signal within the intact choriocapillaris.
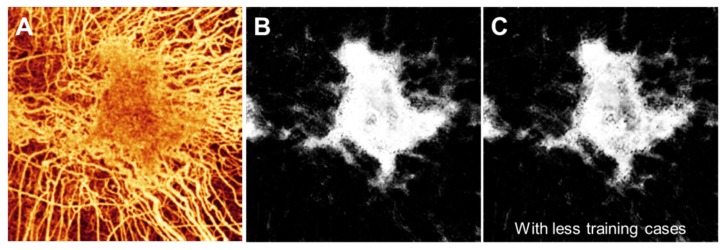
Finally, with regards to the cases for training, it is important to have training cases that cover the spectrum of what the classifier will see. For example, if we did not include the cases shown in Figs. 3(C) and 3(D) as well as another similar case, then regions inside intact choriocapillaris where the flow signal was reduced were less likely to be properly classified (Fig. 7).
Fig. 7.
Example of the classifier output with less training cases. (A) The choroidal angiogram. (B) Classifier output if all 10 of the training cases were used. (C) Classifier output if only 7 of the 10 training cases were used, excluding the cases shown in Figs. 3(C) and 3(D) as well as another similar case.
Although our trained classifier performed well in cases of choroideremia with islands of remaining choriocapillaris, it had trouble in a couple cases like Fig. 3(A) where there was patchy loss within a large region of intact choriocapillaris. If including more training cases leads to little improvement, then additional features derived from the volumetric OCT and OCTA data will likely be needed. In training the classifier, we had reduced the three-dimensional information using mean and maximum projection in depth. The projection was done over relatively large thickness. Perhaps using thinner slabs and more slabs may give the classifier additional descriptive information. Alternatively, instead of projecting, features could remain three-dimensional. This would increase the computational requirements significantly however. Finally, including variants of the described techniques for reducing image artifacts [21] may be valuable.
Acknowledgments
Financial interests: OHSU, D.H., and Y.J. have a significant financial interest in Optovue, Inc. D.H. also has a financial interest in Carl Zeiss Meditec. M.Z. is now an employee at Optovue, Inc. M.E.P. consults for Sucampo Pharmaceuticals, ISIS Pharmaceuticals, and AGTC. He also receives grant support as part of a clinical trial from AGTC and Sanofi. R.G.W. holds U.S. patent no. 8657446 and is a PI for clinical trials supported by Sanofi. He is also the PI for a center grant from Foundation Fighting Blindness (FFB) and serves on the advisory board for AGTC and FFB. These potential conflicts of interest have been reviewed and managed by OHSU.
Funding
National Institutes of Health (NIH) (DP3 DK104397, R01 EY024544, R01 EY023285, P30 EY010572); Choroideremia Research Foundation; unrestricted departmental funding from Research to Prevent Blindness.
References and links
- 1.Jain N., Jia Y., Gao S. S., Zhang X., Weleber R. G., Huang D., Pennesi M. E., “Optical Coherence Tomography Angiography in Choroideremia: Correlating Choriocapillaris Loss With Overlying Degeneration,” JAMA Ophthalmol. 134(6), 697–702 (2016). 10.1001/jamaophthalmol.2016.0874 [DOI] [PMC free article] [PubMed] [Google Scholar]
- 2.Spaide R. F., Fujimoto J. G., Waheed N. K., “Image Artifacts in Optical Coherence Tomography Angiography,” Retina 35(11), 2163–2180 (2015). 10.1097/IAE.0000000000000765 [DOI] [PMC free article] [PubMed] [Google Scholar]
- 3.Gao S. S., Jia Y., Zhang M., Su J. P., Liu G., Hwang T. S., Bailey S. T., Huang D., “Optical Coherence Tomography Angiography,” Invest. Ophthalmol. Vis. Sci. 57(9), 27–36 (2016). 10.1167/iovs.15-19043 [DOI] [PMC free article] [PubMed] [Google Scholar]
- 4.de Carlo T. E., Bonini Filho M. A., Chin A. T., Adhi M., Ferrara D., Baumal C. R., Witkin A. J., Reichel E., Duker J. S., Waheed N. K., “Spectral-domain optical coherence tomography angiography of choroidal neovascularization,” Ophthalmology 122(6), 1228–1238 (2015). 10.1016/j.ophtha.2015.01.029 [DOI] [PubMed] [Google Scholar]
- 5.Kuehlewein L., Bansal M., Lenis T. L., Iafe N. A., Sadda S. R., Bonini Filho M. A., De Carlo T. E., Waheed N. K., Duker J. S., Sarraf D., “Optical Coherence Tomography Angiography of Type 1 Neovascularization in Age-Related Macular Degeneration,” Am. J. Ophthalmol. 160(4), 739–748 (2015). 10.1016/j.ajo.2015.06.030 [DOI] [PubMed] [Google Scholar]
- 6.Boese E. A., Jain N., Jia Y., Schlechter C. L., Harding C. O., Gao S. S., Patel R. C., Huang D., Weleber R. G., Gillingham M. B., Pennesi M. E., “Characterization of Chorioretinopathy Associated with Mitochondrial Trifunctional Protein Disorders: Long-Term Follow-up of 21 Cases,” Ophthalmology 123(10), 2183–2195 (2016). 10.1016/j.ophtha.2016.06.048 [DOI] [PMC free article] [PubMed] [Google Scholar]
- 7.Breiman L., “Random Forests,” Mach. Learn. 45(1), 5–32 (2001). 10.1023/A:1010933404324 [DOI] [Google Scholar]
- 8.Soares J. V., Leandro J. J., Cesar Júnior R. M., Jelinek H. F., Cree M. J., “Retinal vessel segmentation using the 2-D Gabor wavelet and supervised classification,” IEEE Trans. Med. Imaging 25(9), 1214–1222 (2006). 10.1109/TMI.2006.879967 [DOI] [PubMed] [Google Scholar]
- 9.Haghighat M., Zonouz S., Abdel-Mottaleb M., “CloudID: Trustworthy cloud-based and cross-enterprise biometric identification,” Expert Syst. Appl. 42(21), 7905–7916 (2015). 10.1016/j.eswa.2015.06.025 [DOI] [Google Scholar]
- 10.Gao S. S., Liu G., Huang D., Jia Y., “Optimization of the split-spectrum amplitude-decorrelation angiography algorithm on a spectral optical coherence tomography system,” Opt. Lett. 40(10), 2305–2308 (2015). 10.1364/OL.40.002305 [DOI] [PMC free article] [PubMed] [Google Scholar]
- 11.Jia Y., Tan O., Tokayer J., Potsaid B., Wang Y., Liu J. J., Kraus M. F., Subhash H., Fujimoto J. G., Hornegger J., Huang D., “Split-spectrum amplitude-decorrelation angiography with optical coherence tomography,” Opt. Express 20(4), 4710–4725 (2012). 10.1364/OE.20.004710 [DOI] [PMC free article] [PubMed] [Google Scholar]
- 12.Kraus M. F., Liu J. J., Schottenhamml J., Chen C. L., Budai A., Branchini L., Ko T., Ishikawa H., Wollstein G., Schuman J., Duker J. S., Fujimoto J. G., Hornegger J., “Quantitative 3D-OCT motion correction with tilt and illumination correction, robust similarity measure and regularization,” Biomed. Opt. Express 5(8), 2591–2613 (2014). 10.1364/BOE.5.002591 [DOI] [PMC free article] [PubMed] [Google Scholar]
- 13.Tan O., Li G., Lu A. T., Varma R., Huang D., Advanced Imaging for Glaucoma Study Group , “Mapping of macular substructures with optical coherence tomography for glaucoma diagnosis,” Ophthalmology 115(6), 949–956 (2008). 10.1016/j.ophtha.2007.08.011 [DOI] [PMC free article] [PubMed] [Google Scholar]
- 14.Zhang M., Wang J., Pechauer A. D., Hwang T. S., Gao S. S., Liu L., Liu L., Bailey S. T., Wilson D. J., Huang D., Jia Y., “Advanced image processing for optical coherence tomographic angiography of macular diseases,” Biomed. Opt. Express 6(12), 4661–4675 (2015). 10.1364/BOE.6.004661 [DOI] [PMC free article] [PubMed] [Google Scholar]
- 15.Gao S. S., Jia Y., Liu L., Zhang M., Takusagawa H. L., Morrison J. C., Huang D., “Compensation for Reflectance Variation in Vessel Density Quantification by Optical Coherence Tomography Angiography,” Invest. Ophthalmol. Vis. Sci. 57(10), 4485–4492 (2016). 10.1167/iovs.16-20080 [DOI] [PMC free article] [PubMed] [Google Scholar]
- 16.Nongpiur M. E., Haaland B. A., Friedman D. S., Perera S. A., He M., Foo L. L., Baskaran M., Sakata L. M., Wong T. Y., Aung T., “Classification algorithms based on anterior segment optical coherence tomography measurements for detection of angle closure,” Ophthalmology 120(1), 48–54 (2013). 10.1016/j.ophtha.2012.07.005 [DOI] [PubMed] [Google Scholar]
- 17.Lang A., Carass A., Swingle E. K., Al-Louzi O., Bhargava P., Saidha S., Ying H. S., Calabresi P. A., Prince J. L., “Automatic segmentation of microcystic macular edema in OCT,” Biomed. Opt. Express 6(1), 155–169 (2015). 10.1364/BOE.6.000155 [DOI] [PMC free article] [PubMed] [Google Scholar]
- 18.Breiman L., Friedman J., Olshen R., Stone C., Classification and Regression Trees (CRC Press, Boca Raton, FL, 1984). [Google Scholar]
- 19.Liu L., Gao S. S., Bailey S. T., Huang D., Li D., Jia Y., “Automated choroidal neovascularization detection algorithm for optical coherence tomography angiography,” Biomed. Opt. Express 6(9), 3564–3576 (2015). 10.1364/BOE.6.003564 [DOI] [PMC free article] [PubMed] [Google Scholar]
- 20.Gao S. S., Liu L., Bailey S. T., Flaxel C. J., Huang D., Li D., Jia Y., “Quantification of choroidal neovascularization vessel length using optical coherence tomography angiography,” J. Biomed. Opt. 21(7), 076010 (2016). 10.1117/1.JBO.21.7.076010 [DOI] [PMC free article] [PubMed] [Google Scholar]
- 21.Zhang M., Hwang T. S., Campbell J. P., Bailey S. T., Wilson D. J., Huang D., Jia Y., “Projection-resolved optical coherence tomographic angiography,” Biomed. Opt. Express 7(3), 816–828 (2016). 10.1364/BOE.7.000816 [DOI] [PMC free article] [PubMed] [Google Scholar]


