

Drosophila genetics is combined with high-resolution microscopy and a number of functional readouts to demonstrate key factors required for the presence of regularly spaced rings of cortical actin in axons. The data suggest important roles for the actin rings in microtubule regulation, most likely by sustaining their polymerization.
Abstract
Axons are cable-like neuronal processes wiring the nervous system. They contain parallel bundles of microtubules as structural backbones, surrounded by regularly spaced actin rings termed the periodic membrane skeleton (PMS). Despite being an evolutionarily conserved, ubiquitous, highly ordered feature of axons, the function of PMS is unknown. Here we studied PMS abundance, organization, and function, combining versatile Drosophila genetics with superresolution microscopy and various functional readouts. Analyses with 11 actin regulators and three actin-targeting drugs suggest that PMS contains short actin filaments that are depolymerization resistant and sensitive to spectrin, adducin, and nucleator deficiency, consistent with microscopy-derived models proposing PMS as specialized cortical actin. Upon actin removal, we observed gaps in microtubule bundles, reduced microtubule polymerization, and reduced axon numbers, suggesting a role of PMS in microtubule organization. These effects become strongly enhanced when carried out in neurons lacking the microtubule-stabilizing protein Short stop (Shot). Combining the aforementioned actin manipulations with Shot deficiency revealed a close correlation between PMS abundance and microtubule regulation, consistent with a model in which PMS-dependent microtubule polymerization contributes to their maintenance in axons. We discuss potential implications of this novel PMS function along axon shafts for axon maintenance and regeneration.
INTRODUCTION
Axons are slender, cable-like extensions of neurons that wire the nervous system and propagate nerve impulses (Prokop, 2013). Their damage causes impairment of movement or cognitive abilities (Smith et al., 2000), yet most axons cannot be replaced, and their delicate structure usually has to be maintained for an organism’s lifetime. Unsurprisingly, we gradually lose half of our axons during healthy aging and far more in neurodegenerative diseases (Adalbert and Coleman, 2012).
Here we seek to understand the mechanisms of long-term axon maintenance, which will also be relevant for understanding axon pathology during aging and disease. We focus on the cytoskeleton and its immediate regulators, which have prominent hereditary links to neurodegenerative disorders (Prokop et al., 2013). Of particular importance are parallel bundles of microtubules (MTs), which run the length of axons; they need to be actively maintained because they form the structural backbones of axons and highways for life-sustaining transport of materials, organelles, and signals between cell bodies and the distal synaptic endings (Prokop, 2013; Voelzmann et al., 2016b).
F-actin is a potent regulator of MTs in neuronal contexts, such as in growth cones or axonal branching (Prokop et al., 2013; Kalil and Dent, 2014), but it is unknown whether F-actin might also be a regulator during MT maintenance in axons. Most of the actin networks in axons appear ill suited for such a task because they are locally restricted or short-lived, including dense networks at the axon initial segment (Rasband, 2010; Li et al., 2011; Galiano et al., 2012; Watanabe et al., 2012), shaft filopodia (Kalil and Dent, 2014), lamellipodia-like actin waves (Flynn et al., 2009), and transiently occurring longitudinal actin filaments (Ganguly et al., 2015). The only known persistent actin networks occurring all along axons is the recently discovered periodic membrane skeleton (PMS), which can be observed in culture and in vivo in different animal species, but also in dendrites or neurite-like glial processes (Xu et al., 2013; Lukinavičius et al., 2014; D’Este et al., 2015; He et al., 2016).
PMS is believed to represent a specific form of cortical F-actin: it was proposed to consist of short, adducin-capped actin filaments bundled into rings and cross-linked by spectrins that space them into regular ∼180-nm intervals. However, this model is mainly based on superresolution microscopy analyses, and very few actin regulators have been functionally assessed for their potential contributions to PMS architecture. Thus it was suggested that spectrins play a major role in their formation (Zhong et al., 2014), whereas knockdown of ankyrinB (Zhong et al., 2014) or loss of adducin (Leite et al., 2016) had no effect on PMS organization.
Here we take a new approach to analyzing PMS. Previous analyses performed made use of stochastic optical reconstruction microscopy (STORM) or stimulated emission depletion (STED) microscopy, whereas we used structured illumination microscopy (SIM). SIM provides slightly lower resolution but gives highly robust readouts for the periodic patterns, which enabled us to perform quantitative analyses of PMS abundance across axon populations. As our cellular system, we used neurons of the fruit fly Drosophila, which provide easy access to experimental and genetic analyses (Prokop et al., 2013), and so we were able to study the functional depletion of 11 actin regulators and three actin-targeting drugs. We found a range of robust and highly reproducible effects on PMS, which provide functional support for the view that PMS represents cortical actin specializations. We then combined these actin manipulations with a number of readouts for axonal MTs, suggesting prominent roles for cortical actin networks in promoting the polymerization of axonal MTs relevant for axon maintenance.
RESULTS
Drosophila periodic membrane skeleton in axons is a stable actin network
To visualize axonal actin, we used SIM and imaged primary neurons of the fruit fly Drosophila, which we cultured for >6 days in vitro (DIV) and then fixed and stained them with SiR-actin. We used strategies that allowed us to selectively visualize axons and exclude dendrites (see Materials and Methods). These SIM-imaged axons revealed irregular dotted or elongated actin accumulations potentially demarcating synapses (arrows in Figure 1E), occasional longitudinal actin trails, as described also for mammalian neurons (boxed area 4 in Figure 1E; Ganguly et al., 2015), and abundant periodic actin patterns with a repeat length of 184 ± 2 nm, highly reminiscent of the PMS (Figure 1, A–E). Further validation clearly showed the PMS to be genuine. First, we found the same periodicity when using STED microscopy (Figure 1, C and D). Second, SIM imaging with anti-tubulin staining showed no periodicity (Figure 1F). Third, overlay images of the same preparation taken from three versus five angles showed a clear overlay (Figure 1, A and E). Finally, our findings in cultured primary neurons are in agreement with in vivo observation of PMS in axons of fly embryos and larvae (He et al., 2016) and periodic spectrin patterns observed in earlier studies (Pielage et al., 2008).
FIGURE 1:

Superresolution images of Drosophila axons display PMS. (A) SIM image of SiR-actin–stained Drosophila primary neurons at 10 DIV; precise overlay of two independent rounds of image acquisition using three (green) vs. five (magenta) rotation angles; the framed area is shown fourfold magnified in the inset. (B) Autocorrelation analysis showing the regular periodicity of the actin staining with a lag of 184 nm. (C, D) Axon visualized via STED shown as raw (C) and deconvolved (D) images. (E) Full SIM image of SiR-actin–stained neurons at 10 DIV; the large boxed area is shown at larger scale in A; small boxed areas are shown as insets at the top, illustrating the high reliability of PMS appearance in these cultures; arrows mark dotted or elongated actin accumulations, and boxed area 4 might show an actin trail. (F) Full SIM image of neurons at 10 DIV stained with anti-tubulin; boxed area is shown as a 2.4-fold magnified inset at bottom right (note that tubulin staining does not show any periodicity). Scale bars, 3 µm (A, inset of F), 1.2 µm (C, D, inset of A), 7.2 µm (E, F), 2.1 µm (insets of E).
Compared to STED, SIM provides slightly lower resolution and does not permit measurements of actin content in PMS because it uses a demodulation algorithm with which the raw detected signal cannot be converted into photon counts. However, as an essential advantage for our studies, SIM allowed fast imaging and revealed PMS with high reliability in virtually all preparations (see overview in Figure 1E). This enabled us to reach sample numbers of several hundred to >1000 axon segments from different biological and technical repeats of each set of experiments. These conditions were ideal for systematic quantitative analyses, and we quantified the relative number of axon segments displaying PMS (termed PMS abundance) across axon populations of each experimental condition (see Materials and Methods).
Using PMS abundance as readout, we investigated the relative vulnerability/resistance of PMS to actin-destabilizing drugs. For mammalian axons, it was shown that the actin-destabilizing drugs cytochalasin D (CytoD) and latrunculin A (LatA) at high doses destroy PMS (Zhong et al., 2014). CytoD sequesters actin monomers and also directly destabilizes barbed ends of actin filaments (Peterson and Mitchison, 2002). Accordingly, when we treated neurons at 10 DIV with a concentration as low as 800 nM, we found a significant reduction of PMS abundance, down to 32% compared with wild type (Figure 2, E’ and F).
FIGURE 2:

Functional dissection of PMS. (A–E) Representative SIM images of SiR-actin–labeled axons at 10 DIV genetically or pharmacologically manipulated as indicated on the right; scale bar, 550 nm (E’, for all SIM images); schematics on the left provide an interpretation of the observed phenotype, based on the previously proposed cortical actin model (Xu et al., 2013). (F) Quantification of PMS abundance in axons of mature neurons at 10 DIV normalized to parallel control cultures; dotted lines separate different manipulations affecting regulators of structure, polymerization, or nucleation; p values were obtained via chi-squared analysis of raw data comparing axon segments with/without PMS (n.s., p > 0.05; *p = 0.05; **p = 0.01; ***p = 0.001); numbers in bars represent sample numbers (i.e., analyzed axon segments); error bars represent SEM of independent experimental repeats. (G) Box-and-whisker plot showing periodicity within MPS (whiskers indicate 90th percentile); note that the lower whiskers are truncated by the limitation of image resolution achievable in SIM; p values were obtained via chi-squared analysis of raw data comparing axon segments with/without PMS (n.s., p > 0.05; *p = 0.05; **p = 0.01; ***p = 0.001). (H) Average spatial autocorrelation curves showing the PMS periodicity, each calculated from 15 axon segments showing clear PMS. Detailed data underlying these graphs are given in Supplemental Figure S1 and Table S1, p. 1.
In contrast, LatA sequesters only actin monomers, thus primarily suppressing their polymerization (Peterson and Mitchison, 2002). Accordingly, 4-h low-dose treatment with LatA at 200 nM caused only a nonsignificant reduction to 94% (Figure 2, A’’’ and F). As a positive control, we used young neurons, which display prominent filopodia dependent on highly dynamic actin filament networks (Gonçalves-Pimentel et al., 2011). We found that 4- and even 1-h treatment with LatA or CytoD completely eliminated filopodia (Figure 3, B, C, and G), clearly demonstrating that both drugs were highly effective at the low dosage used.
FIGURE 3:
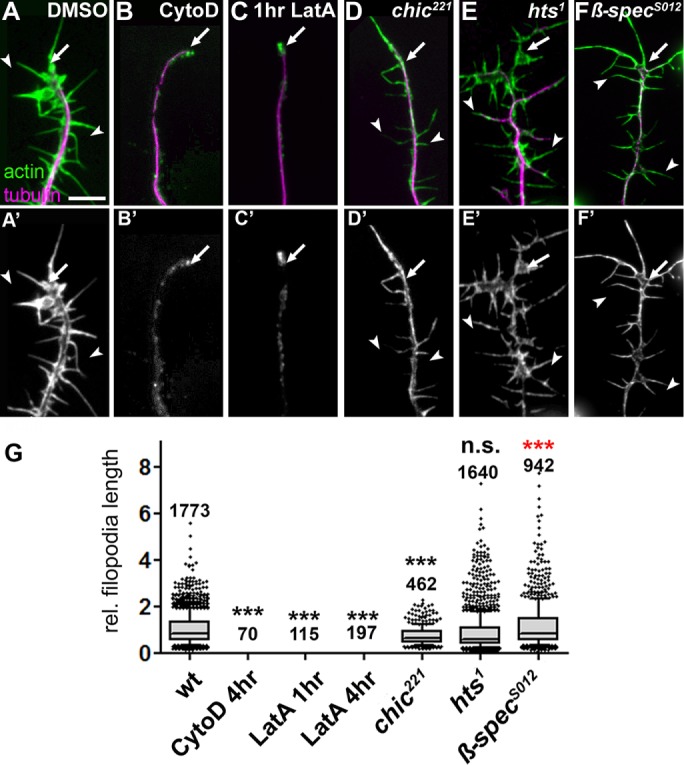
Effects of actin manipulations on filopodial length. (A–F’) Filopodial length phenotypes in DMSO-treated wild-type primary neurons or neurons treated with drugs or being mutant, as indicated; cells are double-labeled for actin (green in top row, white in bottom row) and tubulin (magenta in top row); drug treatments: 800 nM CytD for 4 h, 200 nM LatA for 1 h. (G) Quantifications of filopodia length caused by drug treatment or mutations shown at the top (all normalized and compared with DMSO-treated controls); numbers above the bars indicate the number of filopodia analyzed in each experiment; note that filopodia were completely absent in all cases of CytoD and LatA treatment. p values were calculated using the Mann–Whitney rank sum test (n.s., p > 0.05; ***p < 0.001; red indicates higher than wild type). Scale bar, 10 μm (A–F).
The differential effects that LatA in particular had on dynamic actin networks in filopodia but not on the structure of PMS suggest that the barbed ends of actin filaments in PMS are to a degree protected against actin monomer sequestration. A candidate protein mediating this effect could be adducin (see next section).
PMS abundance strongly depends on the cortical actin regulators spectrin and adducin
We next used SIM analyses of neurons at 10 DIV and studied known components of cortical actin, in particular spectrins, adducin, and ankyrin (Baines, 2010), which were all reported to reside in or at PMS (Xu et al., 2013; Zhong et al., 2014).
We first tested spectrins, which usually form hetero-oligomers composed of α- and β-spectrins. Although there seems to be no reported data for α-spectrin in mammalian neurons, β-spectrin was shown to localize at PMS, and it has been stated that knockdown of βII-spectrin eliminates PMS (Xu et al., 2013; Zhong et al., 2014). Drosophila α- and β-spectrin are each encoded by only one gene, and both proteins are localized in axons (Pielage et al., 2006; Garbe et al., 2007; Hülsmeier et al., 2007). We therefore tested neurons carrying the α-Specrg41 or β-SpecS012 null mutant alleles, which eliminate Drosophila α- and β-spectrin, respectively (see Materials and Methods). We found β-SpecS012 to cause a drastic and highly significant reduction of PMS abundance to 58% (Figure 2, D’ and F). Furthermore, within existing PMS, the average periodic spacing was highly significantly increased to 197 ± 2 nm, and it was less regular: autocorrelation curves averaged from 15 independent samples (see Materials and Methods) indicated strongly reduced periodicity (Figure 2, G and H, and Supplemental Figure S1). In contrast, α-Specrg41 causes only a moderately significant and far milder reduction of PMS abundance to 89% (Figure 2F), and the average periodicity of 183 ± 3 nm was normal. However, there was a larger variation in distances, as also reflected in the lower amplitude in the averaged autocorrelation curve (Figure 2, G and H, and Supplemental Figure S1). These findings suggest that α/β-spectrin hetero-oligomers contribute to PMS abundance and organization, with β-spectrin playing a more important role, as judged from the stronger phenotypes.
Our findings are in agreement with reports that used very different readouts to conclude that α-spectrin is of less importance in Drosophila neurons than β-spectrin; β-spectrin maintains a good degree of functionality even in the absence of α-spectrin (Pielage et al., 2006; Garbe et al., 2007; Hülsmeier et al., 2007). Mechanistically, this can be explained by the fact that β-spectrins, but not α-spectrins, contain the essential binding sites for actin and adducin, and β-spectrin at vertebrate synapses can form functional homo-oligomers (Bloch and Morrow, 1989; Pumplin, 1995).
Adducin caps F-actin barbed ends and is therefore a likely candidate for providing a mechanism that renders PMS less sensitive to CytoD and LatA. Surprisingly, complete loss of mammalian adducin function was reported to affect neither the periodicity of PMS nor the expression of spectrin (Leite et al., 2016). However, this study did not investigate the abundance of PMS. We therefore analyzed PMS in neurons carrying the hts1 null mutant allele, which abolishes Drosophila adducin. As observed in mammalian axons, we found that PMS in these neurons had a normal periodicity of 183 ± 2 nm (Figure 2, G and H) and a moderate deviation in reliability (Supplemental Figure S1), and axonal α-spectrin staining seemed unaffected in hts1 mutant neurons (Supplemental Figure S2). However, in contrast to the normal appearance of these qualitative measures, our quantitative analyses of hts1 mutant neurons revealed a strong reduction of PMS abundance to 43.5% (Figure 2, C’ and F). To confirm this finding, we used the independent strong loss-of-function mutant allele hts01103 and also found a highly significant reduction in PMS abundance to 69.2% (Figure 2F).
Finally, we tested ankyrin, which is known to link cortical actin to the membrane and other structures but was reported to not affect PMS formation in mammalian axons (Zhong et al., 2014). Similarly, our quantitative analyses using the null mutant ank2518 allele showed only a mild, nonsignificant reduction in PMS abundance to 92% (Supplemental Figure 2F).
Taken together, two key players of cortical F-actin networks—spectrin and adducin—are important for PMS formation and/or maintenance. Of note, the hts1 and β-SpecS012 mutant alleles affect PMS but cause no reduction in filopodial length in young neurons (maternal contribution removed; Figure 3, E–G). This, together with our pharmacological studies, lends further support to the notion that actin networks of PMS significantly differ from dynamic actin networks.
Actin filaments in PMS are likely short but high in number
Our 4-h treatments with the actin monomer–sequestering drug LatA suggested that PMS is less dependent on actin polymerization than other actin networks. This is consistent with PMS actin filaments being relatively short, as proposed previously (Xu et al., 2013). They should therefore have little requirement for actin elongation factors. We tested this by analyzing neurons carrying the chic221 null mutant allele, which eliminates the function of Drosophila profilin, a prominent actin elongation factor (Gonçalves-Pimentel et al., 2011). As predicted, the chic221 mutant neurons displayed no significant reduction in PMS abundance at 10 DIV (Figure 2, A’’ and F), and the autocorrelation intensity has no significant difference from the wild type (Figure 2, G and H, and Supplemental Figure S1). Next we tested the involvement of Ena/VASP, which has a number of functions, one being to closely collaborate with profilin in actin filament elongation (Bear and Gertler, 2009; Gonçalves-Pimentel et al., 2011). However, when using the ena23 allele to deplete Ena/VASP, we found a significant reduction in PMS abundance at 10 DIV to 83% (Figure 2F). Therefore further profilin-independent functions of Ena/VASP seem to play a role at PMS. One of these roles is to promote nucleation (the formation of new actin filaments; Gonçalves-Pimentel et al., 2011), and we reasoned that actin nucleation should be particularly important for PMS, where actin filaments are short and therefore expected to be high in number.
To test this, we depleted the functions of two distinct nucleators, Arp2/3 and the formin DAAM, which are known to function in parallel in Drosophila primary neurons (Gonçalves-Pimentel et al., 2011). We found that both nucleators contribute to PMS. First, genetic depletion of three proteins required for Arp2/3 function (see Materials and Methods) showed a consistent reduction of PMS abundance to ∼80% (Figure 2F; Arpc11, 79%; SCARΔ37, 85%; Hem03335, 75%). Second, neurons carrying the DAAMEx68 null mutation or treated with the formin-inhibiting drug SMIFH2 (4 h at 10 µM) showed an even stronger reduction, to 60 and 68%, respectively (Figure 2, B’ and F).
Therefore our data support the notion that PMS contains short actin filaments (Xu et al., 2013), and we propose that these filaments are accordingly high in number and therefore very dependent on actin nucleation. Of note, the alleles used here further suggest that PMS is fundamentally different from other actin networks: the profilin-deficient chic221 allele, which hardly affects PMS (Figure 3, D and G), causes severe shortening of filopodia (Gonçalves-Pimentel et al., 2011), whereas loss of nucleators clearly affects PMS but not the length of filopodia (Gonçalves-Pimentel et al., 2011).
PMS in axons of young, growing neurons appear less stable
It was reported for mammalian neurons that PMS are gradually established during the first days of development (Xu et al., 2013; D’Este et al., 2015). We therefore studied the developmental timeline and found a gradual increase in PMS abundance from 20% at 6 hours in vitro (HIV) to 82% at 10 DIV (Figure 4, A and C). However, PMS in early neurons displayed a larger average spacing of 197 ± 4 nm, with extreme cases reaching up to 300 nm distance between actin peaks, as is also reflected in an almost complete lack of information in averaged autocorrelation curves for these neurons (unpublished data). This is reminiscent of the irregularities observed in β-SpecS012 mutant neurons at 10 DIV (Figure 2, G and H) and might indicate structural immaturity.
FIGURE 4:

(A,B) Examples of PMS in axons of neurons at 6 HIV either untreated (A) or treated with 200 nM LatA for 1 h (B); asterisks indicate cell bodies, arrows the growth cones; framed areas are shown eightfold enlarged on the right (A’–B’’). Note that actin accumulations at growth cones and dotted actin accumulations along axons are strongly abolished in the LatA-treated example in B, whereas PMS are still visible. (C) Quantitative analysis of PMS abundance at different culture stages shows a gradual increase from 6 HIV to 10 DIV (data not normalized). (D) PMS abundance normalized to parallel control cultures in neurons at 8 HIV upon different pharmacological or genetic manipulations of actin and/or actin regulators as indicated; numbers in the bars are sample numbers (i.e., analyzed regions of interest), error bars represent SEM of independent experimental repeats (data for 3 DIV in C are based on only one technical repeat and therefore lack an error bar. p values were calculated using the Mann–Whitney rank sum test (n.s., p > 0.05; ***p < 0.001). Scale bar, 3 µm (A, B), 600 nm (A’–B’’).
We therefore studied whether young PMS might deviate from mature PMS in other ways and challenged them with some of the actin manipulations we used at 10 DIV (Figure 4D). In agreement with studies at 10 DIV, we found that neurons at 8 HIV displayed no changes in PMS abundance when depleted of profilin (chic221; 96 ± 0.5%) but a strong reduction in PMS abundance when treated for 4 h with 800 nM CytoD (38 ± 4.4%) when carrying the DAAMEx68 mutant allele (66 ± 8.6%) or the β-SpecS012 mutant (66 ± 8.5%). Therefore PMS in young axons seem to contain many short actin filaments in the process of being organized through spectrins. However, in contrast to old neurons, 4-h treatment of young Drosophila neurons with 200 nM LatA highly significantly reduced PMS abundance to 48%, suggesting that young PMS are more reliant on actin polymerization. To test whether PMS are nevertheless qualitatively different from other dynamic actin networks, we reduced LatA application to 1 h, which is time enough to effectively eliminate filopodia and actin patches along axon shafts (Figures 3, C and G, and 4B) but is insufficient to cause significant PMS loss (Figure 4, B and D).
To summarize our results so far, PMS in young, growing axons appears qualitatively the same but still undergoes structural maturation, displays a higher dependence on polymerization, and becomes gradually more abundant over a period of days. Our data suggest that 1) PMS contains short actin filaments that are high in number and particularly reliant on nucleation processes, 2) PMS requires adducin function likely to cap and stabilize the plus ends of actin filaments, and 3) PMS needs spectrin for the formation of robust and abundant periodic patterns. These results provide experimental support for the cortical model for PMS that was originally proposed based on image data (Xu et al., 2013). The consistency of our data with the original PMS model strongly suggests that the molecular structure of PMS is evolutionarily well conserved.
F-actin has MT-maintaining roles in axons
We explored the unknown yet potentially important roles of PMS or the cortical actin they represent (from now on referred to as PMS/cortical actin) in axons. Of interest, we observed that, compared with controls, axons of neurons treated with the actin-destabilizing drug CytoD showed frequent gaps in their MT arrays. There was a 4.5-fold increase in MT breaks or gaps upon 4-h treatment with 800 nM CytoD (4–8 HIV) and a ninefold increase when the CytoD dose was doubled to 1.6 µM (Figure 5, C and D). These gaps usually reflect unstable MTs and were previously reported to occur under strong MT-destabilizing conditions (Voelzmann et al., 2016b). Of importance, these effects of CytoD reverted when the drug was washed out during a 4-h period (red arrow in Figure 5D), suggesting that F-actin mediates some sustained and acutely acting function in MT maintenance. In parallel, we observed that the CytoD-treated neurons showed a significant trend to lose axons. Thus 29% of neurons (identified using the anti-ELAV antibody) tend to have no axon under normal conditions in our cultures. This number is moderately increased with low significance to 31% upon 4-h treatment with 800 nM CytoD but to 45% of neurons upon treatment with 1.6 µM CytoD for 4 h (Figure 6E).
FIGURE 5:

F-actin has MT stabilizing roles. (A–C) Primary wild-type neurons at 8 HIV stained with phalloidin for actin (magenta) and against tubulin (green), either untreated (wt) or treated with LatA or CytoD (asterisks, cell bodies; arrows, axon tips; arrowheads, MT gaps); images show gap phenotypes in C. (D) Quantification plotting axons with gaps normalized to 4-h DMSO-treated controls; note that washout of CytoD can revert the phenotype (red arrow; bar on its right shows that CytoD still has gap-inducing activity during the washout period) and that cotreatment with nocodazole (Noco) enhances the phenotype (highest bar); numbers in bars refer to analyzed neurons; all data were compared with DMSO controls via chi-squared analysis (n.s., p > 0.05, ***p < 0.001); for detailed data, see Supplemental Table S1, p. 3. Scale bar, 10 μm (A–C).
FIGURE 6:
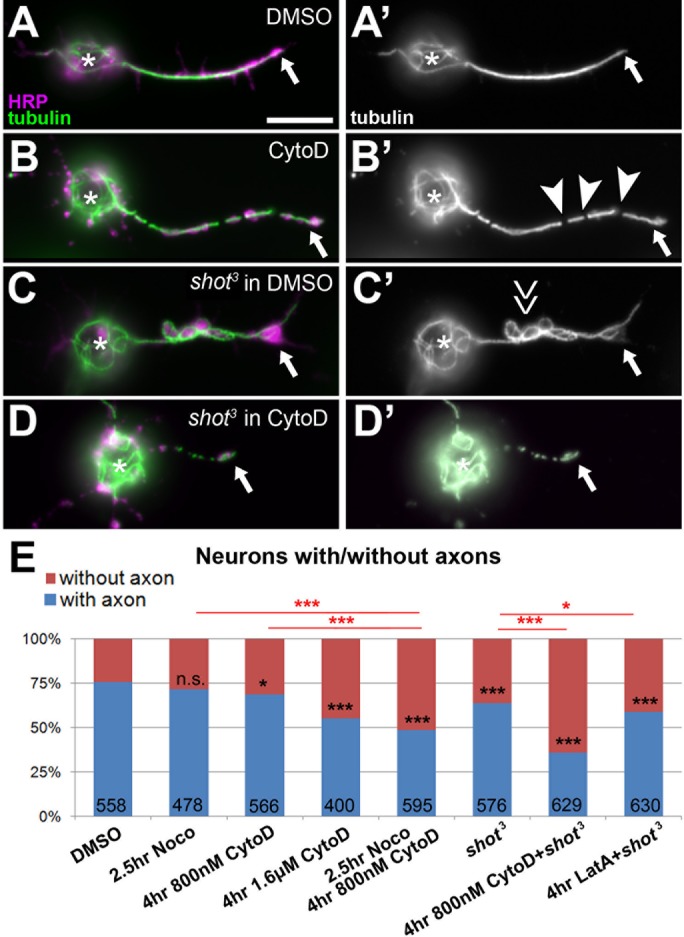
Combined loss of F-actin and Shot reduces axon numbers. (A–D’) Primary neurons at 8 HIV from wild-type (wt) or shot mutant embryos at 8 HIV treated for 4 h with either DMSO or CytoD as indicated on the left and stained for tubulin (green, white on right) and horseradish peroxidase (magenta). CytoD treatment alone causes gaps in the axonal tubulin staining (B; arrowheads, MT gaps); Shot deficiency causes MT disorganization (C; double arrow); and combination of shot with CytoD has a detrimental effect on axons (D). (E) Statistical analysis of neurons with/without axons; numbers in bars refer to analyzed neurons; all data were compared with DMSO controls via chi-squared analysis (n.s., p > 0.050; *p < 0.050, ***p < 0.001; for detailed data, see Supplemental Table S1, p. 2). Scale bar, 10 μm (A–D).
This dose-dependent impairment of axonal MTs, which can culminate even in complete failure to form or maintain axons, suggests that F-actin has MT-protecting roles in axons. To test this notion further, we combined CytoD treatment with conditions that directly destabilize MTs and asked whether this would dramatically increase gaps and/or axon loss. As a baseline, we used neurons treated with 800 nM CytoD for 4 h, which showed only mild phenotypes compared with dimethyl sulfoxide (DMSO)–treated control neurons (4.5 times more axons with tubulin gaps; 31% of neurons without axons; see previous paragraph). When neurons were treated first with 800 nM CytoD for 4 h (4–8 HIV) and then cotreated with 20 µM of the microtubule-destabilizing drug nocodazole for the last 2.5 h, the phenotypic defects almost doubled (5.5–8 HIV; nine times more axons with gaps; 51% of neurons lacked axons; Figures 5D and 6E). In contrast, treating neurons with this low dose of nocodazole alone caused no obvious increases in tubulin gaps or axon loss (Figures 5D and 6E; Sánchez-Soriano et al., 2009; Alves-Silva et al., 2012).
The effects of CytoD were similarly enhanced when MT stability was affected genetically by using the shot3 mutant allele to remove the MT-binding and -stabilizing spectraplakin protein Short stop (Shot; Yang et al., 1999; Alves-Silva et al., 2012). In agreement with earlier reports (Voelzmann et al., 2016b), CytoD treatment has a strong effect on axonal MTs in these neurons: when shot mutant neurons were treated for 4 h with CytoD (4–8 HIV at 800 nM), 64% of neurons lacked axons, which is about double the amount observed in CytoD-treated wild type (31%; see earlier discussion) or in untreated shot mutant neurons (36%; Figure 6, C–E). Therefore shot3 mutant neurons, in which MTs lack Shot-mediated protection, seem to benefit from parallel MT-maintaining functions of F-actin. In agreement with this conclusion, we found that shot3 mutant neurons display normal PMS abundance (Figure 2F).
In conclusion, F-actin appears to protect axonal MTs through a sustained, acutely acting mechanism, and the power of this stabilizing function becomes particularly apparent when MT networks are weakened via nocodazole application or genetic removal of MT-stabilizing proteins such as Shot. Our results led us to speculate that F-actin and Shot provide two independent, parallel mechanisms of MT stabilization. Of note, 4-h LatA treatments (not affecting PMS at 10 DIV; Figure 2F) show milder MT gap and axon retraction phenotypes than CytoD treatments (strongly affecting PMS), making it tempting to speculate that the F-actin fractions contributing to MT maintenance reside within PMS.
Cortical F-actin acutely promotes MT polymerization and acts in parallel to Shot
To understand how F-actin maintains MTs, we studied MT dynamics in axons upon drug application. We performed live imaging of EB1::GFP, which primarily localizes as comets at plus ends of actively polymerizing MTs (Figure 7, A and B, and Supplemental Movies S1 and S2; Alves-Silva et al., 2012).
FIGURE 7:

Live recordings of wild-type and shot-deficient primary neurons expressing EB1::GFP. (A, B) Stills of movies of neurons at 6 HIV taken at three time points (0, 30, and 60 min after treatment), where each still is a projection of four images 3 s apart and alternately colored green and magenta to indicate the movement of EB1::GFP comets; note that comets come to a halt and vanish only in shot-mutant neurons. Measurements of comet numbers (C, D, F, G) and velocities (E, H) of EB1::GFP comets in wild-type and shot3 mutant neurons upon treatment with 0.8 µM CytoD, 1.6 µM CytoD, or 200 nM LatA, as indicated in box at the bottom; velocity of wt is 0.154 µm/s ± 0.01 SEM; p values in C–H were calculated as explained in Materials and Methods; two-color code in p values of C and E indicates which curves were compared; for detailed data, see Supplemental Figure S1 and Table S1, p. 5. Scale bar, 5 μm.
We first treated wild-type neurons at 6 HIV or 3 DIV with 800 nM or 1.6 µM CytoD and measured the direct effect on the number and velocity of EB1::GFP comets (blue curves in Figure 7, C–E). Comet number was affected little or not at all by CytoD treatment at both culture stages (Figure 7, C and D), but at 6 HIV, the velocity of EB1 comets gradually decreased, and this effect was clearly dose dependent (Figure 7E). This decrease is likely to reflect reduced net polymerization of MTs and could explain the dose-dependent gaps observed via axonal tubulin staining in CytoD-treated wild-type neurons at that stage (Figures 5, C and D, and 6B). Similarly, application of LatA to wild-type neurons (blue lines in Figure 7, F–H) had no effect on comet number initially, but after 1 h, we observed a mild drop in comet velocity, in agreement with our observation that 1-h LatA treatment of young neurons has little effect on PMS abundance and axonal gaps but that effects are observed after 4-h treatment (Figures 4D and 5D). Therefore acute removal of PMS correlates with an acute reduction in MT polymerization.
These data for wild-type neurons reveal fairly mild effects. In contrast, the responses become very pronounced when the same experiments are repeated in shot3 mutant neurons (orange lines in Figure 7). Thus, upon application of CytoD to shot3 mutant neurons at either 6 HIV or 3 DIV, comets instantaneously changed from steady propagation to stalling behavior and then gradually faded away; these effects were enhanced when CytoD concentration was increased from 800 nM to 1.6 µM (Figure 7, C–E, and Supplemental Movie S2). Detailed image analyses revealed a significant loss of comet numbers and significant slowdown of comet speed in shot3 mutant neurons at all stages analyzed (Figure 7, C–E). In contrast, application of LatA to shot3 mutant neurons had no effect on comet number and velocity at 3 DIV, consistent with the fact that PMS are not affected under these conditions (Figure 7G). At 6 HIV, there seems to be a delayed drop in comet numbers and velocity in shot3 mutant neurons (Figure 7, F and H), which would be consistent with our observation of a delayed decrease in PMS abundance upon LatA application (Figures 2F and 4D).
These data further suggest a role for PMS/cortical actin in MT maintenance and the existence of a sustained mechanism downstream of PMS/cortical actin that acts by stabilizing MT polymerization or preventing its inhibition. The data also support our notion that Shot provides a parallel stabilizing mechanism that likewise sustains MT polymerization; both mechanisms seem to be able to compensate for each other.
Reduced PMS abundance correlates with changes in axonal MT organization
To analyze relations between PMS and MTs in a quantifiable manner, we used a further phenotype of shot3 mutant neurons, consisting of varicose regions of axons formed by disorganized MTs that are not arranged into bundles but curl up and criss-cross each other (Figure 8A; Sánchez-Soriano et al., 2009; Voelzmann et al., 2016a). Measurements of these areas are easy to perform and statistically robust across large neuron populations and we express them as the MT disorganization index (MDI; Materials and Methods). The MDI is measured most effectively at 6–8 HIV, still reliably in mature neurons up to ∼3 DIV, and increasingly unreliable at 10 DIV, when the total length of axons becomes difficult to determine within the densely grown axon networks (Figure 1, E and F).
FIGURE 8:

F-actin manipulations in shot-mutant neurons. (A–F’) The shot-mutant primary neurons at 8 HIV stained for tubulin (green) and actin (magenta) combined with different actin manipulations as indicated (asterisks, cell bodies; arrows, axon tips; arrowheads, areas of MT disorganization). (G, H) Quantification of MDI for neurons at 8 HIV (H) and 3 DIV (I); numbers in bars refer to neurons analyzed; all data normalized to shot; for detailed data, see Supplemental Figure S1. p values were calculated using the Mann–Whitney rank sum test (n.s., p > 0.05, ***p < 0.001). Scale bar, 10 μm (A–G’).
Using CytoD, we tested whether removal of PMS/cortical actin in shot3 mutant neurons affects the MDI and predicted a reduction due to the observed reduction in MT polymerization (Figure 7). When treated with 800 nM CytoD from 4 to 8 HIV, those neurons that retained an axon no longer showed disorganization (MDI = 0; all compared with untreated shot3 mutant neurons; Figure 8G), and axons often appeared very thin (Figure 6D). This means that either MTs in these axons become reorganized into bundles or they vanish, the latter being consistent with the overall loss of axons (Figure 6). At 3 DIV, 4-h treatment with 800 nM CytoD significantly reduced the MDI by 48% (Figure 8H). This phenotype is milder than at 8 HIV and might be explained by the fact that MT polymerization (the process most likely affected by combined loss of Shot and F-actin; Figure 7) is less frequent in old than in young neurons (8 HIV: 0.68 ± 0.05 comets/µm axon length; 3 DIV: 0.29 ± 0.04; n = 20, pMW < 0.0001). Therefore inhibiting MT polymerization at 3 DIV would be expected to have a lower effect on varicose areas.
LatA treatment of shot3 mutant neurons also revealed a correlation between MDI and PMS abundance (Figures 2 and 4): at 3 DIV, no significant MDI reduction was observed upon 4-h treatment with 200 nM LatA (Figures 8H and 2F); at 8 HIV, a preceding 1-h LatA treatment had no effect, but a 4-h treatment reduced MDI to 22% (Figures 8, C and G, and 4D). These MDI results at 8 HIV are paralleled by our observations in LatA-treated wild-type control neurons, in which MT gaps and axon loss were not very obvious after 1 h but became prominent after 4-h LatA treatment (Figures 5D and 6E), also suggesting that a reduction in MDI might involve loss of MTs.
We also found a correlation between MDI and PMS abundance when we analyzed neurons in which the shot3 mutant allele was combined with various mutations of actin regulators. For example, the shot3 SCARΔ37 double-mutant neurons showed a highly significant reduction in MDI at both 8 HIV and 3 DIV, correlating well with the significantly reduced PMS abundance observed in SCARΔ37 mutant neurons (Figures 2F, 4D, and 8, G and H). In contrast, shot3 chic221 double-mutant neurons showed no significant MDI reduction (Figure 8, B, G, and H), in agreement with the fact that the chic221 mutation does not affect PMS abundance (Figures 2, A and F, and 4D). Therefore these results also correlated well.
In total we analyzed the MDI in 16 different conditions in which drugs or actin-regulator mutations were combined with shot3 mutant background (Figure 8). We then plotted these MDI data (Figure 8) against the respective PMS abundance data obtained for wild-type neurons at 8 HIV and 10 DIV (Figures 2 and 4) and found a highly significant correlation between the presence/absence of PMS and high/low values for MDI (Figure 9B; Spearman r = 0.782, p = 0.0009; Supplemental Table S1, pp. 1 and 4). These correlations suggest that MT-regulating capacity is a function of the amount of PMS present in axons. Associating PMS with this function becomes even more convincing when one considers that filopodial readouts (representing long actin filament networks) are not at all correlated with MT phenotypes.
FIGURE 9:

Presence of cortical actin correlates with MDI values. (A) Roles of actin in MT stabilization (1; orange arrow; this work) and two independent roles of Shot in maintaining coalescent MT bundles (Alves-Silva et al., 2012): through MT/MT bundle stabilization (2; blue arrow) and guidance of polymerizing MTs into parallel bundles (3). Upon Shot deficiency, MTs become less stable and disorganized; upon PMS loss, MTs become less stable; and loss of both leads to MT disassembly and axon retraction (symbols explained in box below). (B) Correlation plot comparing degrees of PMS abundance (data from Figures 2 and 4) with degrees of MDI (data from Figure 8); all conditions are in combination with loss of Shot function (shot3 mutant allele in homozygosis); in each pairing, o indicates old neurons (3 or 10 DIV) and y indicates young neurons (6–8 HIV) with regard to PMS analysis (before slash) and MDI analysis (after slash); extreme phenotypes for PMS abundance and MDI are symbolized as explained in the inset.
DISCUSSION
Newly discovered roles for PMS/cortical actin in axonal MT maintenance
Axonal MT bundles provide the essential structural backbones and highways for life-sustaining transport in axons, and damage to these bundles seems to correlate with axonal decay (Adalbert and Coleman, 2012). Active maintenance, including constant polymerization and disassembly of MTs, is required to prevent decay through wear and tear, but hardly anything is known about these mechanisms (Voelzmann et al., 2016a). Here we report that axonal actin and the spectraplakin protein Shot have independent, complementary roles in regulating and maintaining MT polymerization in growing and mature axons, and we show that the combined absence of these mechanisms induces severe axon loss. Our data strongly suggest that the actin fraction responsible for this regulation is provided by PMS, because only in conditions in which PMS are affected do we observe MT defects, including gaps in tubulin staining, loss of MTs accompanied by axon retraction, inhibition of MT polymerization, and reduction in disorganized MTs (measured as MDI; Supplemental Figure S4).
Of these readouts, the MDI data were assessed quantitatively and revealed a tight correlation with PMS abundance, suggesting that MT regulatory mechanisms act as a function of the amount of PMS/cortical actin present in axons. We suggest that the process underlying MDI reduction is MT loss rather than MT reorganization. First, the size of areas with MT disorganization (expressed as MDI) tightly correlates with EB1::GFP comet numbers (Figure 7 and Supplemental Figure S3). Because each comet represents a single MT, the size of varicose areas seems to be a function of MT number and content. Second, severe loss of MDI occurs, together with loss of whole axons. Third, we know that combined loss of PMS and Shot causes loss of MT polymerization, providing a likely mechanism leading to MT gaps, loss of axons, and reduction in MDI. Unfortunately, direct measurements of MT numbers in axons are impossible at the light microscopic level (Mikhaylova et al., 2015) and will require high-pressure freezing electron microscopy as the best current method to provide high resolution combined with good preservation of all cell structures, including unstable MTs (McDonald, 2007).
Axon maintenance requires continued MT polymerization and disassembly to prevent senescence of MT bundles in axons (Voelzmann et al., 2016a). In this scenario, the roles of PMS/cortical actin in sustaining MT polymerization proposed here offer conceptually new potential explanations for brain disorders linked to gene mutations of cortical actin regulators: adducin (ADD3) is linked to human cerebral palsy (Kruer et al., 2013), β-spectrin to spinocerebellar ataxia (SPTBN2; Online Mendelian Inheritance in Man [OMIM] ID: 600224, 615386), ankyrin to mental retardation (ANK3; OMIM ID: 615493), and actin to Baraitser–Winter syndrome and dystonia with neurodegenerative traits (ACTB7; OMIM ID: 243310, 607371). Any of these pathologies could potentially relate to gradual MT bundle decay in axons through a reduction in MT polymerization and turnover. In support of our interpretation, Spectrin-deficient neurons were shown to display axon breakage in Caenorhabditis elegans (Hammarlund et al., 2007) and cause axonal transport defects coupled to neurodegeneration in Drosophila (Lorenzo et al., 2010), and loss of Drosophila adducin or spectrin causes synapse retraction in vivo (Pielage et al., 2005, 2011). Similarly, spectraplakins as the second important promoters of MT polymerization link to the neurodegenerative disorder type IV hereditary sensory and autonomic neuropathy (OMIM ID: 614653). Although a number of mechanisms have been proposed (Alves-Silva et al., 2012; Ferrier et al., 2013; Voelzmann et al., 2016a), weakening of the MT polymerization machinery might be a further mechanism underlying this disorder.
Of interest, the same manipulations that we used (shot mutant conditions in flies, CytoD treatment in mammalian neurons) activate the kinase DLK, which, in turn, promotes axon injury responses, including axon degeneration (Valakh et al., 2013). DLK might therefore be involved in axonal retraction observed in this work—for example, in response to MT stress caused by impaired MT polymerization.
Our finding that codepletion of F-actin and Shot causes axon loss also provides interesting new ideas about axon stump degeneration after injury. This event has been associated with an elevation of intracellular free calcium levels leading to calpain-mediated removal of actin-spectrin (Bradke et al., 2012). Of note, the same calcium events can be expected to trigger detachment of Shot/spectraplakins from MTs via binding to their C-terminal EF-hand motifs (Wu et al., 2011; Kapur et al., 2012; Ka et al., 2014). Therefore calcium can synchronously remove two essential MT-stabilizing mechanisms and should therefore cause axon retraction, as observed in our experiments.
Axonal PMS as a promising cell model for the study of cortical actin in neurons
The strategy we chose was to use SIM imaging, which provides slightly less resolution than STORM or STED but is fast and reliable and therefore ideally suited for quantitative analysis with very high sample numbers. This enabled us to apply a wide range of genetic and pharmacological manipulations and classify their affects using PMS abundance as readout. PMS abundance is a functionally relevant parameter, as can be deduced from its close correlation with parallel effects on MT bundles, MT dynamics, and even axon maintenance. However, it remains to be seen whether the regular repetitive pattern per se is relevant for MT maintenance or instead the mere presence of cortical F-actin. For example, the periodic arrangement of PMS could either be the outcome of active developmental mechanisms or the mere consequence of tubular axon morphology. Axons are cylinders that display longitudinal contraction (Bray, 1984; Siechen et al., 2009), potentially providing conditions under which diffusely cross-linked cortical actin networks could shuffle into linear, periodic patterns, as was similarly proposed for actin rings in tracheal tubes (Hannezo et al., 2015). If tubular structure is a key prerequisite for periodic actin arrangements, this would explain why dendritic and even neurite-like glial processes have actin rings (He et al., 2016).
Even if we still have to unravel the processes by which PMS are assembled, the mere existence of PMS provides powerful readouts for studying the regulation and function of cortical actin in neurons.
Future prospects
Here we propose an important role for PMS/cortical actin in MT maintenance with potential implications for neurodegenerative diseases linked to cortical actin factors. The challenge will be to find the mechanisms linking cortical actin networks to MT polymerization. This will not be a trivial task, given that MT polymerization is coordinated by a complex machinery that involves the regulation of tubulin supply, a large number of proteins associating with MT plus ends, and shaft-based mechanisms (Voelzmann et al., 2016a).
Apart from roles in MT maintenance, PMS/cortical actin might contribute to axon biology through further relevant mechanisms: 1) to guide polymerizing MTs into ordered parallel bundles, mediated by the spectraplakin actin–MT linkers (Sánchez-Soriano et al., 2009; Alves-Silva et al., 2012; Prokop et al., 2013), 2) to anchor the minus ends of MTs (Nashchekin et al., 2016; Ning et al., 2016), 3) to serve as anchors for dynein/dynactin-mediated sliding of MTs and transport of MT fragments (Myers et al., 2006), 4) to anchor and compartmentalize transmembrane proteins along axons (relevant for action potentials or the adhesion to ensheathing glia; Baines, 2010; Machnicka et al., 2014; Albrecht et al., 2016; Zhang et al., 2016), and 5) perhaps even to contribute to the regulation of collateral branching (Kalil and Dent, 2014). All of these functions can now be studied using PMS as powerful readouts and building on available concepts for the structure and function of cortical actin derived from this work and from studies in mammalian axons (see Introduction) or from nonneuronal systems such as erythrocytes (Baines, 2010).
MATERIALS AND METHODS
Fly stocks
All mutant alleles used in this study are well characterized. The following loss-of-function mutant alleles were used:
The Hu li tai shao/adducin loss-of-function mutant alleles hts1 and hts01103 are both strong hypomorphic alleles due to a transposable element insertion. They were isolated in two independent single P-element mutagenesis screens (Yue and Spradling, 1992; Spradling et al., 1999). Our experiments studying filopodial length were carried out with a 6-d preculture to deplete the maternal contribution (Sánchez-Soriano et al., 2010).
The α-Spectrin allele α-Specrg41 is a protein null allele caused by a 20–base pair deletion, resulting in a premature amber stop codon near the 5′ end of the coding region (Lee et al., 1993). Our staining with anti–α-spectrin antibody failed to detect any signal in α-Specrg41 mutant primary neurons (unpublished data; Hülsmeier et al., 2007).
The β-Spectrin allele β-SpecS012 is a protein null allele caused by nucleotide substitution C538T with reference to the 2291–amino acid isoform (Hülsmeier et al., 2007). Hemizygous β-SpecS012 mutant embryos lack detectable β-spectrin expression (Hülsmeier et al., 2007). Experiments studying filopodial length were carried out with a 6-d preculture to deplete the maternal contribution (Sánchez-Soriano et al., 2010).
The ankyrin2 null mutant allele ank2518 is a transposon insertion in intron 6 of the ank2 gene, causing the disruption of all three Ank2 isoforms (Pielage et al., 2008).
SCAR (homologue of human WASF1-3) and HEM-protein/Kette (homologue of human NCKAP1/NAP1) are essential components of the WAVE/SCAR complex required for Arp2/3-mediated nucleation in Drosophila neurons (Schenck et al., 2004). The mutant allele Hem03335 is a protein null caused by a P-element insertion 39 base pairs downstream of the putative transcription start site (Baumgartner et al., 1995; Schenck et al., 2004). The SCARΔ37 deletion is a protein null allele caused by imprecise P-element excision (Zallen et al., 2002; Schenck et al., 2004).
Arpc1/Sop2 is the homologue of the essential regulatory Arp2/3 subunit ARPC1B/p41. The mutant Arpc11 (=Sop21; from B. Baum, MRC Laboratory for Molecular Cell Biology, University College London) allele is caused by a 207–base pair genomic deletion that removes the last 62 codons of arpc1 (Hudson and Cooley, 2002).
DAAMEx68 is a null allele generated via imprecise P-element excision, resulting in deletion of the C-terminal 457 amino acids, including sequences corresponding to the DAD domain and most of the FH2 domain (Matusek et al., 2006).
The enabled mutant allele ena23 is caused by a nucleotide exchange introducing a STOP codon leading to a 52–amino acid C-terminal truncation that deletes the EVH2 domain required for tetramerization of Ena (Ahern-Djamali et al., 1998). In ena23 mutant embryos, anti-Ena staining (clone 5G2, mouse) is strongly reduced in primary neurons, the CNS, and tendon cells (Alves-Silva et al., 2008; Sánchez-Soriano et al., 2010; Gonçalves-Pimentel et al., 2011).
The chickadee/profilin mutant null allele chic221 is caused by an intragenic deletion removing 5′ noncoding and some of coding region of chic (Verheyen and Cooley, 1994; Wills et al., 1999); anti-chic staining (mouse, clone chi1J) is strongly reduced in chic221 mutant CNS and primary neurons (Gonçalves-Pimentel et al., 2011).
The two chemically induced short stop mutant alleles shot3 and shotsf20 are widely used and are the strongest available (likely null) alleles (Kolodziej et al., 1995; Prokop et al., 1998).
For live imaging with the UAS-eb1-GFP line (courtesy of P. Kolodziej, Vanderbilt University Medical Center, Nashville, TN; Sánchez-Soriano et al., 2010), we used the panneuronal driver line sca-Gal4 for experiments at 6–8 HIV (Sánchez-Soriano et al., 2010), and for experiments at >1 DIV, we used elav-Gal4 (chromosome 3) driver lines (Luo et al., 1994).
Green balancers used were Kr::GFP (Casso et al., 2000) and twi::GFP (Halfon et al., 2002).
Cell culture
Primary neuron cultures were generated following procedures described in detail in previous articles (Sánchez-Soriano et al., 2010; Prokop et al., 2012; Beaven et al., 2015). In brief, embryos were dechorionated using bleach, selected for the correct genotypes at about stage 11 using fluorescent balancer chromosomes (stages according to Campos-Ortega and Hartenstein, 1997), sterilized with ethanol, and mechanically crushed. The resulting cells were chemically dispersed and then washed in Schneider’s medium. They were either directly plated or kept in centrifuge tubes for 3–7 d before plating in order to deplete maternal protein product (preculture). In both cases, cells were plated at standard concentration onto glass coverslips that were either uncoated or coated with concanavalin A (ConA). Coverslips were kept on special incubation chambers, where cells were grown as hanging-drop cultures at 26°C. For analyses at the growth cone stage, cells were grown for 6–8 HIV on glass or ConA, which was extended to 20 HIV for precultured neurons (always on ConA). Mature neurons were analyzed at 3–10 d (always on ConA). To deplete maternal gene product, cells were precultured in Schneider’s medium in centrifuge tubes for up to 7 d before they were plated out as described.
For drug treatments, solutions were prepared in a cell culture medium from stock solutions in DMSO. Cells were treated with 200 nM LatA (Biomol International) for 1 or 4 HIV, 800 nM or 1.6 µM Cytochalasin D (Sigma-Aldrich) for 1 or 4 HIV, 20 µM nocodazole (Sigma-Aldrich) for 2.5 HIV, or 10 µM SMIFH2 (Sigma-Aldrich) for 4 HIV. For controls, equivalent concentrations of DMSO were diluted in Schneider’s medium.
Immunohistochemistry
Primary fly neurons were fixed in 4% paraformaldehyde (PFA) in 0.1 M phosphate-buffered saline (PBS; pH 6.8 or 7.2) for 30 min at room temperature and then washed three times in PBS with 0.3% Triton X-100 (PBT), followed by staining.
Antibody and actin staining and washes were performed in PBT using anti-tubulin (clone DM1A, mouse, 1:1000; Sigma-Aldrich; alternatively, clone YL1/2, rat, 1:500; Millipore Bioscience Research Reagents), anti–α-spectrin (clone 3A9, mouse, 1:200; Developmental Studies Hybridoma Bank, University of Iowa, Iowa City, IA [DSHB]), anti-Elav (clone 7E8A10, rat, 1:1000; DSHB), anti-synaptotagmin, fluorescein isothiocyanate (FITC)–, Cy3-, or Cy5-conjugated secondary antibodies (donkey, purified, 1:200; Jackson ImmunoResearch), and tetramethylrhodamine isothiocyanate/Alexa 647- and FITC-conjugated phalloidin (1:200; Invitrogen and Sigma-Aldrich). Specimens were embedded in Vectashield.
For STED and SIM, cells were cultured for 8 HIV or up to 10 DIV at 26°C on ConA-coated, 35-mm, glass-bottom MatTek dishes (P35G-0.170–14-C). Cells were fixed with 4% PFA, washed three times in PBT, and then stored for transport in PBS sealed with Parafilm. Before imaging, cells were incubated for 1 h with 2 µM SiR-actin in PBS (Spirochrome; Lukinavičius et al., 2014) and then washed once with PBS.
Microscopy
SIM was performed with an Elyra PS1 microscope (Zeiss) with a 100× oil immersion objective lens (numerical aperture [NA] 1.46) and 642-nm diode laser. Raw images were acquired with three or five grating angles.
STED was performed using a Leica SP8 gated STED microscope with a 100× oil immersion objective lens (NA 1.40), 640-nm excitation, and 775-nm depletion.
Standard images were taken with a 100×/NA 1.30 oil iris Ph3 8/0.17 objective (plus 1.6× Optovar) on an Olympus BX50WI microscope with filter sets suitable for FITC, Cy3, and Cy5 and equipped with a AxioCam camera (Zeiss). The 2012 software (blue edition, Zeiss) was used to acquire images.
Time-lapse live imaging of Eb1::GFP-expressing cultured neurons was performed on standard ConA-coated coverslips under temperature-controlled conditions (26°C) on a Delta Vision RT (Applied Precision) restoration microscope with a 100×/NA 1.3 Ph3 Uplan Fl phase objective, Sedat filter set (Chroma 89000), and a CoolSNAP HQ (Photometrics) camera. Images were taken every 4 s for 2–3 min with exposure times of 0.5–1 s and were constructed into movies automatically.
To observe the effect of CytoD treatment on axon retraction, Eb1::GFP-expressing primary neurons were cultured on 35-mm glass-bottom MatTek dishes. About 10 cells per slide were filmed one-by-one for 2 min before 800 nM or 1.6 µM CytoD was applied and then were revisited for further imaging at 0 h, 0.5 HIV, 1 h, 1.5 HIV, and 2 HIV after application.
Data analysis
The relative abundance of PMS was assessed on randomly chosen SIM images containing axons of SiR-actin–stained primary neuronal cultures, achieving sample numbers usually >300. These were taken from four independent culture preparations obtained from at least two independent experimental repeats performed on different days. From each single culture preparation, a minimum of 20 SIM images was obtained, and in each image, all neurite segments of >6 µm length were counted. Generally, these neurite segments showed a consistent presence or absence of PMS all along. To avoid bias, image analyses were performed blindly, that is, the genotype or treatment of specimens was masked.
We can be certain that analyzed neurites represent axons. Thus dendrites in our culture system are located on neuronal cell bodies but develop sparsely when analyzed at 3 DIV (Sánchez-Soriano et al., 2005). We found the same for cultures at 10 DIV, where only 15% of somata display short processes (5.8 ± 0.8 µm), which lack the presynaptic marker synaptotagmin typically found only in axons. Therefore, by choosing neurites of >6 µm length located at sufficient distance from cell bodies, we are confident that all images represent axonal segments.
Filopodial lengths were measured using the segmented line tool in ImageJ. We included filopodia along axon shafts and at growth cones but excluded those on cell bodies.
MT disorganization was assessed as MDI, as first published here: the area of disorganization was measured using the freehand selection in ImageJ. This value was then divided by axon length (measured using the segmented line tool in ImageJ) multiplied by 0.5 µm (typical axon diameter), that is, approximating the axon area without disorganization.
To assess frequencies of neurons with axons (Figure 3), we double-stained primary neurons for tubulin and the neuron-specific nuclear protein Elav (Robinow and White, 1991). With the definition of an axon as a tubulin-stained process longer than the diameter of the soma (Gonçalves-Pimentel et al., 2011), 76% of Elav-positive neurons display an axon in wild-type control cultures.
To assess frequencies of gaps in axons, relative numbers of primary neurons were counted where anti-tubulin along axons was discontinuous, that is, displayed gaps (Figure 3; Alves-Silva et al., 2012).
EB1::GFP live analyses upon actin drug treatments were performed as described previously (Alves-Silva et al., 2012). To measure speed, EB1 comets were tracked manually using the “manual tracking” plug-in of ImageJ. To analyze the number of comets, EB1 spots within an axon region of interest were counted over the whole captured time period at each of the different time points (5, 30, 60, 90, and 120 min after drug application), and the means of these comet numbers per axon region and time point were normalized to the mean of comet numbers in this same region before drug treatment. For each time point and treatment, 6–14 different axons were analyzed. Error bars in the graphs (Figure 6, C–H) indicate SEM of normalized data of all axons for each time point.
For all analyses, GraphPad Prism 5 was used to calculate the mean and SEM, and perform statistical tests using the Mann–Whitney U test or chi-squared test.
To generate the average autocorrelation curves (Figure 1E), intensity profiles were extracted from typical axon images using ImageJ and then analyzed using Mathematica 10.2. The autocorrelation function R (τ, xi) at a lag of τ for an equally spaced ni point data series,  , is given by
 |
where  is the mean of xi. For each profile, the autocorrelation function is calculated, and these are then weighted by the length of the profile to give an average autocorrelation function,
 |
where N is the total number of profiles being averaged over.
To compare the autocorrelation curves between different conditions, we performed Mann–Whitney tests on the magnitudes at each point and then applied the generalized Fisher method with correlation to estimate an overall p value using the CombinePValue package (Dai et al., 2014) in the statistical programming language R. A resampling method was used to estimate the correlation between p values, subsampling 10 of the correlation curves for both conditions 2000 times, and the mean of 50 estimations is presented.
For the statistical analysis of live imaging data in Figure 7, we used a mixed-effects model with independent random effects to fit to the time-series data, using the R packages lme4 to fit the model (Bates et al., 2015) and lmerTest to calculate the p values (Kuznetsova et al., 2016).
Supplementary Material
Acknowledgments
We thank Christopher Tynan for support with STED imaging, Andre Voelzmann, Natalia Sánchez-Soriano, and Tom Millard for helpful comments on the manuscript, and many colleagues and the Bloomington Drosophila Stock Center (National Institutes of Health P40OD018537) for kindly providing stocks and materials. This work was made possible through funding by the Biotechnology and Biological Sciences Research Council (BBSRC) (BB/L000717/1, BB/M007553/1) to A.P., as well as support by parents and Manchester's Faculty of Life Sciences (now Faculty of Biology, Medicine and Health) to Y.Q. and a Leverhulme Early Career Fellowship to S.P.P. Microscopes at the Bioimaging Facility in Manchester were purchased with grants from the Biotechnology and Biological Sciences Research Council, the Wellcome Trust, and the University of Manchester Strategic Fund, and the Fly Facility is supported by funds from the University of Manchester and the Wellcome Trust (087742/Z/08/Z). Structured illumination and STED microscopes at the Research Complex at Harwell were funded by the Medical Research Council (MR/K015591/1) and the BBSRC (BB/L014327/1), and imaging time was made possible through three successive grants by the Science and Technology Facilities Council to A.P.
Abbreviations used:
- CytoD
cytochalasin D
- DIV
days in vitro
- F-actin
filamentous actin
- HIV
hours in vitro
- LatA
latrunculin A
- MDI
microtubule disorganization index
- MTs
microtubules
- SIM
structured illumination microscopy
- STED
stimulated emission depletion microscopy
- STORM
stochastic optical reconstruction microscopy
Footnotes
†These authors contributed equally to this work.
This article was published online ahead of print in MBoC in Press (http://www.molbiolcell.org/cgi/doi/10.1091/mbc.E16-10-0727) on November 23, 2016.
REFERENCES
- Adalbert R, Coleman MP. Axon pathology in age-related neurodegenerative disorders. Neuropathol Appl Neurobiol. 2012;39:90–108. doi: 10.1111/j.1365-2990.2012.01308.x. [DOI] [PubMed] [Google Scholar]
- Ahern-Djamali SM, Comer AR, Bachmann C, Kastenmeier AS, Reddy SK, Beckerle MC, Walter U, Hoffmann FM. Mutations in Drosophila enabled and rescue by human vasodilator-stimulated phosphoprotein (VASP) indicate important functional roles for Ena/VASP homology domain 1 (EVH1) and EVH2 domains. Mol Biol Cell. 1998;9:2157–2171. doi: 10.1091/mbc.9.8.2157. [DOI] [PMC free article] [PubMed] [Google Scholar]
- Albrecht D, Winterflood CM, Sadeghi M, Tschager T, Noé F, Ewers H. Nanoscopic compartmentalization of membrane protein motion at the axon initial segment. J Cell Biol. 2016;215:37–46. doi: 10.1083/jcb.201603108. [DOI] [PMC free article] [PubMed] [Google Scholar]
- Alves-Silva J, Hahn I, Huber O, Mende M, Reissaus A, Prokop A. Prominent actin fibre arrays in Drosophila tendon cells represent architectural elements different from stress fibres. Mol Biol Cell. 2008;19:4287–4297. doi: 10.1091/mbc.E08-02-0182. [DOI] [PMC free article] [PubMed] [Google Scholar]
- Alves-Silva J, Sánchez-Soriano N, Beaven R, Klein M, Parkin J, Millard T, Bellen H, Venken KJT, Ballestrem C, Kammerer RA, Prokop A. Spectraplakins promote microtubule-mediated axonal growth by functioning as structural microtubule-associated proteins and EB1-dependent +TIPs (tip interacting proteins) J Neurosci. 2012;32:9143–9158. doi: 10.1523/JNEUROSCI.0416-12.2012. [DOI] [PMC free article] [PubMed] [Google Scholar]
- Baines AJ. The spectrin-ankyrin-4.1-adducin membrane skeleton: adapting eukaryotic cells to the demands of animal life. Protoplasma. 2010;244:99–131. doi: 10.1007/s00709-010-0181-1. [DOI] [PubMed] [Google Scholar]
- Bates D, Mächler M, Bolker B, Walker S. Fitting linear mixed-effects models using lme4. J Stat Softw. 2015;67:48. [Google Scholar]
- Baumgartner S, Martin D, Chiquet-Ehrismann R, Sutton J, Desai A, Huang I, Kato K, Hromas R. The HEM proteins: a novel family of tissue-specific transmembrane proteins expressed from invertebrates through mammals with an essential function in oogenesis. J Mol Biol. 1995;251:41–49. doi: 10.1006/jmbi.1995.0414. [DOI] [PubMed] [Google Scholar]
- Bear JE, Gertler FB. ENA/VASP: towards resolving a pointed controversy at the barbed end. J Cell Sci. 2009;122:1947–1953. doi: 10.1242/jcs.038125. [DOI] [PMC free article] [PubMed] [Google Scholar]
- Beaven R, Dzhindzhev NS, Qu Y, Hahn I, Dajas-Bailador F, Ohkura H, Prokop A. Drosophila CLIP-190 and mammalian CLIP-170 display reduced microtubule plus end association in the nervous system. Mol Biol Cell. 2015;26:1491–1508. doi: 10.1091/mbc.E14-06-1083. [DOI] [PMC free article] [PubMed] [Google Scholar]
- Bloch RJ, Morrow JS. An unusual beta-spectrin associated with clustered acetylcholine (ACh) receptors. J Cell Biol. 1989;108:481–493. doi: 10.1083/jcb.108.2.481. [DOI] [PMC free article] [PubMed] [Google Scholar]
- Bradke F, Fawcett JW, Spira ME. Assembly of a new growth cone after axotomy: the precursor to axon regeneration. Nat Rev Neurosci. 2012;13:183–193. doi: 10.1038/nrn3176. [DOI] [PubMed] [Google Scholar]
- Bray D. Axonal growth in response to experimentally applied mechanical tension. Dev Biol. 1984;102:379–389. doi: 10.1016/0012-1606(84)90202-1. [DOI] [PubMed] [Google Scholar]
- Campos-Ortega JA, Hartenstein V. The Embryonic Development of Drosophila melanogaster. Berlin: Springer-Verlag; 1997. [Google Scholar]
- Casso D, Ramirez-Weber F, Kornberg TB. GFP-tagged balancer chromosomes for Drosophila melanogaster. Mech Dev. 2000;91:451–454. doi: 10.1016/s0925-4773(00)00248-3. [DOI] [PubMed] [Google Scholar]
- Dai H, Leeder JS, Cui Y. A modified generalized Fisher method for combining probabilities from dependent tests. Front Genet. 2014;5:32. doi: 10.3389/fgene.2014.00032. [DOI] [PMC free article] [PubMed] [Google Scholar]
- D’Este E, Kamin D, Göttfert F, El-Hady A, Hell SW. STED nanoscopy reveals the ubiquity of subcortical cytoskeleton periodicity in living neurons. Cell Rep. 2015;10:1246–1251. doi: 10.1016/j.celrep.2015.02.007. [DOI] [PubMed] [Google Scholar]
- Ferrier A, Boyer JG, Kothary R. Cellular and molecular biology of neuronal dystonin. Int Rev Cell Mol Biol. 2013;300:85–120. doi: 10.1016/B978-0-12-405210-9.00003-5. [DOI] [PubMed] [Google Scholar]
- Flynn KC, Pak CW, Shaw AE, Bradke F, Bamburg JR. Growth cone-like waves transport actin and promote axonogenesis and neurite branching. Dev Neurobiol. 2009;69:761–779. doi: 10.1002/dneu.20734. [DOI] [PMC free article] [PubMed] [Google Scholar]
- Galiano MR, Jha S, Ho TS, Zhang C, Ogawa Y, Chang KJ, Stankewich MC, Mohler PJ, Rasband MN. A distal axonal cytoskeleton forms an intra-axonal boundary that controls axon initial segment assembly. Cell. 2012;149:1125–1139. doi: 10.1016/j.cell.2012.03.039. [DOI] [PMC free article] [PubMed] [Google Scholar]
- Ganguly A, Tang Y, Wang L, Ladt K, Loi J, Dargent B, Leterrier C, Roy S. A dynamic formin-dependent deep F-actin network in axons. J Cell Biol. 2015;210:401–417. doi: 10.1083/jcb.201506110. [DOI] [PMC free article] [PubMed] [Google Scholar]
- Garbe DS, Das A, Dubreuil RR, Bashaw GJ. beta-Spectrin functions independently of Ankyrin to regulate the establishment and maintenance of axon connections in the Drosophila embryonic CNS. Development. 2007;134:273–284. doi: 10.1242/dev.02653. [DOI] [PubMed] [Google Scholar]
- Gonçalves-Pimentel C, Gombos R, Mihály J, Sánchez-Soriano N, Prokop A. Dissecting regulatory networks of filopodia formation in a Drosophila growth cone model. PLoS One. 2011;6:e18340. doi: 10.1371/journal.pone.0018340. [DOI] [PMC free article] [PubMed] [Google Scholar]
- Halfon MS, Gisselbrecht S, Lu J, Estrada B, Keshishian H, Michelson AM. New fluorescent protein reporters for use with the Drosophila Gal4 expression system and for vital detection of balancer chromosomes. Genesis. 2002;34:135–138. doi: 10.1002/gene.10136. [DOI] [PubMed] [Google Scholar]
- Hammarlund M, Jorgensen EM, Bastiani MJ. Axons break in animals lacking beta-spectrin. J Cell Biol. 2007;176:269–275. doi: 10.1083/jcb.200611117. [DOI] [PMC free article] [PubMed] [Google Scholar]
- Hannezo E, Dong B, Recho P, Joanny JF, Hayashi S. Cortical instability drives periodic supracellular actin pattern formation in epithelial tubes. Proc Natl Acad Sci USA. 2015;112:8620–8625. doi: 10.1073/pnas.1504762112. [DOI] [PMC free article] [PubMed] [Google Scholar]
- He J, Zhou R, Wu Z, Carrasco M, Kurshan P, Farley J, Simon D, Wang G, Han B, Hao J, et al. Prevalent presence of periodic actin-spectrin-based membrane skeleton in a broad range of neuronal cell types and animal species. Proc Natl Acad Sci USA. 2016;113:6029–6034. doi: 10.1073/pnas.1605707113. [DOI] [PMC free article] [PubMed] [Google Scholar]
- Hudson AM, Cooley L. A subset of dynamic actin rearrangements in Drosophila requires the Arp2/3 complex. J Cell Biol. 2002;156:677–687. doi: 10.1083/jcb.200109065. [DOI] [PMC free article] [PubMed] [Google Scholar]
- Hülsmeier J, Pielage J, Rickert C, Technau GM, Klämbt C, Stork T. Distinct functions of alpha-spectrin and beta-spectrin during axonal pathfinding. Development. 2007;134:713–722. doi: 10.1242/dev.02758. [DOI] [PubMed] [Google Scholar]
- Ka M, Jung EM, Mueller U, Kim WY. MACF1 regulates the migration of pyramidal neurons via microtubule dynamics and GSK-3 signaling. Dev Biol. 2014;395:4–18. doi: 10.1016/j.ydbio.2014.09.009. [DOI] [PMC free article] [PubMed] [Google Scholar]
- Kalil K, Dent EW. Branch management: mechanisms of axon branching in the developing vertebrate CNS. Nat Rev Neurosci. 2014;15:7–18. doi: 10.1038/nrn3650. [DOI] [PMC free article] [PubMed] [Google Scholar]
- Kapur M, Wang W, Maloney MT, Millan I, Lundin VF, Tran TA, Yang Y. Calcium tips the balance: a microtubule plus end to lattice binding switch operates in the carboxyl terminus of BPAG1n4. EMBO Rep. 2012;13:1021–1029. doi: 10.1038/embor.2012.140. [DOI] [PMC free article] [PubMed] [Google Scholar]
- Kolodziej PA, Jan LY, Jan YN. Mutations that affect the length, fasciculation, or ventral orientation of specific sensory axons in the Drosophila embryo. Neuron. 1995;15:273–286. doi: 10.1016/0896-6273(95)90033-0. [DOI] [PubMed] [Google Scholar]
- Kruer MC, Jepperson T, Dutta S, Steiner RD, Cottenie E, Sanford L, Merkens M, Russman BS, Blasco PA, Fan G, et al. Mutations in gamma adducin are associated with inherited cerebral palsy. Ann Neurol. 2013;74:805–814. doi: 10.1002/ana.23971. [DOI] [PMC free article] [PubMed] [Google Scholar]
- Kuznetsova A, Brockhoff PB, Christensen RHB. lmerTest: tests in linear mixed effects models. 2016. R package version 2.0–32. Available at http://CRAN.R-project.org/package=lmerTest.
- Lee JK, Coyne RS, Dubreuil RR, Goldstein LS, Branton D. Cell shape and interaction defects in alpha-spectrin mutants of Drosophila melanogaster. J Cell Biol. 1993;123:1797–1809. doi: 10.1083/jcb.123.6.1797. [DOI] [PMC free article] [PubMed] [Google Scholar]
- Leite SC, Sampaio P, Sousa VF, Nogueira-Rodrigues J, Pinto-Costa R, Peters , Luanne L, Brites P, Sousa , Mónica M. The actin-binding protein α-Adducin is required for maintaining axon diameter. Cell Rep. 2016;15:490–498. doi: 10.1016/j.celrep.2016.03.047. [DOI] [PMC free article] [PubMed] [Google Scholar]
- Li X, Kumar Y, Zempel H, Mandelkow EM, Biernat J, Mandelkow E. Novel diffusion barrier for axonal retention of Tau in neurons and its failure in neurodegeneration. EMBO J. 2011;30:4825–4837. doi: 10.1038/emboj.2011.376. [DOI] [PMC free article] [PubMed] [Google Scholar]
- Lorenzo DN, Li MG, Mische SE, Armbrust KR, Ranum LP, Hays TS. Spectrin mutations that cause spinocerebellar ataxia type 5 impair axonal transport and induce neurodegeneration in Drosophila. J Cell Biol. 2010;189:143–158. doi: 10.1083/jcb.200905158. [DOI] [PMC free article] [PubMed] [Google Scholar]
- Lukinavicˇius G, Reymond L, D’Este E, Masharina A, Göttfert F, Ta H, Güther A, Fournier M, Rizzo S, Waldmann H, et al. Fluorogenic probes for live-cell imaging of the cytoskeleton. Nat Methods. 2014;11:731–733. doi: 10.1038/nmeth.2972. [DOI] [PubMed] [Google Scholar]
- Luo L, Liao YJ, Jan LY, Jan YN. Distinct morphogenetic functions of similar small GTPases: Drosophila Drac1 is involved in axonal outgrowth and myoblast fusion. Genes Dev. 1994;8:1787–1802. doi: 10.1101/gad.8.15.1787. [DOI] [PubMed] [Google Scholar]
- Machnicka B, Czogalla A, Hryniewicz-Jankowska A, Boguslawska DM, Grochowalska R, Heger E, Sikorski AF. Spectrins: a structural platform for stabilization and activation of membrane channels, receptors and transporters. Biochim Biophys Acta. 2014;1838:620–634. doi: 10.1016/j.bbamem.2013.05.002. [DOI] [PubMed] [Google Scholar]
- Matusek T, Djiane A, Jankovics F, Brunner D, Mlodzik M, Mihaly J. The Drosophila formin DAAM regulates the tracheal cuticle pattern through organizing the actin cytoskeleton. Development. 2006;133:957–966. doi: 10.1242/dev.02266. [DOI] [PubMed] [Google Scholar]
- McDonald K. Cryopreparation methods for electron microscopy of selected model systems. Methods Cell Biol. 2007;79:23–56. doi: 10.1016/S0091-679X(06)79002-1. [DOI] [PubMed] [Google Scholar]
- Mikhaylova M, Cloin BM, Finan K, van den Berg R, Teeuw J, Kijanka MM, Sokolowski M, Katrukha EA, Maidorn M, Opazo F, et al. Resolving bundled microtubules using anti-tubulin nanobodies. Nat Commun. 2015;6:7933. doi: 10.1038/ncomms8933. [DOI] [PMC free article] [PubMed] [Google Scholar]
- Myers KA, He Y, Hasaka TP, Baas PW. Microtubule transport in the axon: Re-thinking a potential role for the actin cytoskeleton. Neuroscientist. 2006;12:107–118. doi: 10.1177/1073858405283428. [DOI] [PubMed] [Google Scholar]
- Nashchekin D, Fernandes AR, St Johnston D. Patronin/Shot cortical foci assemble the noncentrosomal microtubule array that specifies the Drosophila anterior-posterior axis. Dev Cell. 2016;38:61–72. doi: 10.1016/j.devcel.2016.06.010. [DOI] [PMC free article] [PubMed] [Google Scholar]
- Ning W, Yu Y, Xu H, Liu X, Wang D, Wang J, Wang Y, Meng W. The CAMSAP3-ACF7 complex couples noncentrosomal microtubules with actin filaments to coordinate their dynamics. Dev Cell. 2016;39:61–74. doi: 10.1016/j.devcel.2016.09.003. [DOI] [PubMed] [Google Scholar]
- Peterson JR, Mitchison TJ. Small molecules, big impact: a history of chemical inhibitors and the cytoskeleton. Chem Biol. 2002;9:1275–1285. doi: 10.1016/s1074-5521(02)00284-3. [DOI] [PubMed] [Google Scholar]
- Pielage J, Bulat V, Zuchero JB, Fetter RD, Davis GW. Hts/Adducin controls synaptic elaboration and elimination. Neuron. 2011;69:1114–1131. doi: 10.1016/j.neuron.2011.02.007. [DOI] [PMC free article] [PubMed] [Google Scholar]
- Pielage J, Cheng L, Fetter RD, Carlton PM, Sedat JW, Davis GW. A presynaptic giant ankyrin stabilizes the NMJ through regulation of presynaptic microtubules and transsynaptic cell adhesion. Neuron. 2008;58:195–209. doi: 10.1016/j.neuron.2008.02.017. [DOI] [PMC free article] [PubMed] [Google Scholar]
- Pielage J, Fetter RD, Davis GW. Presynaptic spectrin is essential for synapse stabilization. Curr Biol. 2005;15:918–928. doi: 10.1016/j.cub.2005.04.030. [DOI] [PubMed] [Google Scholar]
- Pielage J, Fetter RD, Davis GW. A postsynaptic spectrin scaffold defines active zone size, spacing, and efficacy at the Drosophila neuromuscular junction. J Cell Biol. 2006;175:491–503. doi: 10.1083/jcb.200607036. [DOI] [PMC free article] [PubMed] [Google Scholar]
- Prokop A. The intricate relationship between microtubules and their associated motor proteins during axon growth and maintenance. Neur Dev. 2013;8:17. doi: 10.1186/1749-8104-8-17. [DOI] [PMC free article] [PubMed] [Google Scholar]
- Prokop A, Beaven R, Qu Y, Sánchez-Soriano N. Using fly genetics to dissect the cytoskeletal machinery of neurons during axonal growth and maintenance. J Cell Sci. 2013;126:2331–2341. doi: 10.1242/jcs.126912. [DOI] [PubMed] [Google Scholar]
- Prokop A, Küppers-Munther B, Sánchez-Soriano N. Using primary neuron cultures of Drosophila to analyze neuronal circuit formation and function. In: Hassan BA, editor. The Making and Un-Making of Neuronal Circuits in Drosophila. New York: Humana Press; 2012. pp. 225–247. [Google Scholar]
- Prokop A, Uhler J, Roote J, Bate MC. The kakapo mutation affects terminal arborisation and central dendritic sprouting of Drosophila motorneurons. J Cell Biol. 1998;143:1283–1294. doi: 10.1083/jcb.143.5.1283. [DOI] [PMC free article] [PubMed] [Google Scholar]
- Pumplin DW. The membrane skeleton of ACh receptor domains in rat myotubes contains antiparallel homodimers of beta-spectrin in filaments quantitatively resembling those of erythrocytes. J Cell Sci. 1995;108:3145–3154. doi: 10.1242/jcs.108.9.3145. [DOI] [PubMed] [Google Scholar]
- Rasband MN. The axon initial segment and the maintenance of neuronal polarity. Nat Rev Neurosci. 2010;11:552–562. doi: 10.1038/nrn2852. [DOI] [PubMed] [Google Scholar]
- Robinow S, White K. Characterization and spatial distribution of the Elav protein during Drosophila melanogaster development. J Neurobiol. 1991;22:443–461. doi: 10.1002/neu.480220503. [DOI] [PubMed] [Google Scholar]
- Sánchez-Soriano N, Gonçalves-Pimentel C, Beaven R, Haessler U, Ofner L, Ballestrem C, Prokop A. Drosophila growth cones: a genetically tractable platform for the analysis of axonal growth dynamics. Dev Neurobiol. 2010;70:58–71. doi: 10.1002/dneu.20762. [DOI] [PubMed] [Google Scholar]
- Sánchez-Soriano N, Löhr R, Bottenberg W, Haessler U, Kerassoviti A, Knust E, Fiala A, Prokop A. Are dendrites in Drosophila homologous to vertebrate dendrites. Dev Biol. 2005;288:126–138. doi: 10.1016/j.ydbio.2005.09.026. [DOI] [PubMed] [Google Scholar]
- Sánchez-Soriano N, Travis M, Dajas-Bailador F, Goncalves-Pimentel C, Whitmarsh AJ, Prokop A. Mouse ACF7 and Drosophila Short stop modulate filopodia formation and microtubule organization during neuronal growth. J Cell Sci. 2009;122:2534–2542. doi: 10.1242/jcs.046268. [DOI] [PMC free article] [PubMed] [Google Scholar]
- Schenck A, Qurashi A, Carrera P, Bardoni B, Diebold C, Schejter E, Mandel JL, Giangrande A. WAVE/SCAR, a multifunctional complex coordinating different aspects of neuronal connectivity. Dev Biol. 2004;274:260–270. doi: 10.1016/j.ydbio.2004.07.009. [DOI] [PubMed] [Google Scholar]
- Siechen S, Yang S, Chiba A, Saif T. Mechanical tension contributes to clustering of neurotransmitter vesicles at presynaptic terminals. Proc Natl Acad Sci USA. 2009;106:12611–12616. doi: 10.1073/pnas.0901867106. [DOI] [PMC free article] [PubMed] [Google Scholar]
- Smith DH, Nonaka M, Miller R, Leoni M, Chen XH, Alsop D, Meaney DF. Immediate coma following inertial brain injury dependent on axonal damage in the brainstem. J Neurosurg. 2000;93:315–322. doi: 10.3171/jns.2000.93.2.0315. [DOI] [PubMed] [Google Scholar]
- Spradling AC, Stern D, Beaton A, Rhem EJ, Laverty T, Mozden N, Misra S, Rubin GM. The Berkeley Drosophila genome project gene disruption project. Single P-element insertions mutating 25% of vital Drosophila genes. Genetics. 1999;153:135–177. doi: 10.1093/genetics/153.1.135. [DOI] [PMC free article] [PubMed] [Google Scholar]
- Valakh V, Walker LJ, Skeath JB, Diantonio A. Loss of the spectraplakin Short stop activates the DLK injury response pathway in Drosophila. J Neurosci. 2013;33:17863–17873. doi: 10.1523/JNEUROSCI.2196-13.2013. [DOI] [PMC free article] [PubMed] [Google Scholar]
- Verheyen EM, Cooley L. Profilin mutations disrupt multiple actin-dependent processes during Drosophila development. Development. 1994;120:717–728. doi: 10.1242/dev.120.4.717. [DOI] [PubMed] [Google Scholar]
- Voelzmann A, Hahn I, Pearce S, Sánchez-Soriano NP, Prokop A. A conceptual view at microtubule plus end dynamics in neuronal axons. Brain Res Bull. 2016a;126:226–237. doi: 10.1016/j.brainresbull.2016.08.006. [DOI] [PMC free article] [PubMed] [Google Scholar]
- Voelzmann A, Okenve-Ramos P, Qu Y, Chojnowska-Monga M, del Caño-Espinel M, Prokop A, Sánchez-Soriano N. Tau and spectraplakins promote synapse formation and maintenance through Jun kinase and neuronal trafficking. Elife. 2016b;5:e14694. doi: 10.7554/eLife.14694. [DOI] [PMC free article] [PubMed] [Google Scholar]
- Watanabe K, Al-Bassam S, Miyazaki Y, Wandless TJ, Webster P, Arnold DB. Networks of polarized actin filaments in the axon initial segment provide a mechanism for sorting axonal and dendritic proteins. Cell Rep. 2012;2:1546–1553. doi: 10.1016/j.celrep.2012.11.015. [DOI] [PMC free article] [PubMed] [Google Scholar]
- Wills Z, Bateman J, Korey CA, Corner A, Van Vactor D. The tyrosine kinase Abl and its substrate Enabled collaborate with the receptor phosphatase Dlar to control motor axon guidance. Neuron. 1999;22:301–312. doi: 10.1016/s0896-6273(00)81091-0. [DOI] [PubMed] [Google Scholar]
- Wu X, Shen QT, Oristian DS, Lu CP, Zheng Q, Wang HW, Fuchs E. Skin stem cells orchestrate directional migration by regulating microtubule-ACF7 connections through GSK3beta. Cell. 2011;144:341–352. doi: 10.1016/j.cell.2010.12.033. [DOI] [PMC free article] [PubMed] [Google Scholar]
- Xu K, Zhong G, Zhuang X. Actin, Spectrin, and associated proteins form a periodic cytoskeletal structure in axons. Science. 2013;339:452–456. doi: 10.1126/science.1232251. [DOI] [PMC free article] [PubMed] [Google Scholar]
- Yang Y, Bauer C, Strasser G, Wollman R, Julien JP, Fuchs E. Integrators of the cytoskeleton that stabilize microtubules. Cell. 1999;98:229–238. doi: 10.1016/s0092-8674(00)81017-x. [DOI] [PubMed] [Google Scholar]
- Yue L, Spradling AC. hu-li tai shao, a gene required for ring canal formation during Drosophila oogenesis, encodes a homolog of adducin. Genes Dev. 1992;6:2443–2454. doi: 10.1101/gad.6.12b.2443. [DOI] [PubMed] [Google Scholar]
- Zallen JA, Cohen Y, Hudson AM, Cooley L, Wieschaus E, Schejter ED. SCAR is a primary regulator of Arp2/3-dependent morphological events in Drosophila. J Cell Biol. 2002;156:689–701. doi: 10.1083/jcb.200109057. [DOI] [PMC free article] [PubMed] [Google Scholar]
- Zhang Y, Ha V, Li H, Tzingounis AV, Lykotrafitis G. Axon membrane skeleton structure is optimized for coordinated sodium propagation. 2016 arXiv:1602.06348. [Google Scholar]
- Zhong G, He J, Zhou R, Lorenzo D, Babcock HP, Bennett V, Zhuang X. Developmental mechanism of the periodic membrane skeleton in axons. Elife. 2014;3:e04581. doi: 10.7554/eLife.04581. [DOI] [PMC free article] [PubMed] [Google Scholar]
Associated Data
This section collects any data citations, data availability statements, or supplementary materials included in this article.