

Abstract
The neuroimmunodegenerative syndrome that develops in mice infected with ts1, a mutant of Moloney murine leukemia virus, resembles human AIDS. Both ts1 and human immunodeficiency virus type 1 infect astrocytes, microglia, and oligodendrocytes but do not infect neurons. Oxidative stress has been implicated in the neuropathology of AIDS dementia and other neurodegenerative diseases. We report here that ts1 infection of astrocytes (both transformed C1 cells and primary cultures) also induces thiol (i.e., glutathione and cysteine) depletion and reactive oxygen species (ROS) accumulation, events occurring in parallel with viral envelope precursor gPr80env accumulation and upregulated expression of endoplasmic reticulum chaperones GRP78 and GRP94. Furthermore, ts1-infected astrocytes mobilize their thiol redox defenses by upregulating levels of the Nrf-2 transcription factor, as well its targets, the xCT cystine/glutamate antiporter, γ-glutamylcysteine ligase, and glutathione peroxidase. Depleting intracellular thiols by treating uninfected astrocytes with buthionine sulfoximine (BSO), a glutathione synthesis inhibitor, or by culturing in cystine-deficient medium, also induces ROS accumulation, activates Nrf-2, and upregulates Nrf-2 target gene expression in these astrocytes. Overexpression of Nrf-2 in astrocytes specifically increases expression of the above thiol synthesis-related proteins. Further treatment with BSO or N-acetylcysteine in transfected cells modulates this expression. Thiol depletion also accelerates cell death, while thiol supplementation promotes survival of ts1-infected cells. Together, our results indicate that ts1 infection of astrocytes, along with ts1-induced gPr80env accumulation, endoplasmic reticulum stress, thiol depletion, and oxidative stress, accelerates cell death; in response to the thiol depletion and oxidative stress, astrocytes activate their Nrf-2-mediated thiol antioxidant defenses, promoting cell survival.
The retrovirus ts1, a temperature-sensitive mutant of Moloney murine leukemia virus (MoMuLV), induces a progressive neuroimmunodegenerative disease in FVB/N mice infected within the first few days after birth (80). In the central nervous system (CNS), ts1 infects astrocytes, microglia, ependymal cells, endothelial cells, and oligodendrocytes, but not neurons (67). Motor neuron and astrocyte death are accompanied by spongiform encephalopathy and astrogliosis in the brain stems and spinal cords of infected mice, resulting in hind limb paralysis (67, 68). Milder neurodegeneration occurs in wild-type (WT) MoMuLV-infected mice without paralysis (79, 84). The parallel occurrence of glial infection and indirect neuronal loss suggests that ts1 infection shares neuropathological features with human immunodeficiency virus type 1 (HIV-1)-associated dementia (HAD) (7, 46, 67, 80).
Oxidative stress has been implicated in the pathogenesis of various neurodegenerative diseases, including HAD, Alzheimer's disease, and Parkinson's disease (28, 41, 46, 49, 74). Oxidative stress occurs in cells when production of reactive oxygen species (ROS) exceeds the cells' endogenous antioxidant defenses (33). In astrocytes, major defenses against ROS include superoxide dismutases (SODs) and catalase (9, 14, 42). SODs catalyze the dismutation of superoxide (O2−) to hydrogen peroxide (H2O2) and molecular oxygen (O2), and are located in the cytoplasm (Cu/Zn SOD) and mitochondria (Mn SOD) (60, 65). Catalase is a tetrameric iron porphyrin protein located in the peroxisome that further scavenges H2O2 to make H2O and O2 (42). Expression of catalase and Cu/Zn SOD is constitutive, whereas expression of Mn SOD within the mitochondria is oxidant stress induced (54, 77).
Astrocytes are known to mount an additional robust response to oxidative stress by synthesizing antioxidant thiols, primarily glutathione (GSH) (61). GSH is a sulfhydryl peptide that can react directly with oxygen or nitrogen free radicals or donate electrons in the enzymatic dismutation of H2O2 to H2O and O2 by glutathione peroxidase (GPx) (12, 46).
Uptake of intracellular cysteine is the rate-limiting step for GSH and protein biosynthesis (39). Cystine is imported into the cell in exchange for glutamate via the plasma membrane cystine/glutamate antiporter (xCT). Upon arrival via xCT, cystine is reduced to cysteine, which in turn is used to synthesize GSH and proteins containing cysteine (1). When sufficient cysteine is present, the rate-limiting step in GSH synthesis becomes the activity of the heterodimeric enzyme γ-glutamyl cysteine ligase (γ-GCL), which is composed of both a catalytic subunit (γ-GCLC) and a modulatory subunit (γ-GCLM) (18, 66). Although γ-GCLC by itself can catalyze the synthesis of γ-glutamylcysteine, γ-GCLM enhances the enzymatic activity of γ-GCLC by lowering the Km for the glutamate substrate and increasing the Ki for negative feedback inhibition by GSH (8, 66).
NF-E2-related factor 2 (Nrf-2) is a basic leucine zipper transcription factor that binds to antioxidant response element (ARE) sequences in the promoter regions of specific genes (45, 63). Under physiological conditions, inactive Nrf-2 is bound to the Kelch-like ECH-associating protein 1 (Keap1) in the cytoplasm. Under oxidative stress, however, Nrf-2 is released from Keap1 and translocated to the nucleus (25, 43, 50), where it associates with the small Maf proteins FosB, C-Jun, JunD, ATF2, or ATF4. These heterodimeric complexes then interact with ARE promoter elements to induce gene expression (24, 26, 53). By this pathway, Nrf-2 orchestrates cytoplasmic responses to oxidative stress (23) by transcriptional activation of genes involved in GSH synthesis, including xCT, γ-GCLC, γ-GCLM, and GPx (36, 58, 63).
It has previously been reported that ts1-induced cytopathogenesis and hind limb paralysis are due to a Val-25→Ile substitution in the encoding env sequence of the envelope precursor protein gPr80env. In cells infected with WT MoMuLV, the parent strain for ts1, most gPr80env is cleaved to produce the mature viral envelope proteins gp70 and p15E, whereas inefficient processing of mutant gPr80env in ts1-infected cells leads to its accumulation in the endoplasmic reticulum (ER) (71-73, 83).
To test our hypothesis that thiol depletion and oxidative stress occur in ts1-infected astrocytes alongside gPr80env accumulation in the ER and ER stress and to determine how infected cells respond to this condition, we infected both an immortalized astrocyte line (C1) (37) and primary astrocyte cultures (PACs) with ts1. We then followed viral production, gPr80env accumulation, ER chaperone expression, cellular contents of thiols and ROS, and the mobilization of Nrf-2-mediated, GSH synthesis-related antioxidant defenses.
We show here that ts1 infection of cultured astrocytes (i) depletes cellular GSH and cysteine, (ii) increases ROS (H2O2), (iii) induces gPr80env accumulation, (iv) upregulates ER chaperone protein expression, (v) increases nuclear accumulation of Nrf-2, and (vi) upregulates the ARE-mediated proteins xCT, γ-GCLC, γ-GCLM, and GPx without upregulating Mn SOD or Cu/Zn SOD. The activation of thiol-specific antioxidant defenses in infected cells may explain the expedited cell deaths of ts1-infected astrocytes exposed to thiol-deficient conditions.
These data are pertinent to the parallel occurrence of protein accumulation and oxidative stress in both viral and nonviral neurodegenerative diseases, such as HAD, Huntington's disease, Alzheimer's disease, Parkinson's disease, and amyotrophic lateral sclerosis (41, 46, 74). This is the first study in which Nrf-2-mediated thiol antioxidant defense mechanisms are shown to be activated in astrocytes by retrovirus infection-induced protein accumulation, ER stress, thiol depletion, and oxidative stress.
MATERIALS AND METHODS
Virus titer and ts1 infection.
ts1, a spontaneous temperature-sensitive mutant of MoMuLV, was propagated in TB cells, a thymus-bone marrow cell line. The virus titer was determined by a modified direct focus-forming assay in the 15F cell line, a murine sarcoma-positive, leukemia-negative cell line, as described previously (81). Murine C1 astrocyte cells (a simian virus 40 large T-antigen immortalized cell line, prepared as described previously) (37) or PACs were seeded into plastic culture dishes (60- or 100-mm diameter) and incubated overnight in Dulbecco's modified Eagle medium (DMEM) or DMEM/F12, respectively, containing 1% fetal bovine serum (FBS) and 3 μg of polybrene/ml to enhance viral adsorption. The next day, the cells were infected with ts1 or WT MoMuLV at 34°C for 40 min at a multiplicity of infection (MOI) of 5. The cells were then washed and refed with fresh DMEM or DMEM/F12 with 10% FBS. The cultures were incubated at 37°C and harvested for the following experiments.
Cell viability.
To compare the sensitivity of ts1-infected versus WT-infected and mock-infected C1 cells to cystine-limited conditions, C1 cells (4 × 10⁵ cells per 60-mm plate) were synchronized for 16 h in DMEM containing 1% FBS and 3 μg of polybrene/ml; then mock infected, WT infected, or ts1 infected on the next day; and cultured in DMEM cystine-deficient medium (Invitrogen, Carlsbad, Calif.) with 10% FBS and various supplemental concentrations of cystine (0, 10, 50, 100, 200, 500, or 1,000 μM cystine).
Mock-infected and infected cells were tested for viability by trypan blue exclusion (at 24, 48, 72, or 96 h postinfection [hpi]). For cell counting, cells were trypsinized, suspended, stained with trypan blue for 5 min, and then counted with a hemocytometer.
PACs.
PACs were isolated from 1- to 2-day-old FVB/N mice by a modification of previously described procedures (64). Briefly, the cerebral cortex was dissected from newborn mice, the tissue was minced in DMEM/F-12 on ice, and a single-cell suspension was prepared by syringing the minced tissue through a 70-μm nylon mesh cell strainer. The cells were then plated into poly-l-lysine-coated flasks, incubated at 37°C in a humidified atmosphere of 5% CO2 in air, and grown for 7 to 9 days (at which time they were confluent) in DMEM/F-12 supplemented with 10% FBS, 100 U of penicillin/ml, 100 μg of streptomycin/ml, and 2.5 μg of fungizone/ml. The cells were serially passed four to five times before use. More than 85% of the cells in these cultures were glial fibrillary acidic protein (GFAP) positive after the first passage, as detected by immunohistochemical staining with rabbit anti-mouse GFAP antibodies (DAKO Corp., Carpinteria, Calif.). The frequency of GFAP-positive cells increased after each additional passage and reached 95% after three to four passages.
Intracellular GSH content.
Levels of intracellular GSH were determined with a GSH assay kit (Calbiochem, San Diego, Calif.). For this assay, C1 cells or PACs were plated at a density of 2 × 10⁶ and 1 × 10⁶ cells per 100-mm dish, respectively, after which the cell cultures were mock infected or infected with ts1 or WT virus as described above. The cells were then washed twice with phosphate-buffered saline (PBS) and collected by centrifugation at 24, 48, or 72 hpi. The resulting pellets were homogenized in ice-cold 5% metaphosphoric acid solution, and 200 μl of supernatant from each sample was added to tubes containing 700 μl of assay buffer. This was followed by the addition of 50 μl of the assay kit R1 solution and 50 μl of the assay kit R2 solution to each tube. The tubes were then incubated in the dark at room temperature for 10 min prior to measurement of absorbance at 400 nm. To determine total protein content in cell pellets, the pellets were washed once with PBS and solubilized in 0.5 N NaOH for 30 min, and protein content was then determined for each sample with a BCA assay kit (Pierce, Rockford, Ill.). GSH content is expressed as the number of nanomoles per milligram of protein.
Total intra- and extracellular cysteine content.
Total intra- and extracellular cysteine content was measured by fluorometric high-performance liquid chromatography (HPLC) as described previously (82). C1 cells were plated at a density of 2 × 10⁶ cells per 100-mm dish, after which the cultures were either mock infected or infected with ts1. At the end of 24, 48, or 72 h of incubation, the culture medium was collected, and the cells were washed three times with PBS, harvested, and pelleted.
The culture medium and cell pellets were treated with 1.5 M and 0.5 M HClO4, respectively, neutralized with 2 M KHCO3, and then centrifuged at 14,000 rpm for 20 min. The supernatants were collected and frozen at −80°C for later measurement of total intra- and extracellular cystine/cysteine. The pellets were retained for protein content measurements.
For measurement of total intra- or extracellular cystine/cysteine, the frozen samples were thawed, followed by reduction of cystine to cysteine in the presence of 2-mercaptoethanol and then by conversion of total cysteine to S-carboxymethylcysteine in the presence of iodoacetate. S-Carboxymethylcysteine reacts with o-phthaldialdehyde to form a fluorescent derivative that can be measured by fluorometric HPLC. Cysteine in the samples was quantified with the aid of cysteine standards (Sigma, St. Louis, Mo.).
The protein content was then determined with a BCA protein assay kit. Total intracellular cysteine levels are expressed as the number of nanomoles per milligram of protein, and total extracellular cysteine levels are expressed as the number of nanomoles per milliliter of culture medium.
Intracellular ROS (H2O2) assay.
The dye 5(and 6)-chloromethyl-2′,7′-dichlorodihydrofluorescein diacetate (CM-H2DCFDA; Molecular Probes, Eugene, Oreg.) is a cell-permeant indicator that detects mainly H2O2 (and some O2−). The dye is nonfluorescent until its acetate groups are removed by intracellular esterases. When this has occurred, CM-H2DCFDA is oxidized within the cells by existing H2O2 to form a highly fluorescent derivative, carboxydichlorofluorescein (2, 34). The fluorescence intensity of intracellular DCFDA is a linear indicator of the amount of H2O2 in the stained cells.
To detect ROS (H2O2) accumulation, C1 cells and PACs were plated and mock infected or infected with either ts1 or WT virus. Half of each of the mock- and virus-infected C1 cell cultures or PACs were treated with 1 mM buthionine sulfoximine (BSO) (Sigma), an inhibitor of GSH synthesis (44), for the last 24 h of their incubation. Separate sets of uninfected C1 cultures or PACs were incubated with various concentrations of cystine (0, 10, 50, 100, 200, or 1,000 μM) in the culture medium.
After a total of 24, 48, or 72 h of incubation, all cells were then incubated with 10 μM CM-H2DCFDA in the culture medium for 30 min at 37°C. The cells were harvested, and their forward and side scatter DCFDA fluorescence profiles were determined with a Coulter Epics Elite software program, version 4.02. The arithmetic mean fluorescence intensity (MFI) was derived with CellQuest software.
Western blot analysis.
Total cellular proteins were prepared with modified radioimmunoprecipitation assay buffer (20 mM Tris [pH 7.4] containing 1% NP-40; 0.5% sodium deoxycholate; 0.1% sodium dodecyl sulfate; 1 mM EDTA; 1 mM EGTA; 100 μM phenylmethylsulfonyl fluoride; 1 μg/ml [each] of aprotinin, leupeptin, and pepstatin A; 10 μg of soybean trypsin inhibitor/ml; 1 mM sodium orthovanadate; 1 mM sodium fluoride; and 0.5 mM dithiothreitol). Cytosolic and nuclear fractions were prepared with the NE-PER nuclear and cytoplasmic extraction kit (Pierce), and cross-contamination between the fractions was verified as being less than 5% by Western blotting of cytosol- and nuclear protein-specific antibodies. Protein concentrations were determined with the Dc protein assay reagent (Bio-Rad Laboratories, Hercules, Calif.). The cell lysates (20 to 50 μg of total protein per sample) were separated on sodium dodecyl sulfate-polyacrylamide gel electrophoresis gels with 10 or 12% polyacrylamide.
After electrophoresis, the proteins were transferred to polyvinylidene difluoride membranes (Millipore Corp., Bedford, Mass.). The membranes were blocked for 1 h in Tris-buffered saline with 5% nonfat milk at room temperature and subsequently incubated with primary antibodies against the proteins of interest. Rabbit anti-catalase was purchased from Rockland, Inc., Gilbertsville, Pa.; rabbit anti-Cu/Zn SOD and anti-Mn SOD were from Stressgen Biotechnologies, Victoria, British Columbia, Canada; rabbit anti-GPx was from Chemicon International, Temecula, Calif.; rabbit anti-γ-GCLC and anti-γ-GCLM were both gifts from T. J. Kavanagh of the University of Washington; rabbit anti-xCT antiporter was obtained as described below; rabbit anti-Nrf-2, rabbit anti-GRP78, and rabbit anti-GRP94 were from Santa Cruz Biotechnology, Inc., Santa Cruz, Calif.; and goat anti-gp70 was from ViroMed Biosafety Laboratories, Camden, N.J.
A second rabbit anti-γ-GCLM polyclonal antibody was raised in our laboratory against the synthetic peptide CTMSHAVEKINPDEREEMKV (amino acids 72 to 91 of the mouse γ-GCLM) coupled to keyhole limpet hemocyanin. We verified the specificity of this anti-γ-GCLM antibody against the anti-γ-GCLM antibody of Thompson et al. (75) and with Gclm−/− mouse tissue from Timothy P. Dalton, University of Cincinnati Medical Center. Rabbit anti-xCT polyclonal antibodies were also prepared in our laboratory against the synthetic peptide SMGDQEPPGQEKVVLKKKIT (amino acids 26 to 45 of the mouse xCT antiporter) coupled to keyhole limpet hemocyanin. The specificity of this antibody for xCT was confirmed by its ability to detect overexpressed xCT in cells transfected with a mouse pcDNA3.1-xCT plasmid (a gift of Timothy H. Murphy, University of British Columbia, Vancouver, Canada, and Shiro Bannai, University of Tsukuba, Tsukuba, Ibaraki, Japan).
After incubation with the primary antibody, polyvinylidene difluoride membranes containing separated proteins were washed and incubated with horseradish peroxidase-conjugated secondary antibodies (anti-rabbit, Amersham Biosciences, Piscataway, N.J.; anti-goat, Sigma; anti-mouse, Bio-Rad Laboratories). Immune complexes were detected on the membranes with a chemiluminescent reagent (NEN Life Science Products, Boston, Mass.). An anti-β-actin monoclonal antibody (Sigma) was used as a control for protein loading.
Net intensities of protein bands of interest were determined by densitometric analysis of autoradiographs with a Kodak (Rochester, N.Y.) Digital Science Image Station 440 CF and Kodak 1D Image Analysis software. Band intensities were then normalized to β-actin intensities and compared for differences between experimental and control conditions. All Western blotting results were replicated in three to five independent experiments.
Plasmids and transfection.
A pCMV-Nrf-2 mammalian expression vector, carrying cDNA encoding mouse Nrf-2, was obtained from Invitrogen and confirmed by sequencing. Cultured C1 astrocytes were transiently transfected with pCMV-Nrf-2, alongside an index human embryonic kidney 293 line, HEK293 (American Type Culture Collection, Manassas, Va.), by the LipofectAMINE protocol (Invitrogen) according to the manufacturer's instructions. After transfection, some of the C1 cultures were immediately treated with 5 mM N-acetylcysteine (NAC). Other C1 cultures were treated with 1 mM BSO for the last 24 h of incubation. The transfected HEK293 and C1 cells were incubated for a total of 48 or 56 h, respectively, washed with PBS, and used to prepare cell lysates as described above for Western blotting.
Statistical analysis.
All experiments were conducted in triplicate or quadruplicate, with the means from three to four individual experiments used for statistical analysis. The statistical significance of the results was determined by analysis of variance or Student's t test. P values of <0.05 were considered statistically significant.
RESULTS
Thiol depletion induced by ts1 infection in astrocytes.
The thiols cystine/cysteine are essential nutrients for astrocytes (12, 15), and the availability of intracellular cysteine is rate limiting for synthesis of protein and GSH, a tripeptide necessary for antioxidant defense (11, 39). To determine whether GSH and cysteine levels are depleted by ts1 or WT infection, we measured intracellular concentrations of GSH and cysteine in mock-infected, WT-infected, and ts1-infected C1 astrocytes over a 72-h culturing period, during which time the culture medium was not changed. Because intracellular cysteine levels depend on the importation of extracellular cystine/cysteine, we also measured changes in cystine/cysteine in the culture medium over time.
Figure 1A shows that intracellular GSH levels decreased during culture of mock-infected, WT-infected, and ts1-infected cells. Extracellular cystine/cysteine levels in the culture medium also decreased, from a starting point at 0 h of 422 ± 6 nmol cysteine/ml of medium (the equivalent of 200 μM cystine) in both mock-infected and virus-infected C1 cells (Fig. 1B). However, both intracellular GSH and extracellular cystine levels decreased more rapidly in ts1-infected C1 cells (Fig. 1A and B).
FIG. 1.

Intracellular GSH content and intracellular and extracellular cysteine levels in ts1-infected astrocytes. (A) C1 astrocytes were plated at 2 × 10⁶ cells per 100-mm dish, and then either mock-, WT-, or ts1-infected at an MOI of 5 for 40 min. After incubation for 24, 48, and 72 hpi, intracellular GSH measurements were performed with a GSH assay kit. Intracellular GSH levels are expressed as the numberof nanomoles per milligram of cellular protein. (B and C) After mock or ts1 infection, C1 cells were cultured for 24, 48, and 72 hpi, at which time cystine/cysteine levels were measured from the culture medium (B) or from the cells (C) by a fluorometric HPLC method. (D) PACs were plated at 106 cells per 100-mm dish, and then mock or ts1 infected at an MOI of 5 for 40 min. After incubation for 72 hpi, intracellular GSH was measured. All graphs reflect means ± standard deviation from three to four independent experiments. *, P < 0.05 compared to mock infection at 24, 48, and 72 hpi; **, P < 0.01; #, P < 0.05, compared to WT infection at the same time points.
Although intracellular cysteine levels in ts1-infected cells were significantly lower than those in mock-infected cells at 24 hpi, intracellular cysteine increased in ts1-infected cells through 48 and 72 hpi (Fig. 1C). It therefore appears that ts1-infected cells are initially depleted of intracellular cysteine but subsequently restore and maintain higher intracellular cysteine levels than control cells.
The C1 astrocyte cell line contains the simian virus 40 large T antigen, and these cells proliferate rapidly as a consequence. Since this property of these cells could affect their thiol consumption, we also evaluated intracellular GSH levels in slow-growing PACs that were either mock or ts1 infected. Figure 1D shows that ts1-infected PACs had decreased intracellular GSH levels, relative to mock-infected PACs, at 72 hpi. Notably, at 72 hpi, intracellular GSH levels in mock-infected C1 cells (11.8 ± 0.2 nmol/mg of protein) (Fig. 1A) were much lower than those in mock-infected PACs (42.9 ± 0.6 nmol/mg of protein) (Fig. 1D).
Increased intracellular H2O2 accumulation in ts1-infected astrocytes.
Intracellular concentrations of H2O2 can be quantitated fluorometrically by oxidation of the dye CM-H2DCFDA (2). We therefore performed flow cytometric analysis of CM-H2DCFDA-loaded mock-infected versus WT-infected and ts1-infected C1 astrocytes and PACs. The results shown in Fig. 2A (data for the 72 h time point) and B (data for all time points) indicate that H2O2 was progressively increased in both WT- and ts1-infected cells, relative to that in mock-infected cells, but that H2O2 levels were highest in the ts1-infected C1 cells at all time points. Figure 2C shows that an increased level of H2O2 was also evident in ts1-infected PACs by 24 hpi (MFI, 6.5), relative to that in mock-infected control PACs (MFI, 3.37).
FIG. 2.

ROS levels in ts1-infected, BSO-treated, or cystine-deficient astrocyte cultures. After infection and treatment as described below, cells were incubated for 30 min at 37°C in 10 μM H2DCFDA and then harvested for flow cytometric analysis of H2O2 content, as described in Materials and Methods. (A) C1 cells were mock infected, WT infected, ts1 infected, or BSO treated (without virus infection) and then incubated for 72 h. (B) C1 cells that were mock infected, WT infected, or ts1 infected in the presence or absence of BSO were then incubated for 24, 48, and 72 hpi. At each time point, differences between MFIs were determined for each population relative to mock-infected C1 controls. *, P < 0.05; **, P < 0.01, significant differences between differences relative to mock-infected controls; #, P < 0.05; ##, P < 0.01, relative to WT-infected cells; ‡, P < 0.05, relative to BSO-treated C1 controls; †, P < 0.05, relative to WT-infected and BSO-treated C1 cells at 24, 48, and 72 h of incubation. (C) PACs were either mock infected, ts1 infected, or treated with BSO (without virus infection) and incubated for 24 h prior to measurement of their H2O2 content. (D) Uninfected C1 cells were cultured in medium containing the indicated concentrations of cystine with 10% FBS for 24 h. (E) Uninfected C1 cells were cultured in medium containing the indicated concentrations of cystine with 10% FBS for 12, 24, 48, and 72 h. At each time point, differences between MFIs were determined for each population relative to C1 cells incubated with 200 μM cystine (the normal concentration for medium used to culture astrocytes). *, P < 0.05; **, P < 0.01; significant differences between fold measurements at each time point relative to C1 cells incubated in 200 μM cystine. (F) Uninfected PACs were incubated for 24 h in culture medium containing the indicated concentrations of cystine and analyzed for their content of H2O2 by fluorescence intensity. All graphs reflect means ± standard deviation from three to four independent experiments.
To examine the relationship of intracellular thiol levels to H2O2 accumulation, we treated mock-, WT-, and ts1-infected C1 cells with the GSH synthesis inhibitor BSO in an attempt to mimic intracellular thiol depletion in the absence of viral infection. Figures 2A and B show that BSO treatment greatly increased H2O2 in all cells as early as 24 hpi. Viral infection coupled with BSO treatment amplified H2O2 levels even farther. Similar BSO amplification of H2O2 levels occurred in mock-infected PACs at the 24 h time point (from an MFI of 3.37 to 93.9) (Fig. 2C). In addition, the results depicted in Fig. 2A and C reveal that PACs maintain relatively higher basal H2O2 levels than do C1 astrocytes (MFI, 3.37 versus 0.69).
To examine the relationship between levels of extracellular cystine and H2O2 accumulation in our system, we cultured uninfected C1 cells in medium containing various concentrations of cystine (0, 10, 50, 100, 200, or 1,000 μM). The normal amount of cystine in commercial DMEM is 200 μM. Figures 2D and E show that H2O2 levels at each time point progressively increased as cystine levels decreased, relative to cells grown in normal medium containing 200 μM cystine, beginning at 24 h (Fig. 2D shows data for the 24-h time point, and Fig. 2E shows data for all time points). Uninfected PACs cultured in 10 μM cystine showed significantly more H2O2 at 24 h than control PACs cultured with 200 μM cystine, with MFI differences ranging from 3.66 to 16.5 (Fig. 2F). Together, these results indicate that threshold levels of extracellular cystine are required to prevent H2O2 accumulation in astrocytes.
Virus replication, processing of gPr80env to gp70, and ER chaperone protein expression in ts1-infected astrocytes.
It has previously been reported that ts1-infected cells accumulate unprocessed mutant envelope precursor protein gPr80env in the ER. WT gPr80env, on the other hand, is efficiently processed to yield mature viral envelope proteins gp70 and p15E (64, 72). To determine whether this difference between the two virus strains affects viral replication and gPr80env accumulation in C1 cells and to assess whether either virus initiates ER stress responses in infected C1 cells, we measured virus titers in the supernatant at 24, 48, and 72 hpi. Figure 3A shows that the amount of virus produced was lower in ts1-infected C1 cells at 24 and 48 hpi but not at 72 hpi.
FIG. 3.

Viral production, gPr80env accumulation, and chaperone protein upregulation in WT- and ts1-infected astrocytes. (A) Virus titers for WT and ts1 infection of C1 cells were determined at 24, 48, and 72 hpi. Virus titers are given as infectious units (IU) per 103 cells. (B) After mock, WT, or ts1 infection and incubation for 24, 48, or 72 hpi, cell lysates were analyzed for their content of gPr80env and mature gp70. (C) Under the same conditions, cell lysates were also analyzed for their content of GRP78 and GRP94. All blots were stripped and reimmunoblotted with anti-β-actin antibody as a protein loading control. Intensities of bands corresponding to proteins of interest were normalized to those for β-actin, and differences were determined as shown. All blots shown are representative of three independent experiments.
When the processing of gPr80env in ts1-infected C1 cells was compared to that occurring after WT infection, the data showed that most of the gp70 in ts1-infected cells was still in the unprocessed (and accumulating) gPr80env band, whereas WT-infected cells exhibited more-efficient gp70 production, with a nearly complete disappearance of gPr80env by 72 hpi (Fig. 3B).
ER stress caused by unfolded or misfolded proteins induces upregulation of ER chaperones, i.e., glucose-regulated proteins (GRPs), such as GRP78 and GRP94 (19, 31). Figure 3C shows that the level of chaperone proteins GRP78 and GRP 94 were elevated in cells infected with both the WT and ts1 viruses, but that this effect was somewhat more pronounced under ts1 infection at 24, 48, and 72 hpi. Together, these data suggest that the ts1 mutant envelope protein is more slowly processed in C1 astrocytes than the WT envelope protein (Fig. 3B), which may in turn prevent efficient viral production (Fig. 3A). This may induce ER stress responses in ts1-infected cells (Fig. 3C).
The xCT transporter and thiol-related enzymes are upregulated after ts1 infection, while non-thiol-related antioxidant enzymes are not.
The data above suggest that thiol depletion, oxidative stress, and ER stress occur concurrently in ts1-infected astrocytes. However, astrocytes are known to possess robust antioxidant defenses, including catalase, Cu/Zn and Mn SODs, GPx, and GSH (9, 14, 42, 63). We therefore determined whether the amounts of antioxidant proteins Cu/Zn SOD, Mn SOD, and GPx, along with transporter protein and GSH synthesis enzyme (i.e., the xCT transporter and the two γ-GCL subunits), are upregulated in response to ts1 or WT infection.
Figure 4A shows that xCT, γ-GCLC, γ-GCLM, and GPx levels were upregulated in both WT- and ts1-infected C1 cells, although levels were further elevated in ts1-infected cells than in WT-infected cells. xCT, γ-GCLC, γ-GCLM, and GPx levels were also upregulated by ts1 in PACs at 72 hpi (Fig. 4A).
FIG. 4.

Upregulation of xCT, γ-GCL subunits, and GPx, but not of Cu/Zn and Mn SODs, in ts1-infected astrocytes. (A) After mock, WT, or ts1 infection, C1 cells were incubated for 24, 48, and 72 hpi, and after mock or ts1 infection, PACs were incubated for 72 hpi, at which times cell lysates were analyzed for their content of xCT, γ-GCLC, γ-GCLM, and GPx. (B) After mock or ts1 infection, C1 cells were incubated for 24, 48, and 72 hpi in the presence of absence of BSO, and cell lysates were analyzed for their content of xCT, γ-GCLC, γ-GCLM, and GPx. (C) Uninfected C1 cells were incubated for 24 h in medium containing the indicated concentrations of cystine, and cell lysates were analyzed for their contents of xCT and γ-GCLM. (D) Mock- or ts1-infected C1 cells were incubated for 24, 48, or 72 hpi, and cell lysates were analyzed for their contents of Cu/Zn SOD and Mn SOD. All blots were stripped and reimmunoblotted with anti-β-actin antibody as a protein loading control. Intensities of bands corresponding to proteins of interest were normalized to those for β-actin, and differences were determined as shown. All blots shown are representative of three to four independent experiments.
Figure 4B also shows that BSO treatment of mock-infected C1 cells increased xCT and GPx expression by 24 h and elevated γ-GCLC and γ-GCLM expression by 48 and 72 h, respectively. Figure 4B also shows that BSO treatment coupled with ts1 infection induced further increases in all four proteins at all time points, by comparison with ts1-infected and BSO-untreated, mock-infected, and BSO-treated C1 cells, or mock-infected and BSO-untreated C1 cells.
The results described above suggest that culturing of C1 cells in cystine-deficient medium, like BSO treatment, elicits thiol depletion with H2O2 accumulation. To investigate the effect of cystine deprivation on levels of thiol-related proteins, we cultured C1 cells for 24 h in medium varying in cystine concentrations (0, 10, 100, or 1,000 μM) and then measured the amounts of xCT and γ-GCLM. Data in Fig. 4C show that cells cultured in cystine-deficient medium (<100 μM) upregulated levels of both proteins. By contrast, high-cystine concentrations (1,000 μM) decreased expression of both (Fig. 4C).
Figure 4D shows that levels of Cu/Zn SOD and Mn SOD in ts1-infected C1 cells did not differ from those of uninfected C1 cells, even as late as 72 hpi.
Increased cytosolic and nuclear accumulation of Nrf-2 after ts1 infection.
The transcription factor Nrf-2, which binds ARE sequences, is involved in the transcriptional activation of ARE-targeted genes, including those encoding xCT, γ-GCL, and GPx (23, 36, 63). The data demonstrate that levels of these proteins are selectively increased by ts1 infection or by thiol depletion in C1 cells and PACs. This suggests that Nrf-2 may be upregulated under our thiol-depleting infection conditions. We therefore measured total cellular Nrf-2 levels in ts1-infected, WT-infected, and mock-infected C1 astrocytes. Figure 5A shows progressively increasing Nrf-2 levels in all cells over 72 hpi, but the largest increases occurred in ts1-infected cells.
FIG. 5.

Activation and nuclear accumulation of Nrf-2 in ts1-infected or cystine-deficient astrocytes. (A) After mock, WT, or ts1 infection, C1 cells were incubated for 24, 48, and 72 hpi, and total cell lysates analyzed for their contents of Nrf-2. (B) Mock- or ts1-infected C1 cells were incubated for 24, 48, and 72 hpi, at which time cell homogenates were separated into cytoplasmic and nuclear fractions. The separate fractions were then analyzed for their contents of cytoplasmic and nuclear Nrf-2. (C) Mock-, WT-, or ts1-infected C1 cells were incubated for 72 hpi, and their nuclear fractions were analyzed for their contents of Nrf-2. (D) PACs were mock or ts1 infected either in the presence or absence of BSO and incubated for 72 hpi. Cytosolic and nuclear fractions were prepared and analyzed for their contents of cytosolic and nuclear Nrf-2. (E) Uninfected C1 cells incubated for 24 h in medium containing the indicated concentrations of cystine were analyzed for their total cellular contents of Nrf-2. All blots were stripped and reimmunoblotted with anti-β-actin antibody as a protein loading control. Intensities of bands corresponding to proteins of interest were normalized to those for β-actin, and differences determined as shown. All blots shown are representative of three to four independent experiments.
To determine whether Nrf-2 elevation is correlated with its nuclear accumulation under ts1 infection, C1 cells were either mock or ts1 infected, and cytoplasmic and nuclear fractions were then prepared from the cell homogenates.
Figure 5B shows that both cytoplasmic and nuclear Nrf-2 levels were higher in ts1-infected than in mock-infected cells, beginning at 24 hpi. In light of the 1.8- and 2.8-fold differences in total cellular Nrf-2 at 72 hpi (Fig. 5A), we repeated our Nrf-2 nuclear fractionation experiments in WT-infected cells alongside ts1-infected cells at the same time point. Figure 5C shows again that while Nrf-2 levels are increased after WT infection, ts1 infection-induced increases were clearly greater.
Figure 5D demonstrates that levels of both cytoplasmic and nuclear Nrf-2 were also higher in ts1-infected versus control PACs at 72 hpi. When we treated mock- and ts1-infected PACs with BSO, the BSO-treated, ts1-infected PACs displayed increases in cytosolic and nuclear Nrf-2 beyond those observed in PACs infected with ts1 alone, treated with BSO alone, or mock infected and untreated.
To further examine the possibility that Nrf-2 protein levels respond to thiol and ROS levels in astrocytes, we cultured C1 cells for 24 h in medium containing cystine at various concentrations (0, 10, 100, or 1,000 μM). Figure 5E shows that cells grown under cystine-deficient conditions (<100 μM) had upregulated total Nrf-2 levels, whereas cells grown at high-cystine concentrations (1,000 μM) had decreased total Nrf-2 levels. Together, these data are consistent with the idea that thiol and ROS levels regulate the amounts of Nrf-2 and Nrf-2 target gene products in astrocytes.
Overexpression of Nrf-2 increases amounts of xCT and thiol-related enzymes, but not of non-thiol-related antioxidative enzymes.
To confirm that Nrf-2 expression increases production of the Nrf-2 target proteins required for GSH biosynthesis and cystine uptake, we overexpressed Nrf-2 in index HEK293 cells and in C1 cells by transient transfection of both lines with the pCMV-Nrf-2 expression plasmid. In both cell lines, levels of Nrf-2, as well as levels of the Nrf-2 target gene products xCT, γ-GCLC, γ-GCLM, and GPx, were significantly increased as a consequence of Nrf-2 overexpression, relative to amounts of the same proteins in empty plasmid-transfected controls (Fig. 6).
FIG. 6.
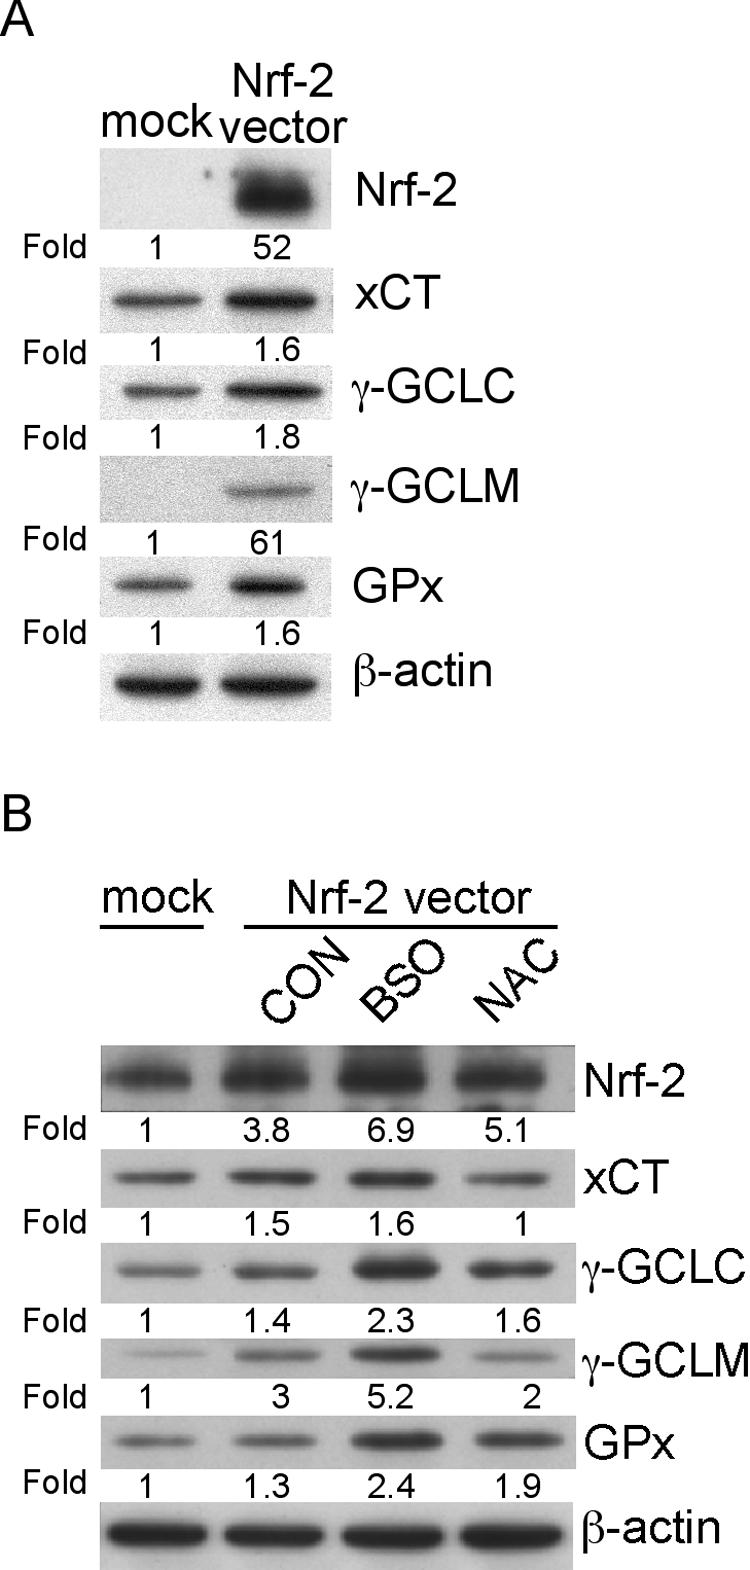
Effects of Nrf-2 transfection on expression of Nrf-2 and its downstream target genes in HEK293 cells and C1 astrocytes. (A) HEK293 cells were either mock transfected with the empty vector pcDNA3.1 or transfected with the pCMV-Nrf-2 vector and then incubated for 48 h prior to preparation of cell lysates for analysis of their Nrf-2, xCT, γ-GCLC, γ-GCLM, and GPx content. (B) C1 cells were either mock transfected with the empty vector pcDNA3.1 or transfected with the pCMV-Nrf-2 vector and then cultured for 56 h either without further treatment (CON), or with BSO or NAC, as indicated in Materials and Methods. At the end of the culture period, total cellular lysates were analyzed for their Nrf-2, xCT, γ-GCLC, γ-GCLM, and GPx content. All blots were stripped and reimmunoblotted with anti-β-actin antibody as a protein loading control. Intensities of bands corresponding to proteins of interest were normalized to those for β-actin, and differences determined as shown. All blots shown are representative of three independent experiments.
To determine whether thiol manipulation can modulate expression of Nrf-2 and its target gene products in Nrf-2-transfected cells, we treated transfected C1 cells with 1 mM BSO or with 5 mM NAC and compared amounts of Nrf-2 and its target gene products in the treated cells to those of untreated controls. The data in Fig. 6B show that levels of Nrf-2 and of all Nrf-2 downstream gene products were increased in Nrf-2-transfected C1 cells by BSO treatment, while amounts were decreased by NAC treatment. When we measured amounts of the non-thiol-related antioxidant enzymes catalase, Cu/Zn SOD, and Mn SOD in these cells, none were affected by Nrf-2 overexpression (data not shown).
Cystine deficiency accelerates astrocyte death after ts1 infection.
Cystine/cysteine is required both for protein and GSH synthesis and for antioxidative defense (30). As shown above, WT and ts1 infection of astrocytes depletes their stores of intracellular GSH and extracellular cystine/cysteine. To find out to what extent WT-induced and ts1-induced C1 cell death is the result of cystine deficiency and oxidative stress, we incubated mock-infected, WT-infected, or ts1-infected C1 cells in medium containing various concentrations of cystine (0,10, 50, 100, 200, 500, or 1,000 μM), and measured viable cell numbers at 0, 24, 48, 72, and 96 hpi. All cultures contained (40 ± 5) × 104 cells at 0 hpi (i.e., at the time of infection).
Figure 7 shows that cystine levels in the culturing medium were critical for survival and proliferation of all cells, including mock-infected cultures. Mock-infected C1 cells cultured in cystine-free medium with 10% FBS (a minor source of cystine) proliferated slowly over the first 48 h of incubation (Fig. 7A and B), but had begun to die in significant numbers by 72 hpi (Fig. 7C). Mock-infected C1 cells cultured in 10 μM cystine medium also proliferated slowly (Fig. 7A to C), but showed complete cell death by 96 hpi (Fig. 7D). WT-infected cells cultured in 0 and 10 μM cystine showed nearly complete cell death even earlier, at 48 and 72 hpi, respectively (Fig. 7B and C).
FIG. 7.

Cystine deprivation accelerates C1 astrocyte cell death after WT or ts1 infection. C1 cells (4 × 10⁵ cells per 60-mm plate) were synchronized for 16 h in DMEM containing 1% FBS and 3 μg of polybrene/ml, then mock, WT, or ts1 infected the next day, and incubated for (from top to bottom) (A) 24, (B) 48, (C) 72, or (D) 96 hpi in medium containing the indicated concentrations of cystine. At the end of the culturing period, the numbers of viable cells were counted by trypan blue exclusion. All cultures contained (40 ± 5) × 104 cells at 0 hpi (i.e., at the time of infection). All graphs shown are representative of three independent experiments.
In ts1-infected C1 cell cultures, significant cell death occurred as early as 24 hpi in cystine-free medium(Fig. 7A), by 48 hpi in 10 μM cystine(Fig. 7B), and by 72 hpi in cultures whose medium contained 50 or 100 μM cystine (Fig. 7C). At 96 hpi, this effect was extended to cultures incubated in 100 or 200 μM cystine (Fig. 7D). Interestingly, higher cystine concentrations (500 and 1,000 μM) allowed some infected cells to survive and continue to proliferate for the entire 96 h of this experiment, albeit at somewhat slower rates than those of mock-infected cells (Fig. 7).
All C1 astrocyte cultures, infected or not, continued to proliferate throughout the culturing period when their medium contained above-threshold amounts of cystine, with thresholds differing according to infection treatment (Fig. 7). As for cell death, the time at which cultures succumbed to cystine deficiency also differed between infected or cystine-treatment groups (Fig. 7). The bell-shaped pattern reflecting this trend for the different cell treatment groups was evident at all four time points in this experiment. However, this cystine dose-dependent pattern for ts1-infected cultures shifted to the right at each time point, followed by the more slowly shifting pattern for WT-infected cultures, which was in turn followed by the slowest shifting pattern for mock-infected cultures (Fig. 7).
DISCUSSION
Thiol depletion and oxidative stress have been shown previously to occur following in vitro and in vivo infection with retroviruses, including HIV infection in human T cells and in AIDS patients (4, 6, 17, 46, 49, 76). However, the work presented here comprises the first detailed study correlating thiol depletion and oxidative stress with protein accumulation and ER stress following retrovirus infection. These novel data also suggest that these changes trigger a cellular Nrf-2-driven antioxidant defense response and that this response orchestrates the coordinated upregulation of thiol synthesis-related proteins encoded by genes containing AREs in their promoter regions (xCT, γ-GCL, and GPx) in transformed C1 cells and in primary astrocytes. WT infection results in similar effects, but to an attenuated extent.
ts1 infection induces gPr80env accumulation, thiol depletion, and oxidative stress in astrocytes.
Our data identify thiol depletion and oxidative stress as consequences of WT and ts1 retroviral infection. These findings are consistent with observations by others with other retroviruses, including HIV (4, 6, 17, 46, 49, 76). However, the mechanisms by which WT and ts1 infection induce thiol depletion and oxidative stress are not clear. In most cell types under normal conditions, cysteine is an essential amino acid required for protein and GSH synthesis, and it must be taken up from extracellular stores (5, 59). Our data indicate that normal cell growth and division indeed decrease intracellular GSH content and consume extracellular cystine/cysteine, most likely in the process of synthesizing new protein and reestablishing GSH homeostasis (Fig. 1).
GSH is also utilized under oxidative stress as a primary mechanism for (i) detoxification of excess ROS (13), (ii) protection of cysteinyl protein residues from oxidation through glutathionylation (18, 20), or (iii) protection of the plasma membranes of the affected cell and neighboring cells by GSH secretion (12, 57, 78). Viral replication, as an oxidative stressor, is likely to increase cysteine utilization in GSH synthesis to counteract a larger ROS load and increased GSH secretion and glutathionylation (20, 63).
If extracellular cystine/cysteine stores fail to keep pace with GSH synthesis demands, ROS accumulation may occur, and this ROS overload can, in turn, deplete intracellular GSH (22, 62). Our data show not only that virus infection-induced ROS accumulation co-occurs with thiol depletion in astrocytes, but also that additional thiol depletion in these cells, whether by inhibition of GSH synthesis or cystine-deficient culturing, can amplify oxidant accumulation initially triggered by virus infection (Fig. 1 and 2).
Although WT infection clearly triggers thiol depletion-related oxidative stress-induced cell death, thiol depletion and cell death are accelerated and amplified when the same cells are infected instead with ts1 (Fig. 1 and 7). The explanation for this difference between the effects of WT and ts1 may be due to structural differences in the envelope precursor proteins encoded by the two different viral genomes. A Val-25→Ile substitution in the ts1 mutant gPr80env is directly responsible for inefficient processing of gPr80env and for its ER retention and neurovirulence, compared to WT (71-73, 83).
WT virus replication exceeds ts1 replication at 24 and 48 hpi, but ts1 replication eventually exceeds WT replication by 72 hpi, indicating a late acceleration in the ts1 replication rate (Fig. 3A) (64). We suspect that the accumulation of gPr80env that occurs prior to 72 hpi in ts1-infected cells (but not in WT-infected cells) produces an environment that promotes viral replication in the ts1-infected cultures. Once this has occurred, this pattern is likely to be maintained at later times (3 to 4 days) after infection, producing higher relative virus titers in ts1-infected cultures than in WT-infected cultures (64).
With regard to this point, it may be relevant that virus titers are much higher in the ts1-infected mouse brain stem and spinal cord tissue than they are in the WT-infected CNS (84). Mechanisms responsible for this difference remain to be identified, but it may be due in part to a relatively higher level of H2O2 induced by ts1 infection in the CNS. In many cell types, intracellular H2O2 plays a role in stimulating cell proliferation. It is therefore possible that neurodegeneration and paralysis in ts1-infected mice are due to larger amounts of virus in the CNS and to more gPr80env accumulation in infected cells than in CNS tissues of WT-infected mice (79, 84).
Molecular chaperones such as GRP78 and GRP94 facilitate protein folding in the ER, and their upregulated expression is inducible under ER stress (35, 52). Caspase-12 is an ER stress-specific response protein elicited by protein accumulation in the ER membranes and disruption of ER Ca2+ homeostasis (48). The upregulation of CHOP/GADD153 as an ER stress response has also been implicated in retrovirus-induced protein accumulation and neurodegeneration (10). Recent studies from our laboratory confirm that ts1 infection also leads to the upregulation of GRP78 and CHOP/GADD153, as well as to activation of caspase-12, both in vitro and in vivo (32, 38). These results, together with the data presented here, strongly suggest that ER stress occurs in ts1-infected astrocytes.
We also suspect that ts1-induced protein accumulation and ER stress trigger Ca2+ release into the cytoplasm from intracellular stores, as demonstrated in other neurodegeneration models. Increased intracellular free Ca2+ is rapidly taken up by mitochondria through an energy- and oxygen-requiring process that collapses mitochondrial membrane potential, decreases ATP production, and may accelerate ROS production, resulting in cell death (21, 29, 55, 69). If this is the case, the increased ROS accumulation we observe in ts1-infected astrocytes, relative to that in WT-infected astrocytes, likely results from the ts1-specific protein accumulation in the ER of the infected cell (Fig. 8).
FIG. 8.

Hypothetical oxidative stress and antioxidant responses in ts1-infected astrocytes. In this schematic diagram, gPr80env retention in the ER initiates ER stress with Ca2+ release and subsequent Ca2+ overload-induced mitochondrial stress. This is followed by overproduction of ROS (H2O2) and decreased GSH content in the cells. ROS accumulation and GSH depletion then trigger the activation and nuclear translocation of Nrf-2, which activates transcription of genes having Nrf-2-binding ARE elements in their promoters. The upregulated products of these genes (xCT, γ-GCL, and GPx, here highlighted in gold) function to upregulate cystine uptake and GSH biosynthesis and activity. Antioxidant enzymes catalase, Cu/Zn SOD, and Mn SOD are not upregulated. CSSC, cystine; Glu, glutamate; γGluCys, γ-glutamylcysteine; Gly, glycine; GS, GSH synthetase; GSSG, oxidized form of GSH.
Nrf-2 mediates antioxidant defense responses to ts1 infection.
Astrocytes possess antioxidant defenses other than GSH, including catalase, Cu/Zn SOD, and Mn SOD. However, we observed no significant change in the amount of either Cu/Zn or Mn SOD under our ts1 infection conditions. Similarly, no upregulation of catalase, Cu/Zn SOD, or Mn SOD was observed under chemical thiol depletion, Nrf-2 overexpression, or after prooxidant or antioxidant treatment of Nrf-2-transfected cells. The antioxidant responses characteristic of ts1-infected astrocytes thus appear to be thiol specific (Fig. 8).
Antioxidant defenses in knockout mice lacking Nrf-2 are severely impaired, with decreased expression of ARE-dependent gene products in many cell types and reduced levels of GSH overall. However, overexpression of Nrf-2 following cDNA transfection into nrf2−/− cells normalizes their GSH levels and enables γ-GCLC and γ-GCLM transcription (3). It thus appears that Nrf-2 is intimately linked to cellular regulation of GSH biosynthesis, and it seems highly likely that the thiol depletion and oxidative stress following ts1 infection are responsible for the activation of Nrf-2 in infected cells, causing it to move into the nucleus and to upregulate the target proteins associated with thiol repletion and antioxidant defense (Fig. 4-6 and 8).
Although we observed depleted intra- and extracellular cysteine 24 h after ts1 infection, we also observed a rebound in intracellular cysteine at 48 and 72 hpi, along with upregulation in amounts of the xCT cystine antiporter (Fig. 1 and 4). This likely reflects elevated cystine uptake by upregulated xCT levels after ts1 infection. On the other hand, our results also show persistent GSH depletion over time in ts1-infected C1 cells, despite increases in intracellular cysteine and GSH biosynthesis machinery under ts1 infection (i.e., the xCT antiporter and γ-GCL) (Fig. 4). This seeming paradox may be due to the important role played by GSH in ROS detoxification, protein glutathionylation, and GSH-protective secretion under oxidative stress, as discussed above. Further studies of the extent of GSH depletion in ts1-infected astrocytes, in terms of the stress-response functions of GSH, are needed to resolve this question.
Thiol antioxidant defenses promote cell survival in ts1-infected astrocytes.
Oxidative stress signaling can induce programmed cell death, activate transcription, or stimulate cell proliferation (18, 51). The data in Fig. 7 show that mock-infected C1 cells cultured at normal or above-normal concentrations of cystine maintain normal viable cell numbers. However, cellular cystine/cysteine demand increases steeply when the same cells are infected with WT or ts1, and supplementation of cystine to 2.5- and 5-fold-higher levels, relative to normal concentrations, is necessary to protect ts1-infected cultures from cell death through 96 hpi (Fig. 7). Interestingly, this protection is incomplete. Cystine/cysteine availability is one of several determinants of cell survival in ts1-infected astrocytes. It is possible that when cystine oversupplementation causes downregulation of Nrf-2 and of the xCT cystine antiporter, it also slows cystine import (Fig. 4 and 5). Another possibility is that a thiol-independent cell death pathway may be at work. With ts1-infected mice, we have found that attempts to restore thiols after infection (by NAC treatment of the animals) delayed, but did not prevent, paralysis and death (40). Similar slowing of disease progression has been reported for human HAD patients treated with NAC (27, 41, 47, 56, 70).
In ts1-infected mice, some infected brain stem glial cells die following infection, as evidenced by astrocyte death and caspase-3 activation observed in CNS tissues from these animals (38). On the other hand, the same tissues contain cells that survive and proliferate, as evidenced by frank astrogliosis in brain stem sections (32, 67, 68). Since astrocytes in the CNS supply neighboring neurons with GSH and cysteine (16, 63, 78), ts1-induced thiol depletion and oxidative stress may kill these cells by overwhelming their antioxidant defenses.
If this is the case, infected astrocytes will fail to provide adequate thiol antioxidant support to neurons. Restoring astrocyte antioxidant support to neurons, perhaps by mild oxidative stimulation of astrocyte antioxidant defense mechanisms, may serve to protect both astrocytes and neurons against stressors such as ts1 infection. It has been reported that chemical activation of Nrf-2-driven GSH synthesis pathways in cultured astrocytes protects nearby neurons in coculture from oxidative stress (63). Thus, further in vivo studies characterizing glial cells and their capacity for thiol antioxidant defense are warranted to understand ts1-induced neuropathogenesis.
Many similarities exist between ts1 infection and other neurodegenerative diseases, such as HAD, Huntington's disease, Alzheimer's disease, Parkinson's disease, and amyotrophic lateral sclerosis (28, 74). Protein accumulation, oxidative stress, and neuronal and astrocytic degeneration are now known to be generally present in such conditions, with astrogliosis consistently occurring as a secondary event (28, 74, 76). Further studies of key pathways regulating thiol redox status in both astrocytes and neurons may identify new targets for therapeutic intervention in these viral and nonviral neurodegenerative diseases.
ADDENDUM IN PROOF
After this paper was accepted, work by Dimcheff et al. (D.E. Dimcheff, M.A. Faasse, F.J. McAtee, and J.L. Portis, J. Biol. Chem. 279:33782-33790, 2004) demonstrated for another murine retrovirus (FrCasE) that viral envelope protein misfolding is associated with ER stress responses in cultured cells and with brainstem spongiform encephalopathy in infected animals. These important findings are consistent with those reported here, which link specific oxidative stress response pathways to abnormal viral envelope protein processing in cultured primary astrocytes and astrocytic cells infected with ts1. Together these results from two different viruses implicate viral envelope protein misfolding, ER stress, and oxidative stress as sequential events leading to neurodegeneration in infected mice.
Acknowledgments
We thank Vanessa Edwards for her excellent assistance in preparing the manuscript and Lifang Zhang for her generous technical assistance. Kent Claypool provided invaluable help with flow cytometry analysis, and Guoyao Wu and Wene Yan (Texas A&M University) provided HPLC expertise. We thank Terrance Kavanagh (University of Washington, Seattle) for the generous gift of anti-γ-GCLC and anti-γ-GCLM antibodies. We also thank Timothy Dalton for kindly supplying Gclm−/− mouse tissues and Timothy Murphy (University of British Columbia, Vancouver, Canada) and Shiro Bannai (University of Tsukuba, Tsukuba, Ibaraki, Japan) for generous gifts of mouse xCT expression plasmids.
This work was supported in part by NIH grants MH71583 and NS43984 (to P.K.Y.W.) and NIEHS center grant ES07784 and core grant CA16672.
REFERENCES
- 1.Bannai, S. 1984. Transport of cystine and cysteine in mammalian cells. Biochim. Biophys. Acta 779:289-306. [DOI] [PubMed] [Google Scholar]
- 2.Bedogni, B., G. Pani, R. Colavitti, A. Riccio, S. Borrello, M. Murphy, R. Smith, M. L. Eboli, and T. Galeotti. 2003. Redox regulation of cAMP-responsive element-binding protein and induction of manganous superoxide dismutase in nerve growth factor-dependent cell survival. J. Biol. Chem. 278:16510-16519. [DOI] [PubMed] [Google Scholar]
- 3.Chan, J. Y., and M. Kwong. 2000. Impaired expression of glutathione synthetic enzyme genes in mice with targeted deletion of the Nrf2 basic-leucine zipper protein. Biochim. Biophys. Acta 1517:19-26. [DOI] [PubMed] [Google Scholar]
- 4.Choi, J., R. M. Liu, R. K. Kundu, F. Sangiorgi, W. Wu, R. Maxson, and H. J. Forman. 2000. Molecular mechanism of decreased glutathione content in human immunodeficiency virus type 1 Tat-transgenic mice. J. Biol. Chem. 275:3693-3698. [DOI] [PubMed] [Google Scholar]
- 5.Christensen, H. N. 1990. Role of amino acid transport and countertransport in nutrition and metabolism. Physiol. Rev. 70:43-77. [DOI] [PubMed] [Google Scholar]
- 6.Ciriolo, M. R., A. T. Palamara, S. Incerpi, E. Lafavia, M. C. Bue, P. De Vito, E. Garaci, and G. Rotilio. 1997. Loss of GSH, oxidative stress, and decrease of intracellular pH as sequential steps in viral infection. J. Biol. Chem. 272:2700-2708. [DOI] [PubMed] [Google Scholar]
- 7.Clark, S., J. Duggan, and J. Chakraborty. 2001. tsl and LP-BM5: a comparison of two murine retrovirus models for HIV. Viral Immunol. 14:95-109. [DOI] [PubMed] [Google Scholar]
- 8.Dalton, T. P., M. Z. Dieter, Y. Yang, H. G. Shertzer, and D. W. Nebert. 2000. Knockout of the mouse glutamate cysteine ligase catalytic subunit (Gclc) gene: embryonic lethal when homozygous, and proposed model for moderate glutathione deficiency when heterozygous. Biochem. Biophys. Res. Commun. 279:324-329. [DOI] [PubMed] [Google Scholar]
- 9.Desagher, S., J. Glowinski, and J. Premont. 1996. Astrocytes protect neurons from hydrogen peroxide toxicity. J. Neurosci. 16:2553-2562. [DOI] [PMC free article] [PubMed] [Google Scholar]
- 10.Dimcheff, D. E., S. Askovic, A. H. Baker, C. Johnson-Fowler, and J. L. Portis. 2003. Endoplasmic reticulum stress is a determinant of retrovirus-induced spongiform neurodegeneration. J. Virol. 77:12617-12629. [DOI] [PMC free article] [PubMed] [Google Scholar]
- 11.Dringen, R. 2000. Glutathione metabolism and oxidative stress in neurodegeneration. Eur. J. Biochem. 267:4903. [DOI] [PubMed] [Google Scholar]
- 12.Dringen, R. 2000. Metabolism and functions of glutathione in brain. Prog. Neurobiol. 62:649-671. [DOI] [PubMed] [Google Scholar]
- 13.Dringen, R., J. M. Gutterer, and J. Hirrlinger. 2000. Glutathione metabolism in brain metabolic interaction between astrocytes and neurons in the defense against reactive oxygen species. Eur. J. Biochem. 267:4912-4916. [DOI] [PubMed] [Google Scholar]
- 14.Dringen, R., and B. Hamprecht. 1997. Involvement of glutathione peroxidase and catalase in the disposal of exogenous hydrogen peroxide by cultured astroglial cells. Brain Res. 759:67-75. [DOI] [PubMed] [Google Scholar]
- 15.Dringen, R., and J. Hirrlinger. 2003. Glutathione pathways in the brain. Biol. Chem. 384:505-516. [DOI] [PubMed] [Google Scholar]
- 16.Dringen, R., L. Kussmaul, J. M. Gutterer, J. Hirrlinger, and B. Hamprecht. 1999. The glutathione system of peroxide detoxification is less efficient in neurons than in astroglial cells. J. Neurochem. 72:2523-2530. [DOI] [PubMed] [Google Scholar]
- 17.Eck, H. P., H. Gmunder, M. Hartmann, D. Petzoldt, V. Daniel, and W. Droge. 1989. Low concentrations of acid-soluble thiol (cysteine) in the blood plasma of HIV-1-infected patients. Biol. Chem. Hoppe-Seyler 370:101-108. [DOI] [PubMed] [Google Scholar]
- 18.Forman, H. J., and D. A. Dickinson. 2003. Oxidative signaling and glutathione synthesis. Biofactors 17:1-12. [DOI] [PubMed] [Google Scholar]
- 19.Gething, M. J., and J. Sambrook. 1992. Protein folding in the cell. Nature 355:33-45. [DOI] [PubMed] [Google Scholar]
- 20.Ghezzi, P., B. Romines, M. Fratelli, I. Eberini, E. Gianazza, S. Casagrande, T. Laragione, M. Mengozzi, and L. A. Herzenberg. 2002. Protein glutathionylation: coupling and uncoupling of glutathione to protein thiol groups in lymphocytes under oxidative stress and HIV infection. Mol. Immunol. 38:773-780. [DOI] [PubMed] [Google Scholar]
- 21.Gordeeva, A. V., R. A. Zvyagilskaya, and Y. A. Labas. 2003. Cross-talk between reactive oxygen species and calcium in living cells. Biochemistry (Moscow) 68:1077-1080. [DOI] [PubMed] [Google Scholar]
- 22.Han, D., R. Canali, D. Rettori, and N. Kaplowitz. 2003. Effect of glutathione depletion on sites and topology of superoxide and hydrogen peroxide production in mitochondria. Mol. Pharmacol. 64:1136-1144. [DOI] [PubMed] [Google Scholar]
- 23.Ishii, T., K. Itoh, S. Takahashi, H. Sato, T. Yanagawa, Y. Katoh, S. Bannai, and M. Yamamoto. 2000. Transcription factor Nrf2 coordinately regulates a group of oxidative stress-inducible genes in macrophages. J. Biol. Chem. 275:16023-16029. [DOI] [PubMed] [Google Scholar]
- 24.Itoh, K., N. Wakabayashi, Y. Katoh, T. Ishii, K. Igarashi, J. D. Engel, and M. Yamamoto. 1999. Keap1 represses nuclear activation of antioxidant responsive elements by Nrf2 through binding to the amino-terminal Neh2 domain. Genes Dev. 13:76-86. [DOI] [PMC free article] [PubMed] [Google Scholar]
- 25.Itoh, K., N. Wakabayashi, Y. Katoh, T. Ishii, T. O'Connor, and M. Yamamoto. 2003. Keap1 regulates both cytoplasmic-nuclear shuttling and degradation of Nrf2 in response to electrophiles. Genes Cells 8:379-391. [DOI] [PubMed] [Google Scholar]
- 26.Jaiswal, A. K. 2000. Regulation of genes encoding NAD(P)H:quinone oxidoreductases. Free Radic. Biol. Med. 29:254-262. [DOI] [PubMed] [Google Scholar]
- 27.James, J. S. 1996. NAC: first controlled trial, positive results. AIDS Treat. News 250:1-3. [PubMed] [Google Scholar]
- 28.Jellinger, K. A. 2003. General aspects of neurodegeneration. J. Neural Transm. Suppl. 65:101-144. [DOI] [PubMed] [Google Scholar]
- 29.Jeong, J. I., Y. W. Lee, and Y. K. Kim. 2003. Chemical hypoxia-induced cell death in human glioma cells: role of reactive oxygen species, ATP depletion, mitochondrial damage and Ca2+. Neurochem. Res. 28:1201-1211. [DOI] [PubMed] [Google Scholar]
- 30.Juurlink, B. H. 1999. Management of oxidative stress in the CNS: the many roles of glutathione. Neurotox. Res. 1:119-140. [DOI] [PubMed] [Google Scholar]
- 31.Kaufman, R. J. 1999. Stress signaling from the lumen of the endoplasmic reticulum: coordination of gene transcriptional and translational controls. Genes Dev. 13:1211-1233. [DOI] [PubMed] [Google Scholar]
- 32.Kim, H. T., K. Waters, G. Stoica, W. Qiang, N. Liu, V. L. Scofield, and P. K. Y. Wong. 2004. Activation of endoplasmic reticulum stress signaling pathway is associated with neuronal degeneration in MoMuLV-ts1-induced spongiform encephalomyelopathy. Lab. Investig. 84:816-827. [DOI] [PubMed] [Google Scholar]
- 33.Krapfenbauer, K., E. Engidawork, N. Cairns, M. Fountoulakis, and G. Lubec. 2003. Aberrant expression of peroxiredoxin subtypes in neurodegenerative disorders. Brain Res. 967:152-160. [DOI] [PubMed] [Google Scholar]
- 34.LeBel, C. P., S. F. Ali, M. McKee, and S. C. Bondy. 1990. Organometal-induced increases in oxygen reactive species: the potential of 2′,7′-dichlorofluorescin diacetate as an index of neurotoxic damage. Toxicol. Appl. Pharmacol. 104:17-24. [DOI] [PubMed] [Google Scholar]
- 35.Lee, A. S. 2001. The glucose-regulated proteins: stress induction and clinical applications. Trends Biochem. Sci. 26:504-510. [DOI] [PubMed] [Google Scholar]
- 36.Lee, J. M., M. J. Calkins, K. Chan, Y. W. Kan, and J. A. Johnson. 2003. Identification of the NF-E2-related factor-2-dependent genes conferring protection against oxidative stress in primary cortical astrocytes using oligonucleotide microarray analysis. J. Biol. Chem. 278:12029-12038. [DOI] [PubMed] [Google Scholar]
- 37.Lin, Y. C., C. W. Chow, P. H. Yuen, W. S. Lynn, and P. K. Y. Wong. 1997. Establishment and characterization of conditionally immortalized astrocytes to study their interaction with ts1, a neuropathogenic mutant of Moloney murine leukemia virus. J. Neurovirol. 3:28-37. [DOI] [PubMed] [Google Scholar]
- 38.Liu, N., X. Kuang, H.-T. Kim, G. Stoica, W. Qiang, V. L. Scofield, and P. K. Y. Wong. 2004. Possible involvement of both endoplasmic reticulum-and mitochondria-dependent pathways in MoMuLV-ts1-induced apoptosis in astrocytes. J. Neurovirol. 10:189-198. [DOI] [PubMed] [Google Scholar]
- 39.Lu, S. C. 1998. Regulation of hepatic glutathione synthesis. Semin. Liver Dis. 18:331-343. [DOI] [PubMed] [Google Scholar]
- 40.Lynn, W. S., and P. K. Y. Wong. 1998. Neuroimmunopathogenesis of ts1 MoMuLV infection. Neuroimmunomodulation 5:248-260. [DOI] [PubMed] [Google Scholar]
- 41.Malorni, W., R. Rivabene, B. M. Lucia, R. Ferrara, A. M. Mazzone, R. Cauda, and R. Paganelli. 1998. The role of oxidative imbalance in progression to AIDS: effect of the thiol supplier N-acetylcysteine. AIDS Res. Hum. Retrovir. 14:1589-1596. [DOI] [PubMed] [Google Scholar]
- 42.McClung, C. R. 1997. Regulation of catalases in Arabidopsis. Free Radic. Biol. Med. 23:489-496. [DOI] [PubMed] [Google Scholar]
- 43.McMahon, M., K. Itoh, M. Yamamoto, and J. D. Hayes. 2003. Keap1-dependent proteasomal degradation of transcription factor Nrf2 contributes to the negative regulation of antioxidant response element-driven gene expression. J. Biol. Chem. 278:21592-21600. [DOI] [PubMed] [Google Scholar]
- 44.Misra, I., and O. W. Griffith. 1998. Expression and purification of human gamma-glutamylcysteine synthetase. Protein Expr. Purif. 13:268-276. [DOI] [PubMed] [Google Scholar]
- 45.Moi, P., K. Chan, I. Asunis, A. Cao, and Y. W. Kan. 1994. Isolation of NF-E2-related factor 2 (Nrf2), a NF-E2-like basic leucine zipper transcriptional activator that binds to the tandem NF-E2/AP1 repeat of the beta-globin locus control region. Proc. Natl. Acad. Sci. USA 91:9926-9930. [DOI] [PMC free article] [PubMed] [Google Scholar]
- 46.Mollace, V., H. S. Nottet, P. Clayette, M. C. Turco, C. Muscoli, D. Salvemini, and C. F. Perno. 2001. Oxidative stress and neuroAIDS: triggers, modulators and novel antioxidants. Trends Neurosci. 24:411-416. [DOI] [PubMed] [Google Scholar]
- 47.Muller, F., A. M. Svardal, I. Nordoy, R. K. Berge, P. Aukrust, and S. S. Froland. 2000. Virological and immunological effects of antioxidant treatment in patients with HIV infection. Eur. J. Clin. Investig. 30:905-914. [DOI] [PubMed] [Google Scholar]
- 48.Nakagawa, T., H. Zhu, N. Morishima, E. Li, J. Xu, B. A. Yankner, and J. Yuan. 2000. Caspase-12 mediates endoplasmic-reticulum-specific apoptosis and cytotoxicity by amyloid-β. Nature 403:98-103. [DOI] [PubMed] [Google Scholar]
- 49.Nakamura, H., H. Masutani, and J. Yodoi. 2002. Redox imbalance and its control in HIV infection. Antioxid. Redox Signal. 4:455-464. [DOI] [PubMed] [Google Scholar]
- 50.Nguyen, T., P. J. Sherratt, H. C. Huang, C. S. Yang, and C. B. Pickett. 2003. Increased protein stability as a mechanism that enhances Nrf2-mediated transcriptional activation of the antioxidant response element. Degradation of Nrf2 by the 26 S proteasome. J. Biol. Chem. 278:4536-4541. [DOI] [PubMed] [Google Scholar]
- 51.Owuor, E. D., and A. N. Kong. 2002. Antioxidants and oxidants regulated signal transduction pathways. Biochem. Pharmacol. 64:765-770. [DOI] [PubMed] [Google Scholar]
- 52.Paschen, W. 2000. Role of calcium in neuronal cell injury: which subcellular compartment is involved? Brain Res. Bull. 53:409-413. [DOI] [PubMed] [Google Scholar]
- 53.Prestera, T., and P. Talalay. 1995. Electrophile and antioxidant regulation of enzymes that detoxify carcinogens. Proc. Natl. Acad. Sci. USA 92:8965-8969. [DOI] [PMC free article] [PubMed] [Google Scholar]
- 54.Qi, X., J. Guy, H. Nick, J. Valentine, and N. Rao. 1997. Increase of manganese superoxide dismutase, but not of Cu/Zn-SOD, in experimental optic neuritis. Investig. Ophthalmol. Vis. Sci. 38:1203-1212. [PubMed] [Google Scholar]
- 55.Rego, A. C., and C. R. Oliveira. 2003. Mitochondrial dysfunction and reactive oxygen species in excitotoxicity and apoptosis: implications for the pathogenesis of neurodegenerative diseases. Neurochem. Res. 28:1563-1574. [DOI] [PubMed] [Google Scholar]
- 56.Roederer, M., S. W. Ela, F. J. Staal, and L. A. Herzenberg. 1992. N-acetylcysteine: a new approach to anti-HIV therapy. AIDS Res. Hum. Retrovir. 8:209-217. [DOI] [PubMed] [Google Scholar]
- 57.Sagara, J., N. Makino, and S. Bannai. 1996. Glutathione efflux from cultured astrocytes. J. Neurochem. 66:1876-1881. [DOI] [PubMed] [Google Scholar]
- 58.Sasaki, H., H. Sato, K. Kuriyama-Matsumura, K. Sato, K. Maebara, H. Wang, M. Tamba, K. Itoh, M. Yamamoto, and S. Bannai. 2002. Electrophile response element-mediated induction of the cystine/glutamate exchange transporter gene expression. J. Biol. Chem. 277:44765-44771. [DOI] [PubMed] [Google Scholar]
- 59.Sato, H., M. Tamba, T. Ishii, and S. Bannai. 1999. Cloning and expression of a plasma membrane cystine/glutamate exchange transporter composed of two distinct proteins. J. Biol. Chem. 274:11455-11458. [DOI] [PubMed] [Google Scholar]
- 60.Schiavone, J. R., and H. M. Hassan. 1988. An assay for the detection of superoxide dismutase in individual Escherichia coli colonies. Anal. Biochem. 168:455-461. [DOI] [PubMed] [Google Scholar]
- 61.Sen, C. K., and L. Packer. 1996. Antioxidant and redox regulation of gene transcription. FASEB J. 10:709-720. [DOI] [PubMed] [Google Scholar]
- 62.Shang, F., M. Lu, E. Dudek, J. Reddan, and A. Taylor. 2003. Vitamin C and vitamin E restore the resistance of GSH-depleted lens cells to H2O2. Free Radic. Biol. Med. 34:521-530. [DOI] [PubMed] [Google Scholar]
- 63.Shih, A. Y., D. A. Johnson, G. Wong, A. D. Kraft, L. Jiang, H. Erb, J. A. Johnson, and T. H. Murphy. 2003. Coordinate regulation of glutathione biosynthesis and release by Nrf2-expressing glia potently protects neurons from oxidative stress. J. Neurosci. 23:3394-3406. [DOI] [PMC free article] [PubMed] [Google Scholar]
- 64.Shikova, E., Y. C. Lin, K. Saha, B. R. Brooks, and P. K. Wong. 1993. Correlation of specific virus-astrocyte interactions and cytopathic effects induced by ts1, a neurovirulent mutant of Moloney murine leukemia virus. J. Virol. 67:1137-1147. [DOI] [PMC free article] [PubMed] [Google Scholar]
- 65.Shull, S., N. H. Heintz, M. Periasamy, M. Manohar, Y. M. Janssen, J. P. Marsh, and B. T. Mossman. 1991. Differential regulation of antioxidant enzymes in response to oxidants. J. Biol. Chem. 266:24398-24403. [PubMed] [Google Scholar]
- 66.Solis, W. A., T. P. Dalton, M. Z. Dieter, S. Freshwater, J. M. Harrer, L. He, H. G. Shertzer, and D. W. Nebert. 2002. Glutamate-cysteine ligase modifier subunit: mouse Gclm gene structure and regulation by agents that cause oxidative stress. Biochem. Pharmacol. 63:1739-1754. [DOI] [PubMed] [Google Scholar]
- 67.Stoica, G., O. Illanes, S. I. Tasca, and P. K. Y. Wong. 1993. Temporal central and peripheral nervous system changes induced by a paralytogenic mutant of Moloney murine leukemia virus TB. Lab. Investig. 66:427-436. [PubMed] [Google Scholar]
- 68.Stoica, G., S. I. Tasca, and P. K. Y. Wong. 2000. Motor neuronal loss and neurofilament-ubiquitin alteration in MoMuLV-ts1 encephalopathy. Acta Neuropathol. (Berlin) 99:238-244. [DOI] [PubMed] [Google Scholar]
- 69.Suen, K. C., K. F. Lin, W. Elyaman, K. F. So, R. C. Chang, and J. Hugon. 2003. Reduction of calcium release from the endoplasmic reticulum could only provide partial neuroprotection against beta-amyloid peptide toxicity. J. Neurochem. 87:1413-1426. [DOI] [PubMed] [Google Scholar]
- 70.Sung, J. H., S. A. Shin, H. K. Park, R. C. Montelaro, and Y. H. Chong. 2001. Protective effect of glutathione in HIV-1 lytic peptide 1-induced cell death in human neuronal cells. J. Neurovirol. 7:454-465. [DOI] [PubMed] [Google Scholar]
- 71.Szurek, P. F., E. Floyd, P. H. Yuen, and P. K. Y. Wong. 1990. Site-directed mutagenesis of the codon for Ile-25 in gPr80env alters the neurovirulence of ts1, a mutant of Moloney murine leukemia virus TB. J. Virol. 64:5241-5249. [DOI] [PMC free article] [PubMed] [Google Scholar]
- 72.Szurek, P. F., P. H. Yuen, J. K. Ball, and P. K. Y. Wong. 1990. A Val-25-to-Ile substitution in the envelope precursor polyprotein, gPr80env, is responsible for the temperature sensitivity, inefficient processing of gPr80env, and neurovirulence of ts1, a mutant of Moloney murine leukemia virus TB. J. Virol. 64:467-475. [DOI] [PMC free article] [PubMed] [Google Scholar]
- 73.Szurek, P. F., P. H. Yuen, R. Jerzy, and P. K. Y. Wong. 1988. Identification of point mutations in the envelope gene of Moloney murine leukemia virus TB temperature-sensitive paralytogenic mutant ts1: molecular determinants for neurovirulence. J. Virol. 62:357-360. [DOI] [PMC free article] [PubMed] [Google Scholar]
- 74.Taylor, J. P., J. Hardy, and K. H. Fischbeck. 2002. Toxic proteins in neurodegenerative disease. Science 296:1991-1995. [DOI] [PubMed] [Google Scholar]
- 75.Thompson, S. A., C. C. White, C. M. Krejsa, D. Diaz, J. S. Woods, D. L. Eaton, and T. J. Kavanagh. 1999. Induction of glutamate-cysteine ligase (gamma-glutamylcysteine synthetase) in the brains of adult female mice subchronically exposed to methylmercury. Toxicol. Lett. 110:1-9. [DOI] [PubMed] [Google Scholar]
- 76.Townsend, D. M., K. D. Tew, and H. Tapiero. 2003. The importance of glutathione in human disease. Biomed. Pharmacother. 57:145-155. [DOI] [PMC free article] [PubMed] [Google Scholar]
- 77.Wang, M., J. M. Howell, J. E. Libbey, J. A. Tainer, and R. S. Fujinami. 2003. Manganese superoxide dismutase induction during measles virus infection. J. Med. Virol. 70:470-474. [DOI] [PubMed] [Google Scholar]
- 78.Wang, X. F., and M. S. Cynader. 2000. Astrocytes provide cysteine to neurons by releasing glutathione. J. Neurochem. 74:1434-1442. [DOI] [PubMed] [Google Scholar]
- 79.Wong, P. K. Y., C. Knupp, P. H. Yuen, M. M. Soong, J. F. Zachary, and W. A. Tompkins. 1985. ts1, a paralytogenic mutant of Moloney murine leukemia virus TB, has an enhanced ability to replicate in the central nervous system and primary nerve cell culture. J. Virol. 55:760-767. [DOI] [PMC free article] [PubMed] [Google Scholar]
- 80.Wong, P. K. Y., W. S. Lynn, Y. C. Lin, W. Choe, and P. H. Yuen. 1998. ts1 MoMuLV: a murine model of neuroimmunodegeneration, p. 75-93. In P. K. Y. Wong and W. S. Lynn (ed.), Neuroimmunodegeneration. R. G. Landes, Austin, Tex.
- 81.Wong, P. K. Y., M. M. Soong, and P. H. Yuen. 1981. Replication of murine leukemia virus in heterologous cells: interaction between ecotropic and xenotropic virus. Virology 109:366-378. [DOI] [PubMed] [Google Scholar]
- 82.Wu, G., P. K. Davis, N. E. Flynn, D. A. Knabe, and J. T. Davidson. 1997. Endogenous synthesis of arginine plays an important role in maintaining arginine homeostasis in postweaning growing pigs. J. Nutr. 127:2342-2349. [DOI] [PubMed] [Google Scholar]
- 83.Yuen, P. H., E. Tzeng, C. Knupp, and P. K. Y. Wong. 1986. The neurovirulent determinants of ts1, a paralytogenic mutant of Moloney murine leukemia virus TB, are localized in at least two functionally distinct regions of the genome. J. Virol. 59:59-65. [DOI] [PMC free article] [PubMed] [Google Scholar]
- 84.Zachary, J. F., C. J. Knupp, and P. K. Y. Wong. 1986. Noninflammatory spongiform polioencephalomyelopathy caused by a neurotropic temperature-sensitive mutant of Moloney murine leukemia virus TB. Am. J. Pathol. 124:457-468. [PMC free article] [PubMed] [Google Scholar]