Abstract
High-throughput gene expression analysis has become a frequent and powerful research tool in biology. At present, however, few software applications have been developed for biologists to query large microarray gene expression databases using a Web-browser interface. We present GENEVESTIGATOR, a database and Web-browser data mining interface for Affymetrix GeneChip data. Users can query the database to retrieve the expression patterns of individual genes throughout chosen environmental conditions, growth stages, or organs. Reversely, mining tools allow users to identify genes specifically expressed during selected stresses, growth stages, or in particular organs. Using GENEVESTIGATOR, the gene expression profiles of more than 22,000 Arabidopsis genes can be obtained, including those of 10,600 currently uncharacterized genes. The objective of this software application is to direct gene functional discovery and design of new experiments by providing plant biologists with contextual information on the expression of genes. The database and analysis toolbox is available as a community resource at https://www.genevestigator.ethz.ch.
A major challenge in biology today is the large-scale determination of gene function (Boyes et al., 2001). First, the establishment of standards and controlled vocabularies facilitates the integration of experimental data into a computational framework, thereby allowing structured and systematic processing of information (Ashburner et al., 2000; Brazma et al., 2001). Second, structured databases and data querying tools provide the means to assign putative functional information to genes.
The complete sequencing of the Arabidopsis genome achieved in the year 2000 (The Arabidopsis Genome Initiative, 2000) enables us to monitor gene expression of this flowering plant on a genome-scale using microarrays. In situ synthesis of high-density oligonucleotides on glass slides (Lockhart et al., 1996) has become a powerful tool to rapidly integrate the sequence knowledge into expression profiling platforms, such as the ATH1 full genome array developed by Affymetrix and The Institute for Genomic Research (TIGR), which represents approximately 23,750 genes from Arabidopsis (Redman et al., 2004). The availability of a full-genome array and the complete technical environment provided by the Affymetrix system led to a wide use of the GeneChip technology in the plant community. Thousands of arrays have since been processed, of which a significant number are publicly available through services and repositories such as Nottingham Arabidopsis Stock Centre Transcriptomics Service (NASCArrays; Craigon et al., 2004), ArrayExpress at the European Bioinformatics Institute (EBI; Brazma et al., 2003), or Gene Expression Omnibus (GEO) at the National Center for Biotechnology Information (NCBI; Edgar et al., 2002).
The exploitation of large-scale gene expression datasets, mainly from Saccharomyces cerevisiae and Escherichia coli, has already led to the discovery of global structures governing metabolic and regulatory networks (Lee et al., 2002; Ravasz et al., 2002; Stelling et al., 2002; Ihmels et al., 2004). Multiple-genome comparisons have also yielded interesting observations on the modularity and connectivity distributions of gene expression data (Bergmann et al., 2004). Nevertheless, the combination of multiple datasets still raises a number of questions concerning their compatibility, in particular when comparing data from different platforms and organisms. While analyses revealing global properties of networks or modules may not necessarily require full compatibility of expression datasets, the details are often noisy (Friedman, 2004) and the comparative search for the function of individual genes requires a more stringent selection.
The Affymetrix platform provides a standardized system with a high degree of reproducibility (Hennig et al., 2003; Redman et al., 2004). Although data from different experiments may not be pooled for a rigorous expression profiling analysis, one can assume that the large-scale combination and analysis of expression data from a single organism using a single platform like the Affymetrix system allows the identification of biologically meaningful expression patterns of individual genes. To date, few tools have been developed for biologists to query large gene expression databases. The Yeast Microarray Global Viewer (yMGV) is a database providing online tools for the analysis of transcriptional expression profiles of yeast genes among 82 different datasets (Lelandais et al., 2004). In the plant community, NASCArrays (Craigon et al., 2004) provides a repository for Arabidopsis microarray data and some simple “gene-centric” data mining tools.
Here, we describe a novel online tool called GENEVESTIGATOR comprising a gene expression database and a number of querying and analysis functionalities developed to facilitate gene functional discovery. GENEVESTIGATOR allows the data to be presented in the context of plant development, plant organ, and environmental conditions, both for individual genes or for families of genes, thereby answering questions such as “in which growth stage is my gene of interest expressed?” or “which genes are specifically expressed in roots?” The main objective of the software is to assign contextual information to gene expression data, directing the design of new experiments and gene functional discovery.
RESULTS
Database Concept and Software Design
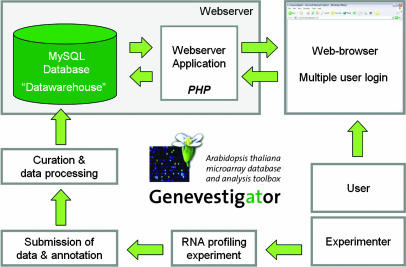
GENEVESTIGATOR was conceived as a user-friendly online tool for large-scale expression data analysis. It consists of a MySQL relational database and a Web server application programmed in the PHP (PHP Hypertext Preprocessor) scripting language. The database works as a “data warehouse” containing experimental and annotation data, preprocessed data, as well as diverse tables for control of workflow and analysis (Fig. 1).
Figure 1.
Concept and design of GENEVESTIGATOR. The experimenter submits RNA profiling data to the database curator, who processes the data and uploads it to the database. The datawarehouse contains raw signal intensity and P values, as well as preprocessed tables. A Webserver application acts as an interface between users and the GENEVESTIGATOR database.
Raw experimental data from users is processed using Affymetrix MAS 5.0 software to a target value (TGT) of 1,000 (Liu et al., 2002). Signal intensities and P values are collected for each hybridized Affymetrix GeneChip array. Alternatively, data and annotation can be imported from public repositories such as ArrayExpress (Brazma et al., 2003) and GEO (Edgar et al., 2002). The assignment of array elements (probe sets) to Arabidopsis locus identifiers (AGI codes) and their annotations is based on regularly updated datasets obtained from the Arabidopsis Information Resource (TAIR) ftp server (ftp://ftp.arabidopsis.org/home/tair/Microarrays/Affymetrix/; currently as of April 5, 2004, based on the final Arabidopsis genome annotation release from TIGR [version 5.0, January 2004]). In addition to probe sets representing unique genes (ending “_at”), the ATH1 and AG GeneChip arrays include nonunique probe sets representing two or more closely related genes (ending “_s_at”) or multiple cross-hybridizing probe sets (ending “_x_at”; for details, see Redman et al., 2004). Although these probe set types represent two or more genes, only one locus identifier is displayed per probe set. These ambiguous probe sets are highlighted in GENEVESTIGATOR to draw the attention of the user to this issue.
The experiment annotation is curated, entered, and structured in either hierarchical (e.g. plant organs), unique (e.g. growth stage), or multi-select form (e.g. environmental condition). The software has been designed for easy additions of new annotations in any of these formats and for rapid creation of the corresponding tools to analyze and visualize the data. The annotation of arrays was based on the information provided by users or public repositories. Missing information does not impact the results, as the corresponding arrays are not included into the respective calculations. Ambiguous or unsuitable annotations were further ignored. For example, arrays from RNA extracted from whole adult plants (including roots, rosette leaves, and inflorescence) are unsuitable for tools relating to plant organ specificity (Gene Atlas) and are therefore not included into the corresponding calculations, but may be proper for use in other tools such as Gene Chronologer. Each tool therefore accesses the best respective available sources of data for processing, while unsuitable data is ignored.
Data from the ATH1 and AG arrays are processed separately. Different sets of oligonucleotide sequences are used to probe identical target genes on the two array types, and thus different efficiencies of target to probe hybridization and nontarget to probe cross-hybridization makes a direct comparison of signal intensities impossible. Although a high degree of reproducibility was found for most target genes probed by both the ATH1 and the AG arrays, 300 pairs of probe set for identical target genes yielded strongly differing results (Hennig et al., 2003).
As of July 2004, the database contained publicly available data from 750 ATH1 and 121 AG arrays covering 81 public experiments from the Gruissem Laboratory (http://www.pb.ethz.ch; Menges et al., 2003; Hennig et al., 2004; Kleffmann et al., 2004), the Functional Genomics Center Zurich (http://www.fgcz.ethz.ch), NASCArrays (http://ssbdjc2.nottingham.ac.uk/narrays/experimentbrowse.pl; Craigon et al., 2004), ArrayExpress at EBI (http://www.ebi.ac.uk/arrayexpress/; Brazma et al., 2003), and from GEO at NCBI (http://www.ncbi.nlm.nih.gov/geo/; Edgar et al., 2002).
GENEVESTIGATOR is freely accessible to all academic institutions. Since the database contains at present both publicly available as well as confidential data, we have implemented a dual user profile management system for public and private users. All users are therefore asked to register once and to login for each session. We limit the collection and use of personal information to what is necessary to administer the database and improve the utility of GENEVESTIGATOR. Personal information is not shared with third parties.
Analysis Tools
The GENEVESTIGATOR tools generally contain two types of queries: a gene-centric approach reporting signal intensity values for individual genes, and a genome-centric approach providing lists of genes fulfilling chosen criteria. The results obtained from any tool are based on all available signal intensity values and the corresponding annotations. In some cases, present/absent call information as defined by the MAS5.0 algorithm is indicated (see below).
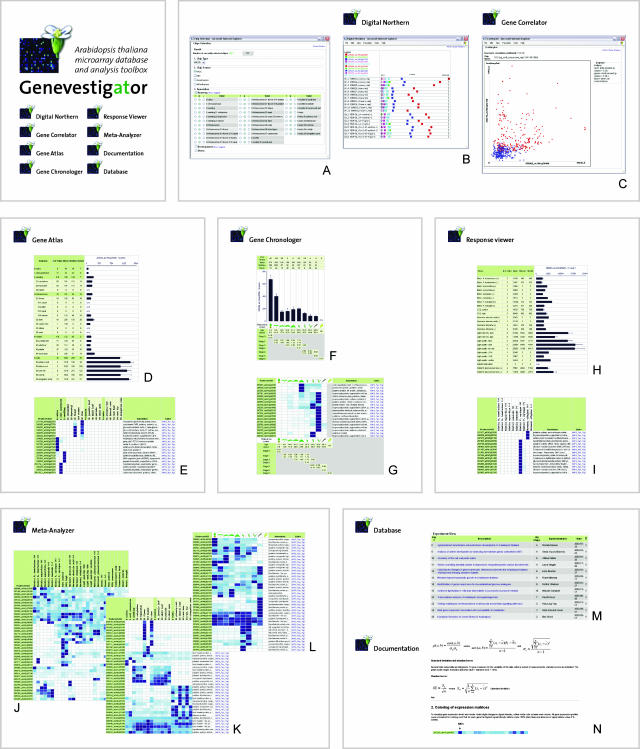
The first tool, Digital Northern, will retrieve the signal intensity values of input genes for a chosen selection of GeneChip experiments. An elaborate selection tool (Fig. 2A) allows the user to choose exactly those experiments that fit single or multiple criteria such as anatomy, growth stage, or environmental factors. Up to 10 probe sets can be processed simultaneously, displayed in several colors, shapes, and filling, revealing both signal intensity values and present call (closed symbols) and absent call (open symbols) information (Fig. 2B).
Figure 2.
Screenshots of some of the features of GENEVESTIGATOR. Top left, Logo and available tools. A, Chip Selection tool; B, Digital Northern; C, Gene Correlator; D and E, Gene Atlas (relates to plant anatomy); F and G, Gene Chronologer (relates to the plant growth stages); H and I, Response Viewer (relates to environmental factors); J to L, Meta-Analyzer (multiple gene analysis with respect to anatomy, growth stage, and environmental factors); M and N, Database tool for viewing experiment and array annotation, and Documentation section for user information.
The Gene Correlator allows comparing the signal intensity values of two genes throughout all chosen experiments (Fig. 2C; identical selection tool as for Digital Northern). Each spot represents a GeneChip and can be identified by mouse-over or by linking to the annotation database. The Pearson's correlation coefficient is given as a measure for the relationship between expression signals of two genes. Present call information is visualized by a color coding (Fig. 2C).
Because the objective of the software was to provide contextual information for the expression of genes, we additionally focused on relating gene expression to three main annotation groups: plant organ, developmental stage, and environmental stress.
The Gene Atlas tool similarly provides the average signal intensity values of a gene of interest in all organs or tissues annotated in the database (Fig. 2D). Reversely, GENEVESTIGATOR can output lists of genes for which signal intensities exceed a chosen threshold in selected organs versus a baseline choice of organs (Fig. 2E). This allows users to find genes expressed preferentially in certain organs or tissues, such as roots, young leaves or stamina. The anatomy annotation was based on standard anatomy terms as defined by the Plant Ontology Consortium (http://www.plantontology.org/) that we classified into six main groups (callus, cell suspension, seedling, inflorescence, rosette, and roots) and the corresponding subgroups. These categories cover all tissues that can currently be isolated for expression analysis, but can easily be extended as tissue and cell separation techniques become more precise (Birnbaum et al., 2003).
The Gene Chronologer tool, based on the Boyes growth stage ontology (Boyes et al., 2001), possesses two main features. First, it outputs the average signal intensities (or expression levels) and ses of a gene of interest for 10 representative sections of the life cycle of Arabidopsis (Fig. 2F). Second, users can query the database to output all genes expressed above a given threshold at chosen growth stages. For example, all genes can be selected for which the signal intensity at the seedling stage exceeds 90% of the sum of all average signal intensity values for each category, measured for this gene throughout the life cycle of the plant (Fig. 2G).
The Response Viewer tool provides the same functionalities as Gene Atlas and Gene Chronologer, based on stress response annotations (Fig. 2, H and I). For each condition, one or several representative experiments were chosen. Each stress factor is given with the corresponding control from these experiments, allowing direct comparison.
The Meta-Analyzer utility has been designed to study the gene expression profiles of several genes simultaneously in the context of environmental stresses, organs, and growth stages (Fig. 2, J–L). Lists of genes can be entered in diverse formats (comma-, semi-colon-, or space-separated, CRLF [carriage return, line feed], or directly copied from a spreadsheet). The output is a heat map of normalized signal intensity values (see Documentation section on our Web page) clustered by either single, average, or complete linkage hierarchical clustering. This tool is especially useful to compare members of gene families and to identify clusters of similarly expressed genes.
Finally, the Database and Documentation sections provide users with annotation information about experiments in the database, as well as technical information (Fig. 2, M and N). Since GENEVESTIGATOR was conceived to be an analysis tool and not a data repository, a reduced set of annotations is stored locally. The full MIAME (Minimum Information About a Microarray Experiment) compliant annotations (Brazma et al., 2001) are available by linking to the corresponding repository sites from which the experiments were downloaded.
General Approach and Validation
The database contains expression data from a high diversity of experiments covering different tissues, ages, and treatments (Table I). The general hypothesis in our approach is that as the number of experiments per category (e.g. growth stage 5.10) increases, individual effects are averaged out and global trends become visible. As a measure of confidence for the expression of genes in different categories, we indicate the respective number of GeneChips and the se of the mean for each category.
Table I.
Annotation categories incorporated in GENEVESTIGATOR as of July 2004
| Plant Tissues/Organs | Developmental Stages | Environmental Factors (Continued) |
|---|---|---|
| 0 Callus | 10 Categories based on the Boyes key ontology: | Hormones |
| 1 Cell suspension | A) 0.10 … 0.70 | Ethylene |
| 2 Seedling | B) 1.00 … 1.02 | Auxin |
| 21 Cotyledons | C) 1.03 … 1.05 | Abscisic acid |
| 22 Hypocotyl | D) 1.06 … 1.08 / 3.20 | Gibberellin |
| 23 Radicle | E) 1.09 … 1.12 / 3.50 | Atmosphere |
| 3 Inflorescence | F) 1.13 / 1.14 / 3.70 / 5.10 | Ozone |
| 31 Flower | G) 3.90 / 6.00 / 6.10 | Carbon dioxide |
| 311 Carpel | H) 6.30 / 6.50 | Illumination |
| 312 Petal | I) 6.90 / 8.00 | Light intensity |
| 313 Sepal | J) 9.70 | Light |
| 314 Stamen | Dark | |
| 315 Pedicel | Light quality | |
| 32 Silique | Far-red | |
| 33 Seed | Blue | |
| 34 Stem | UVA | |
| 35 Node | UVB | |
| 36 Shoot apex | Visible | |
| 37 Cauline leaf | ||
| 4 Rosette | ||
| 41 Juvenile leaf | Environmental Factors
|
Biotic interactions |
| 42 Adult leaf | Nutrients/heavy metals | Pseudomonas syringae |
| 43 Petiole | Phosphate | Gigaspora rosea |
| 44 Senescent leaf | Nitrate | Agrobacterium tumefaciens |
| 5 Roots | Sulfate | Heterodera schachtii |
| 51 Primary root | Potassium | Erisyphe cichoracearum |
| 52 Lateral root | Water | Programmed cell death |
| 53 Root hair | Suc/Glc | Senescence |
| 54 Root tip | Lead | Heat |
| 55 Elongation zone | Zinc | Cold |
To validate our hypothesis, we checked whether strongly populated categories yield results that are consistent with the literature. In a first step, we selected a number of marker genes with preferential expression in particular organs, at specific growth stages, or in response to certain stresses and then analyzed their expression patterns generated by GENEVESTIGATOR. Marker genes were chosen from the literature.
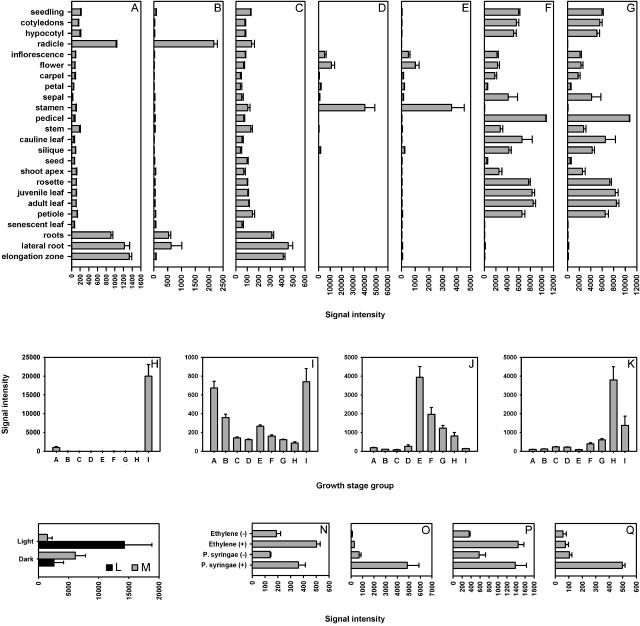
First, using Gene Atlas, three AGAMOUS-like genes known to be preferentially expressed in roots as measured by reverse transcription-PCR (AGL12 [At1g71692], AGL14 [At4g11880], and AGL17 [At2g22630]; Parenicova et al., 2003) in fact showed strong expression in roots and radicle, but weaker signals in all other organs (Fig. 3, A–C). Two genes associated with pollen tube growth (At1g55570, Albani et al., 1992; and At2g25600, Mouline et al., 2002) were also identified as being specific to stamina (and by extension to the categories “flower” and “inflorescence”) in our expression database (Fig. 3, D and E). Furthermore, two genes involved in photosynthesis (chlorophyll a/b binding proteins, At1g19150 and At3g08940) were found to be abundantly expressed in green plant tissues (rosette, cauline leaf, stem, node, flower, cotyledon, and hypocotyl), but lowly expressed in photosynthetically inactive tissues (roots, stamen, and seeds; Fig. 3, F and G). This pattern was observed for all genes from the chlorophyll a/b binding family except for one gene (TAIR; http://www.arabidopsis.org/info/genefamily/Chloroplast.html; see Supplemental Table II, available at www.plantphysiol.org).
Figure 3.
Validation of the quality of data generated by GENEVESTIGATOR. A to G, Expression of organ or tissue-specific marker genes used for testing the Gene Atlas tool (A, AGL12, At1g71692; B, AGL14, At4g11880; C, AGL17, At2g22630; D, At1g55570; E, At2g25600; F, At1g19150; G, At3g08940). H to K, Expression of growth stage specific marker genes used to validate the Gene Chronologer tool (H, ATEM1, At3g51810; I, At4g37580; J, APETALA1, At1g69120; K, FLOWERING LOCUS T, At1g65480). L to Q, Expression of environmental factor specific marker genes to validate the Response Viewer tool (L, At4g14690; M, At5g54190; N, ERF1, At3g23240; O, AtERF1, At4g17599; P, AtERF2, At5g47220; Q, AtERF13, At2g44840).
Second, to verify the reliability of the Gene Chronologer tool, we looked for genes annotated as being developmentally regulated. Two genes involved in seed germination and seedling development (encoding the embryonic abundant protein ATEM1 [AT3G51810, Vicient et al., 2000] and a gene involved in apical hook development [At4g37580, Lehman et al., 1996]) showed highest expression during mature seed and germination stages (Fig. 3, H and I), but lower levels in all other stages. In contrast, two genes involved in flowering (APETALA1 [At1g69120, Pelaz et al., 2001] and FLOWERING LOCUS T [At1g65480, Ruiz-Garcia et al., 1997]) were shown to be most abundantly expressed in the flowering stages (Fig. 3, J and K).
Third, the Response Viewer tool was used for several genes known to be responsive to particular stresses (Fig. 3, L–Q). GENEVESTIGATOR correctly showed the expression pattern of a light-induced gene encoding a light-harvesting chlorophyll a/b binding protein (AT4G14690, Jansson et al., 2000) and of the light-repressed protochlorophyllide reductase A gene (At5g54190, Runge et al., 1996; Fig. 3, L and M, respectively). Similarly, four genes reported to be responsive to ethylene (ERF1 [At3g23240]; AtERF1 [At4g17500]; AtERF2 [At5g47220]; and AtERF13 [At2g44840]) were correctly found by the software to be responsive to ethylene and to the pathogen Pseudomonas syringae, as reported by the authors (Onate-Sanchez and Singh, 2002; Fig. 3, N–Q).
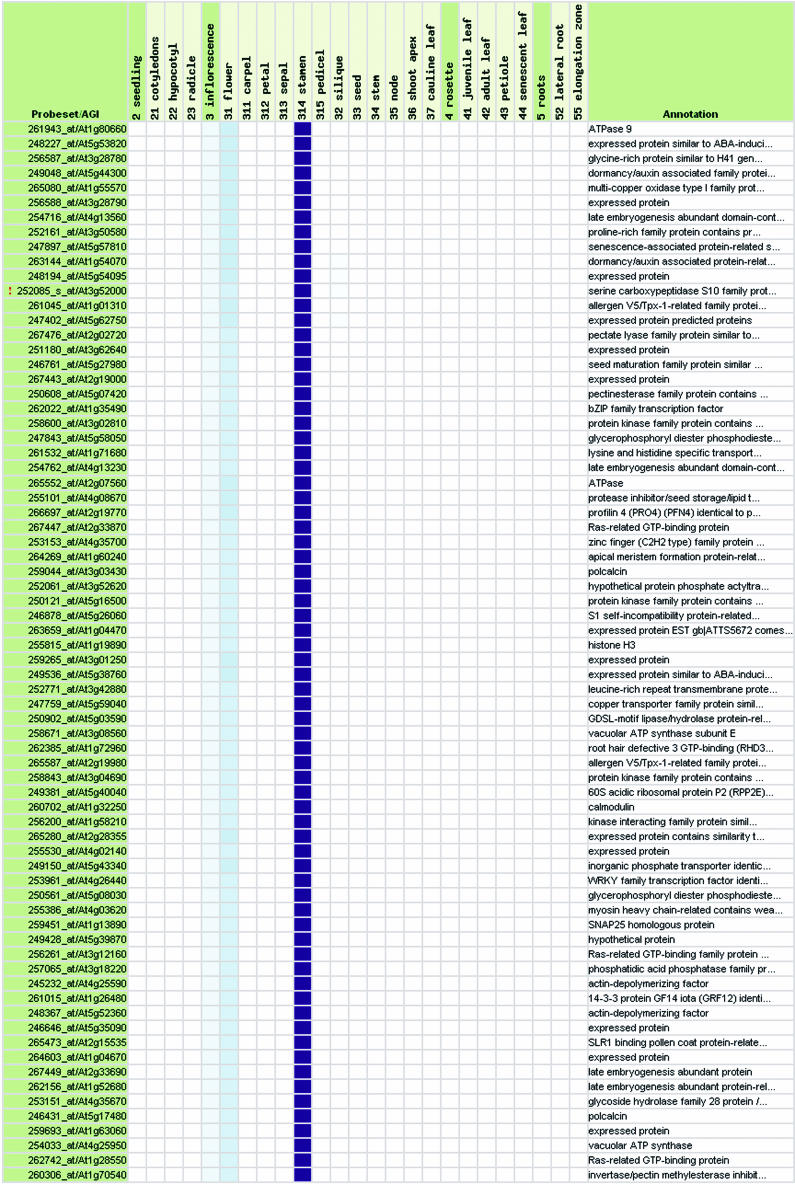
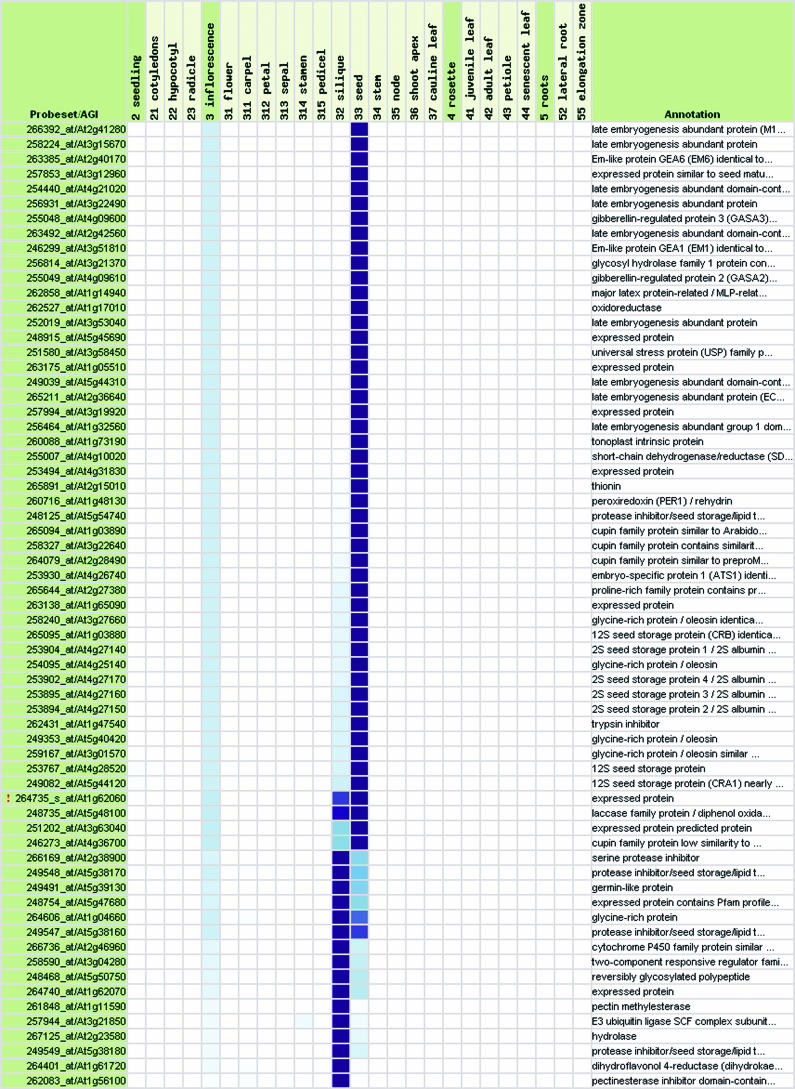
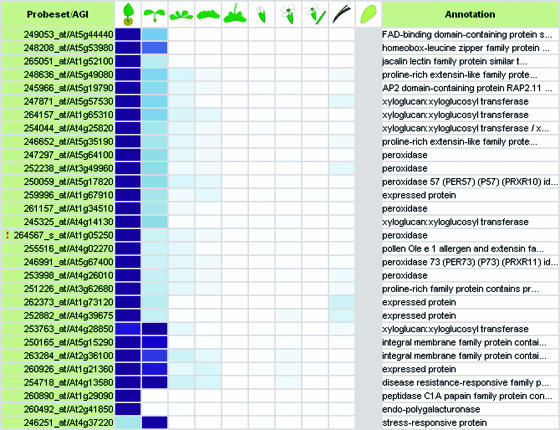
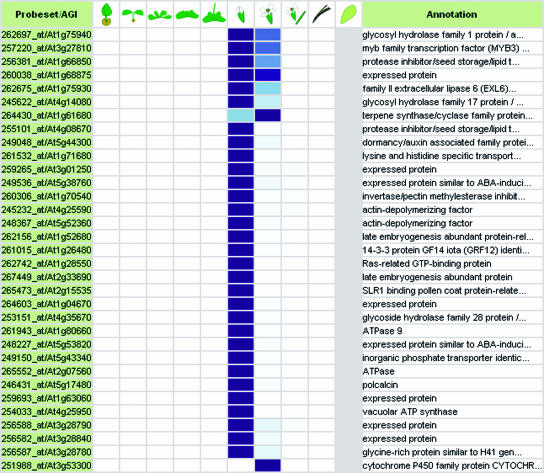
This first validation step confirms that global trends can be detected in the expression profiles of individual genes by combining numerous normalized expression data sets using the same technical platform, i.e. the Affymetrix system. Based on this information, we performed a second validation step, in which we tested whether GENEVESTIGATOR can identify genes with known expression profiles. Using Gene Atlas, 72 genes were identified to be expressed in pollen. Of these, 9 had been identified by Honys and Twell (2003) as well as Becker et al. (2003) to be pollen-specific using 8K Arabidopsis Genome Arrays (see Table IIA; Supplemental Table II). Of the remaining genes, several could be functionally associated with pollen based on annotations such as “self-incompatibility protein,” “pollen coat protein-related,” or “allergen.” Further, 14 genes were annotated as “expressed protein,” revealing the potential of GENEVESTIGATOR to identify novel genes related to particular organs. A similar analysis was performed to identify genes expressed specifically in siliques (Table IIB, compare with Hennig et al., 2004), roots, photosynthetic active tissues, leaves, senescent leaves, stem and node, carpel, petal, sepal, and shoot apex (see Supplemental Table II) and at specific developmental stages such as seedling stage (Table IIC) or early flowering stage (Table IID; Supplemental Table II). We conclude that with the current set of data, GENEVESTIGATOR generates high quality results. Moreover, we expect that this quality will continue to rise as the size of the dataset increases.
Table IIA.
Representative samples of genes expressed in specific tissues or at particular growth stages
Genes expressed preferentially (A) in stamina and pollen, (B) in seeds and siliques, (C) during seedling stage, and (D) during early flowering stage. For the description of growth stage groups (labeled A–J), see Table I. See also Supplemental Table II, which provides lists of genes expressed preferentially in roots, green tissues, photosynthetic active leaves, senescent leaves, stem and node, carpel, petal, sepal, and shoot apex.
DISCUSSION
Public repositories such as GEO and ArrayExpress provide tools for submission, storage, and retrieval of heterogeneous data sets. In contrast, GENEVESTIGATOR contains a coherent data set from a single organism generated on a common hybridization platform. Despite the high diversity of experiments represented in the database, the validation steps we carried out demonstrate that the underlying hypothesis is valid and that biologically meaningful results can be obtained using GENEVESTIGATOR. The software generally performs primary level analysis and displays results either as graphs or as numeric data, which can easily be combined, exported, or further analyzed with other data analysis and visualization tools.
The complexity of multicellular life requires the proper context-dependent expression of genes, which is achieved by highly interconnected transcriptional networks. The inference of such module networks may require the use of many data types such as gene expression, protein abundance, protein interaction, metabolite abundance, affinity precipitation, synthetic lethality, etc. (Troyanskaya et al., 2003). Nevertheless, the analysis of gene expression data can reveal significant patterns of such networks (Segal et al., 2003). In contrast to many other tools, GENEVESTIGATOR uses experiment annotation to yield contextual information that can be brought into understanding gene networks. The identification of genes exhibiting similar tissue localization and stress response attributes facilitates modeling of gene networks using network inference tools (Wille et al., 2004) by reducing the number of testable candidates. Thus, the combined gene-centric and genome-centric approaches make it a powerful tool for targeted functional genomics efforts.
Critical issues in using the GENEVESTIGATOR tools are (1) the questions being addressed by queries and (2) the interpretation of output data. First, GENEVESTIGATOR allows queries at a high level of detail and in a large variety of combinations specifying organ, developmental stage, or treatment. Although GENEVESTIGATOR currently contains information from more than 750 publicly available full genome arrays, some combinations at very detailed level may not yet have sufficient data support to yield robust results. The quality of the results therefore depends strongly on the level of granularity the user chooses and the number and types of underlying experiments. Second, care must be taken not to over-interpret output data computed by GENEVESTIGATOR. To facilitate data interpretation, the number of samples per category and the ses of the means are indicated. Nevertheless, when working in a detailed level of granularity, a post-verification of individual genes is advised using the Digital Northern tool to confirm the origin of the effects observed.
CONCLUSION
Both the forward and reverse validation of GENEVESTIGATOR revealed that the combination of annotated data from various sources using the same technology platform is a valid approach to reveal contextual information about elements of the dataset. In our case, the expression profiles of more than 22,000 genes from Arabidopsis can be generated in the context of plant organ, plant development and environmental stress. Although not all annotated categories are currently well covered in terms of number of arrays, and therefore the output from these categories may be somewhat biased, the general quality of results obtained using GENEVESTIGATOR is high. The permanent submission of new datasets is expected to constantly improve the quality of the output. The resulting information can be used to confirm previous hypotheses or generate new hypotheses about gene expression network structures and genetic regulatory networks, resulting in the design of more precise and targeted experiments.
Supplementary Material
Acknowledgments
We thank Eva Vranová and Franziska Humair for feedback on the use of the software in development. We are also grateful to the Functional Genomics Center Zurich for providing support and the Affymetrix platform for GeneChip experiments, as well as all public repositories for providing data.
This work was supported by ETH, Strategic Excellence Project 2–74213–02/TH–8/02–2, and by the Functional Genomics Center Zurich.
The online version of this article contains Web-only data.
References
- The Arabidopsis Genome Initiative (2000) Analysis of the genome sequence of the flowering plant Arabidopsis thaliana. Nature 408: 796–815 [DOI] [PubMed] [Google Scholar]
- Albani D, Sardana R, Robert LS, Altosaar I, Arnison PG, Fabijanski SF (1992) A Brassica napus gene family which shows sequence similarity to ascorbate oxidase is expressed in developing pollen. Molecular characterization and analysis of promoter activity in transgenic tobacco plants. Plant J 2: 331–342 [PubMed] [Google Scholar]
- Ashburner M, Ball CA, Blake JA, Botstein D, Butler H, Cherry JM, Davis AP, Dolinski K, Dwight SS, Eppig JT, et al (2000) Gene ontology: tool for the unification of biology. The Gene Ontology Consortium. Nat Genet 25: 25–29 [DOI] [PMC free article] [PubMed] [Google Scholar]
- Becker JD, Boavida LC, Carneiro J, Haury M, Feijo JA (2003) Transcriptional profiling of Arabidopsis tissues reveals the unique characteristics of the pollen transcriptome. Plant Physiol 133: 713–725 [DOI] [PMC free article] [PubMed] [Google Scholar]
- Bergmann S, Ihmels J, Barkai N (2004) Similarities and differences in genome-wide expression data of six organisms. PLoS Biol 2: E9. [DOI] [PMC free article] [PubMed] [Google Scholar]
- Birnbaum K, Shasha DE, Wang JY, Jung JW, Lambert GM, Galbraith DW, Benfey PN (2003) A gene expression map of the Arabidopsis root. Science 302: 1956–1960 [DOI] [PubMed] [Google Scholar]
- Boyes DC, Zayed AM, Ascenzi R, McCaskill AJ, Hoffman NE, Davis KR, Gorlach J (2001) Growth stage-based phenotypic analysis of Arabidopsis: a model for high throughput functional genomics in plants. Plant Cell 13: 1499–1510 [DOI] [PMC free article] [PubMed] [Google Scholar]
- Brazma A, Hingamp P, Quackenbush J, Sherlock G, Spellman P, Stoeckert C, Aach J, Ansorge W, Ball CA, Causton H C, et al (2001) Minimum information about a microarray experiment (MIAME)—toward standards for microarray data. Nat Genet 29: 365–371 [DOI] [PubMed] [Google Scholar]
- Brazma A, Parkinson H, Sarkans U, Shojatalab M, Vilo J, Abeygunawardena N, Holloway E, Kapushesky M, Kemmeren P, Lara GG, et al (2003) ArrayExpress—a public repository for microarray gene expression data at the EBI. Nucleic Acids Res 31: 68–71 [DOI] [PMC free article] [PubMed] [Google Scholar]
- Craigon DJ, James N, Okyere J, Higgins J, Jotham J, May S (2004) NASCArrays: a repository for microarray data generated by NASC's transcriptomics service. Nucleic Acids Res (Database issue) 32: D575–D577 [DOI] [PMC free article] [PubMed] [Google Scholar]
- Edgar R, Domrachev M, Lash AE (2002) Gene Expression Omnibus: NCBI gene expression and hybridization array data repository. Nucleic Acids Res 30: 207–210 [DOI] [PMC free article] [PubMed] [Google Scholar]
- Friedman N (2004) Inferring cellular networks using probabilistic graphical models. Science 303: 799–805 [DOI] [PubMed] [Google Scholar]
- Hennig L, Gruissem W, Grossniklaus U, Köhler C (2004) Transcriptional programs of early stages of plant reproduction. Plant Physiol 135: 1765–1775 [DOI] [PMC free article] [PubMed] [Google Scholar]
- Hennig L, Menges M, Murray JA, Gruissem W (2003) Arabidopsis transcript profiling on Affymetrix GeneChip arrays. Plant Mol Biol 53: 457–465 [DOI] [PubMed] [Google Scholar]
- Honys D, Twell D (2003) Comparative analysis of the Arabidopsis pollen transcriptome. Plant Physiol 132: 640–652 [DOI] [PMC free article] [PubMed] [Google Scholar]
- Ihmels J, Levy R, Barkai N (2004) Principles of transcriptional control in the metabolic network of Saccharomyces cerevisiae. Nat Biotechnol 22: 86–92 [DOI] [PubMed] [Google Scholar]
- Jansson S, Andersson J, Kim SJ, Jackowski G (2000) An Arabidopsis thaliana protein homologous to cyanobacterial high-light-inducible proteins. Plant Mol Biol 42: 345–351 [DOI] [PubMed] [Google Scholar]
- Kleffmann T, Russenberger D, von Zychlinski A, Christopher W, Sjolander K, Gruissem W, Baginsky S (2004) The Arabidopsis thaliana chloroplast proteome reveals pathway abundance and novel protein functions. Curr Biol 14: 354–362 [DOI] [PubMed] [Google Scholar]
- Lee TI, Rinaldi NJ, Robert F, Odom DT, Bar-Joseph Z, Gerber GK, Hannett NM, Harbison CT, Thompson CM, Simon I, et al (2002) Transcriptional regulatory networks in Saccharomyces cerevisiae. Science 298: 799–804 [DOI] [PubMed] [Google Scholar]
- Lehman A, Black R, Ecker JR (1996) HOOKLESS1, an ethylene response gene, is required for differential cell elongation in the Arabidopsis hypocotyl. Cell 85: 183–194 [DOI] [PubMed] [Google Scholar]
- Lelandais G, Le Crom S, Devaux F, Vialette S, Church GM, Jacq C, Marc P (2004) yMGV: a cross-species expression data mining tool. Nucleic Acids Res (Database issue) 32: D323–D325 [DOI] [PMC free article] [PubMed] [Google Scholar]
- Liu WM, Mei R, Di X, Ryder TB, Hubbell E, Dee S, Webster TA, Harrington CA, Ho MH, Baid J, Smeekens SP (2002) Analysis of high density expression microarrays with signed-rank call algorithms. Bioinformatics 18: 1593–1599 [DOI] [PubMed] [Google Scholar]
- Lockhart DJ, Dong H, Byrne MC, Follettie MT, Gallo MV, Chee MS, Mittmann M, Wang C, Kobayashi M, Horton H, et al (1996) Expression monitoring by hybridization to high-density oligonucleotide arrays. Nat Biotechnol 14: 1675–1680 [DOI] [PubMed] [Google Scholar]
- Menges M, Hennig L, Gruissem W, Murray JA (2003) Genome-wide gene expression in an Arabidopsis cell suspension. Plant Mol Biol 53: 423–442 [DOI] [PubMed] [Google Scholar]
- Mouline K, Very AA, Gaymard F, Boucherez J, Pilot G, Devic M, Bouchez D, Thibaud JB, Sentenac H (2002) Pollen tube development and competitive ability are impaired by disruption of a Shaker K(+) channel in Arabidopsis. Genes Dev 16: 339–350 [DOI] [PMC free article] [PubMed] [Google Scholar]
- Onate-Sanchez L, Singh KB (2002) Identification of Arabidopsis ethylene-responsive element binding factors with distinct induction kinetics after pathogen infection. Plant Physiol 128: 1313–1322 [DOI] [PMC free article] [PubMed] [Google Scholar]
- Parenicova L, de Folter S, Kieffer M, Horner DS, Favalli C, Busscher J, Cook HE, Ingram RM, Kater MM, Davies B, et al (2003) Molecular and phylogenetic analyses of the complete MADS-box transcription factor family in Arabidopsis: new openings to the MADS world. Plant Cell 15: 1538–1551 [DOI] [PMC free article] [PubMed] [Google Scholar]
- Pelaz S, Gustafson-Brown C, Kohalmi SE, Crosby WL, Yanofsky MF (2001) APETALA1 and SEPALLATA3 interact to promote flower development. Plant J 26: 385–394 [DOI] [PubMed] [Google Scholar]
- Ravasz E, Somera AL, Mongru DA, Oltvai ZN, Barabasi AL (2002) Hierarchical organization of modularity in metabolic networks. Science 297: 1551–1555 [DOI] [PubMed] [Google Scholar]
- Redman JC, Haas BJ, Tanimoto G, Town CD (2004) Development and evaluation of an Arabidopsis whole genome Affymetrix probe array. Plant J 38: 545–561 [DOI] [PubMed] [Google Scholar]
- Ruiz-Garcia L, Madueno F, Wilkinson M, Haughn G, Salinas J, Martinez-Zapater JM (1997) Different roles of flowering-time genes in the activation of floral initiation genes in Arabidopsis. Plant Cell 9: 1921–1934 [DOI] [PMC free article] [PubMed] [Google Scholar]
- Runge S, Sperling U, Frick G, Apel K, Armstrong GA (1996) Distinct roles for light-dependent NADPH:protochlorophyllide oxidoreductases (POR) A and B during greening in higher plants. Plant J 9: 513–523 [DOI] [PubMed] [Google Scholar]
- Segal E, Shapira M, Regev A, Pe'er D, Botstein D, Koller D, Friedman N (2003) Module networks: identifying regulatory modules and their condition-specific regulators from gene expression data. Nat Genet 34: 166–176 [DOI] [PubMed] [Google Scholar]
- Stelling J, Klamt S, Bettenbrock K, Schuster S, Gilles ED (2002) Metabolic network structure determines key aspects of functionality and regulation. Nature 420: 190–193 [DOI] [PubMed] [Google Scholar]
- Troyanskaya OG, Dolinski K, Owen AB, Altman RB, Botstein D (2003) A Bayesian framework for combining heterogeneous data sources for gene function prediction (in Saccharomyces cerevisiae). Proc Natl Acad Sci USA 100: 8348–8353 [DOI] [PMC free article] [PubMed] [Google Scholar]
- Vicient CM, Hull G, Guilleminot J, Devic M, Delseny M (2000) Differential expression of the Arabidopsis genes coding for Em-like proteins. J Exp Bot 51: 1211–1220 [PubMed] [Google Scholar]
- Wille A, Zimmermann P, Vranová E, Bleuler S, Fürholz A, Hennig L, Laule O, Prelíc A, von Rohr P, Thiele L, et al (2004) Sparse graphical gaussian modeling for genetic regulatory network inference. Genome Biol (in press)
Associated Data
This section collects any data citations, data availability statements, or supplementary materials included in this article.


