Abstract
Background
A targeted analysis of the 50kDa C-terminal fragment of insulin-response element binding protein-1 (IRE-BP1) activation of insulin activation of target genes through the insulin receptor substrate receptor/PI-3 kinase/Akt pathway has been demonstrated for the insulin growth factor-1 receptor. The broader effects of 50kDa C-terminal IRE-BP1 fragment over-expression on protein abundance in pancreatic islet beta cells have not been determined.
Results
Liquid-chromatography coupled to tandem mass spectrometry (LC-MS/MS) analyses of replicate lysates of pancreatic islets isolated from background strain animals and transgenic animals, overexpressing IRE-BP1 in pancreatic islet beta cells, demonstrated statistically significant increases in the expression of proteins involved in protein synthesis, endoplasmic reticulum (ER) stress and scaffolding proteins important for protein kinase C signaling; some of which were confirmed by immunoblot analyses. Bioinformatic analysis of protein expression network patterns suggested IRE-BP1 over-expression leads to protein expression patterns indicative of activation of functional protein networks utilized for protein post-translational modification, protein folding, and protein synthesis. Co-immunoprecipitation experiments demonstrate a novel interaction between two differentially regulated proteins receptor for activated protein kinase C (RACK1) and translationally controlled tumor protein (TCTP).
Conclusions
Proteomic analysis of IRE-BP1 over-expression in pancreatic islet beta cells suggest IRE-BP1 (a) directly or indirectly through establishing hyperglycemia results in increased expression of ribosomal proteins and markers of ER stress and (b) leads to the enhanced and previously un-described interaction of RACK1 and TCTP.
Significance
This study identified C-terminal 50kDa domain of IRE-BP1 over-expression results in increased markers of ER-stress and a novel interaction between the scaffolding proteins RACK1 and TCTP.
Keywords: proteomics, mass spectrometry, spectral counting, label-free quantification
INTRODUCTION
Insulin resistance associated with type-2 diabetes may occur when the endocrine pancreas loses the capacity to appropriately respond to increased blood glucose levels by increasing insulin production and secretion. We previously cloned and identified the insulin-response element binding protein 1 (IRE-BP1) based on its ability to bind to the insulin response elements of IGF binding protein-3 and other insulin-regulated genes. (1) Subsequent investigation suggested that IRE-BP1 may be involved in the actions of insulin in multiple insulin-target tissues; its expression is decreased in tissues of insulin-resistant diabetic rats, and the transactivation domain of the protein is localized to the nucleus in hepatocytes under normal metabolic conditions but is sequestered to the cytoplasm in insulin-resistant conditions, such as in diabetes, obesity, and starvation. (2) IRE-BP1 is also phosphorylated through insulin-induced PI-3K signaling, and is regulated by proteolytic cleavage of the 50-kDa carboxyl fragment from the 160-kDa holoprotein, releasing the carboxyl fragment to translocate to the nucleus to activate gene transcription. (3)
Recently, we developed a transgenic (TG) mouse model where the transcriptionally active domain of IRE-BP1 is expressed in pancreatic β-cells and its expression modulates insulin secretion and glucose homeostasis. (4) We demonstrated that overexpression of IRE-BP1 in β-cells produces hyperinsulinemia and hyperglycemia, blunts the insulin secretory response to glucose, increases islet mass, and increases body weight in FVB mice. These findings produce a phenotype similar to that of type-2 diabetes mellitus with insulin resistance. These data led to the hypothesis that “impaired insulin signaling can result from reduced activation of insulin responsive transcription factors and the development of insulin resistance through production of the IRE-BP1 responsive proteome”. We tested this hypothesis by using a proteomic approach to compare the proteome of islet lysates from IRE-BP1 C-terminal domain TG mice against the lysates of islets obtained from the pancreati of the background mouse strain. We confirmed some of these proteomic and informatics findings by immunoblot analysis. To advance these findings beyond a simple proteomic comparison of samples and toward developing a hypothesis of how IRE-BP1 might function in islets, we identified a previously unknown association of two proteins both independently shown to regulate signaling pathways relevant to diabetes, apoptosis and proliferation.
METHODS
Mouse islet collection and islet protein isolation
Islets were isolated and handled as described previously. (4) Briefly, pancreas were obtained from anesthetized mice and digested with 2 mg collagenase/ml of M199 medium at 37 C for 20 min, washed three times with ice cold KREBS buffer, and lysed using RIPA buffer. Protein assays were determined using a standard Bradford protein assay (Bio-Rad, Hercules, CA) against albumin/RIPA buffer standard curve.
Acquisition of label-free LC-LTQ-MS/MS spectral counting data
For label-free two-dimensional LC-MS/MS analyses, protein samples (50ug) were reduced, alkylated, and trypsinized at 37 C overnight with shaking. The tryptic peptides were loaded onto a 2D capillary chromatography column packed with 2 to 3 cm of 5-μm C18 reversed-phase (RP) resin Jupiter 5 μm RP300A (Phenomenex, Torrance, CA) followed by 3 to 4 cm of 5-μm Luna 100A strong cation exchange (SCX) resin (Phenomenex) and a packed needle tip (100 × 365 μm fused silica capillary with an integrated, laser pulled emitter tip) packed with 10 cm of Jupiter 5-μm RP300A (Phenomenex). Peptides were eluted from SCX with seven step gradients (10%, 15%, 20%, 30%, 50%, 70%, and 100%) of 500 mM ammonium acetate. Following each SCX elution step, the peptides were eluted, ionized and sprayed into the mass spectrometer using the following 112 min gradient from 5% acetonitrile to 40% acetonitrile (plus 0.1% formic acid) and a final 62 min elution from 5% acetonitrile to 100% acetonitrile at a flow rate of 200nl/min. Spectra were acquired with a LTQ linear ion trap mass spectrometer (Thermo Fisher Scientific Waltham, MA). During LC-MS/MS analysis, the mass spectrometer performed data-dependent acquisition with a full MS scan between 300 and 2000 m/z followed by MS/MS scans (35% collision energy) on the six most intense ions from the preceding MS scan. Data acquisition was performed using dynamic exclusion with a repeat count of a 1- and 3- min exclusion duration window.
Analysis of label-free spectral counting data for quantification of islet protein abundance
The acquired mass spectrometry data was searched against a rat refseq protein database (unknown version) using the SEQUEST (version 27 revision 11) algorithm assuming fixed modification of cysteine (+57 for carbamidomethylation), variable oxidation of methionine (+16 to methionine) and maximal two missed trypsin cleavages. Database analysis was performed with SequestSorcerer (Sage-N Research, San Jose, CA). High-probability peptide and protein identifications were assigned from the SEQUEST results using the ProteinProphet (http://tools.proteomecenter.org/software.php) and SageN Sorcerer statistical platforms. These data were loaded onto Scaffold 3 proteomic analysis software to quantitatively assess differences in protein expression. This comparison was achieved using a label-free method using spectral counting and ion chromatogram data to compare individual LC-MS/MS analyses with an ANOVA approach. Protein observations across all data sets were achieved by substitution of 1 spectral count for each unobserved protein. These data were also qualitatively assess to provide approaches to functional annotation of data by submitting lists of identified proteins and expression patterns for pathways analysis using DAVID Bioinformatics Resources 6.7 (http://david.abcc.ncifcrf.gov), WEB-based GEne SeT AnaLysis Toolkit (http://bioinfo.vanderbilt.edu/webgestalt/), and Ingenuity Pathways Analysis (IPA) software (http://ingenuity.com).
Western blot analysis
For validation of proteins identified by mass spectrometry, western blot analysis was performed as described previously using 20ug pancreati islet lysate. (4) Total lysate was separated by 4–12 % gradient SDS-PAGE, transferred to 0.4um nitrocellulose and stained using Ponceau S stain to evaluate protein loading and transfer. The Ponceau S stained membrane was rinsed using Tris-Tween-20 buffered saline (TTBS), blocked using 5% defatted milk in TTBS, and used for immunoblot analysis. The immunoblot targets were the C-terminal domain of IRE-BP1, GNB2L1 (RACK1), TPT1 (TCTP), and PDIA6. Unless otherwise stated all antibody dilutions were (1:1000) and purchased from Abcam (Cambridge, MA). Densitometry was performed to quantify band densities.
Analysis for co-immunoprecipitating proteins
Reciprocal co-immunoprecipitation experiments were conducted as described previously to examine the potential for differentially regulated islet β-cell proteins to interact. (5) Briefly, in separate experiments RACK1, TCTP and isotype control antibodies were first immobilized to the Protein A/G resin using dimethylpimelidate and then incubated with 250ug β-cell lysate overnight at 4 C with agitation. (6) The beads were separated from the lysate, rinsed 3X using lysis buffer, stripped with 2X Laemmli buffer, and used for western blotting experiments as described above.
Statistical analysis
All data are expressed as means ± SEM. Statistical analysis of 1) mass spectrometry data was performed by Student’s t-test using spectral count data by the Scaffold3 software and b) immunoblot was performed using Student’s t-test with differences were considered statistically significant with a P-value < 0.05.
RESULTS
Characterization of transgenic and wild type islet proteomes by LC-MS/MS analysis
Qualitative and quantitative analysis of total islet proteins were performed using a label-free, LC-MS/MS approach to examine the possible mechanisms through which islet β-cell over-expression of the C-terminal domain of IRE-BP1 affects islet growth and survival. (7) A total of 302 proteins were identified across the six islet sample lysates with two or more peptides following decoy database filtering and at less than 0.1% Protein Prophet false discovery rate (FDR) and less than 0.5% Peptide Prophet FDR (Supplemental Table 1). Two hundred twenty five (225) proteins were identified as common to both TG and WT islet samples. Fifty five (55) proteins were identified only in TG islet samples; ten (10) proteins were identified in all three TG samples (Table 1). Twenty two (22) proteins were identified only in WT samples; none of these proteins were identified in all three WT islet lysate samples. Twenty (20) proteins were determined by t-test analysis to be significantly differentially abundant at a p-value less than 0.05 and all were increased in TG samples from 7.8 to 13.1 fold above WT samples (Table 1).
Table 1.
Differentially Abundant Islet Proteins by ANOVA Analysis of LC-MS/MS Data
| Proteins Detected in TG Islets Only | (gi| number/gene name) | |
|---|---|---|
| 1 | dolichyl-diphosphooligosaccharide--protein glycosyltransferase subunit 2 | gi|34996495/Rpn2 |
| 2 | 40S ribosomal protein S3 | gi|6755372/Rps3 |
| 3 | 40S ribosomal protein S25 | gi|28372479/Rps25 |
| 4 | heat shock 70 kDa protein 4 | gi|112293266/Hspa4 |
| 5 | 2-oxoisovalerate dehydrogenase subunit alpha, mitochondrial | gi|183396774/Bckdha |
| 6 | 3-hydroxyacyl-CoA dehydrogenase type-2 | gi|61888838/Hsd17b10 |
| 7 | guanine nucleotide-binding protein subunit beta-2-like 1 | gi|6680047/Gnb2l1 |
| 8 | PREDICTED: 60S ribosomal protein L22-like | gi|309265792/RpL22e |
| 9 | aspartyl aminopeptidase isoform b | gi|161016820/Dnpep |
| 10 | serpin I2 | gi|114158681/Spi14 |
| Regulated Islet Proteins | (gi| number/gene name) | T-Test (P-Value) | Log2(TG/WT) | |
|---|---|---|---|---|
| 1 | peptidyl-prolyl cis-trans isomerase A | gi|6679439/Ppia | 0.00099 | 7.7 |
| 2 | heat shock cognate 71 kDa protein | gi|31981690/Hspa8 | 0.0011 | 9.0 |
| 3 | 60S ribosomal protein L5 | gi|23956082/Rpl5 | 0.0016 | 13.1 |
| 4 | 40S ribosomal protein SA | gi|224994260/Rpsa | 0.0021 | 8.4 |
| 5 | PREDICTED: 60S ribosomal protein L7 isoform 2 | gi|309270564/Gm5045 | 0.0044 | 7.8 |
| 6 | translationally-controlled tumor protein | gi|6678437/Tpt1 | 0.0054 | 8.7 |
| 7 | adenylate kinase 2, mitochondrial isoform a | gi|77020262/Ak2 | 0.0092 | 9.3 |
| 8 | gamma-glutamyltranspeptidase 1 | gi|6679995/Ggt1 | 0.011 | 10.8 |
| 9 | pancreatic triacylglycerol lipase | gi|37674236/Pnlip | 0.019 | 7.9 |
| 10 | PREDICTED: 40S ribosomal protein S2-like | gi|149263154/Gm8841 | 0.019 | 8.6 |
| 11 | heat shock protein HSP 90-beta | gi|40556608/Hsp90ab1 | 0.019 | 9.2 |
| 12 | isocitrate dehydrogenase [NADP], mitochondrial | gi|225579033/Idh2 | 0.022 | 9.4 |
| 13 | elongation factor 1-beta | gi|31980922/Eef1b2 | 0.024 | 9.2 |
| 14 | 4F2 cell-surface antigen heavy chain isoform a | gi|238637277/Slc3a2 | 0.029 | 9.1 |
| 15 | mesencephalic astrocyte-derived neurotrophic factor | gi|110625813/Manf | 0.033 | 7.9 |
| 16 | heat shock protein HSP 90-alpha | gi|6754254/Hsp90aa1 | 0.033 | 8.9 |
| 17 | probable 10-formyltetrahydrofolate dehydrogenase | gi|283436218/Aldh1l2 | 0.036 | 8.4 |
| 18 | PREDICTED: 60S acidic ribosomal protein P0-like | gi|94383772/Gm8730 | 0.037 | 8.1 |
| 19 | 60S ribosomal protein L10a | gi|255003735/Rpl10a | 0.04 | 9.0 |
| 20 | eukaryotic initiation factor 4A-II isoform a | gi|176865892/Eif4a2 | 0.051 | 9.5 |
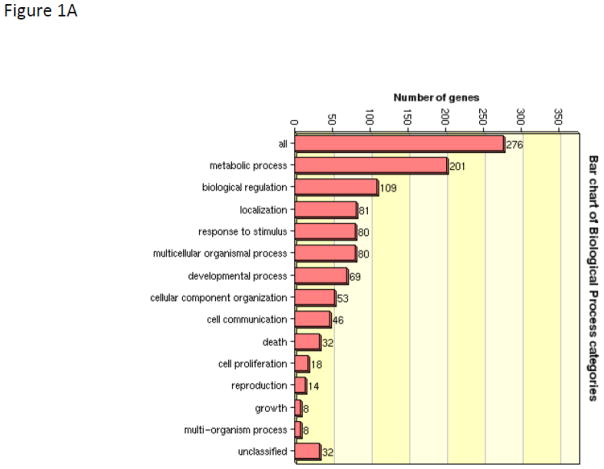
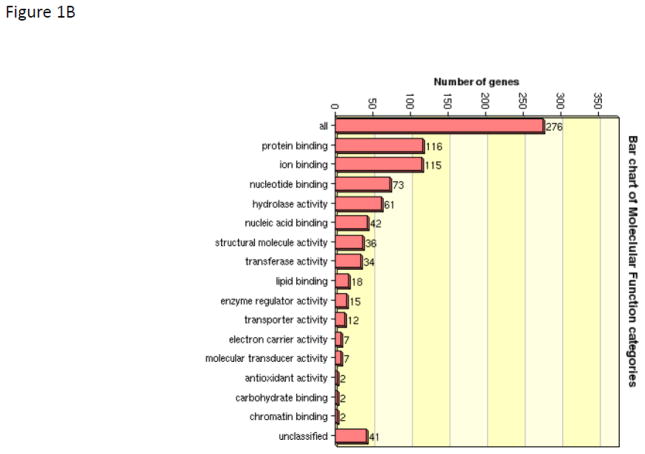
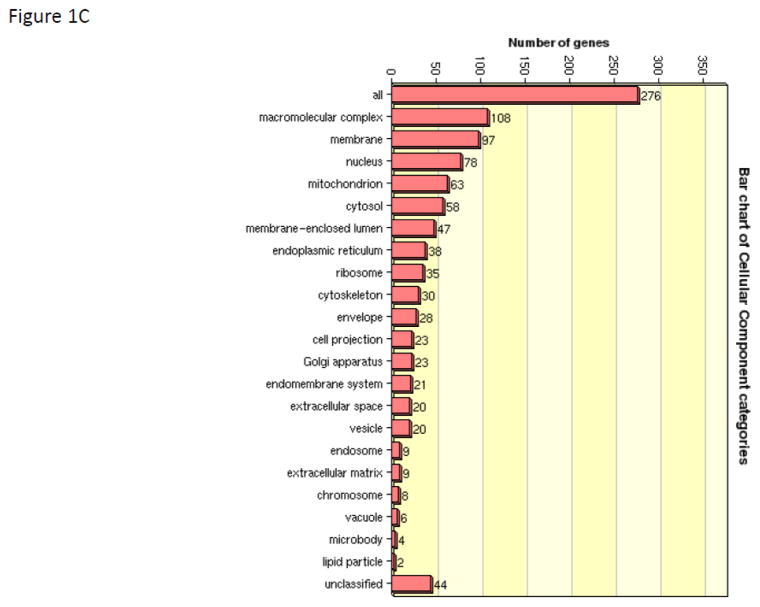
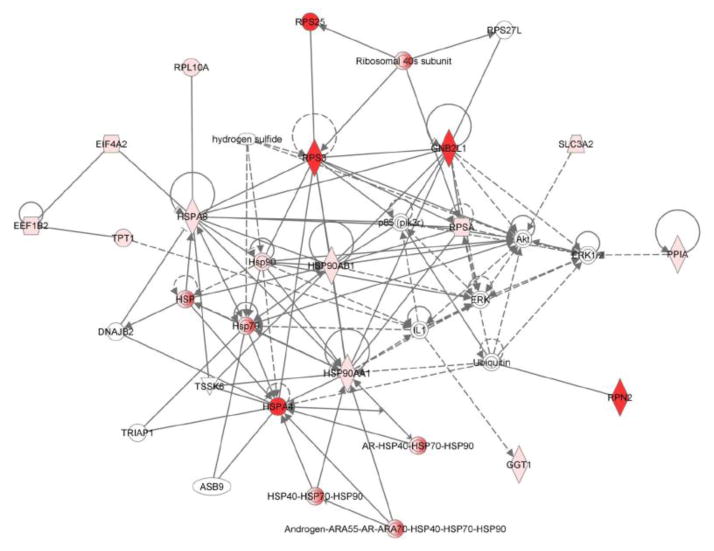
Given the complexity of proteomic data sets, we utilized a pathways analysis approach to evaluate those emergent properties of the dataset that would not be predicted by evaluating the biological importance of discrete individual proteins. The informatics tool David was used to determine trends within the observed protein abundance patterns that could be assigned to a biologic function (functional annotation clustering). The five top clusters were assigned to ribosome function (Benjamini corrected p-value 3.5E-27), granule and vesicle function (Benjamini corrected p-value 2.9E-15), mitochondrion (Benjamini corrected p-value 3.7E-11), energy generation (Benjamini corrected p-value 1.1E-7), and endoplasmic reticulum (Benjamini corrected p-value 8.6E-8). David was then used to convert sequence identification numbers (gi| numbers) to Uniprot/SwissProt accession identifiers (276 gene products). These SP accession identifiers were then submitted to WEB-based GEne SeT AnaLysis Toolkit for gene ontological (GO) analysis to define trends in association of identified proteins with biological processes (Figure 1A), molecular function (Figure 1B), and cellular components (Figure 1C). The primary biologic process was characterized as metabolic while the primary molecular function was characterized by protein/ion/nucleic acid binding activities. By GO annotation the identified proteins spanned a broad range of cellular localization from membrane, nucleus, mitochondrion, cytosol, endoplasmic reticulum, ribosome, cytoskeleton, and various membrane enclosed structures; thus suggesting a thorough islet lysis and sample recovery. To gain a larger systems biology interpretation, IPA was used to determine integration of significantly regulated proteins into networks (Table 2). These results suggested that the limited set of regulated proteins fit efficiently into two networks that comprised (a) post-translational modification of proteins, protein folding, and protein synthesis and (b) cancer, neurological disease, and cell cycle. IPA was used to assist with the interpretation of the protein expression data. For our purposes we segmented the IPA results into Top Networks, Top Biological Functional Annotations, Canonical Pathways, and Upstream Activation/Inhibition Analysis. The top network (Figure 2) characterizes 16 proteins involved with protein post-translational modification, protein folding and protein synthesis with a score of 41. (This score suggests the chance of these proteins being randomly identified together in these data sets 1 out of 1041). As shown in Figure 2, 16 of the 30 regulated proteins comprise an interaction network that also include molecular chaperones including HSP70’s and HSP90’s family members as well as lipid and protein kinases PI-3K, Akt and the mitogen activated kinases, Erk1/2 and the protein kinase/ribosomal scaffolding protein GNB2L1 or RACK1. The second top network characterized 11 proteins as being associated with cancer, neurologic disease, and cell cycle with a score of 25 (network not shown). The annotation of biological functions to these regulated proteins suggested these protein expression patterns would contribute to a) decreased necrosis and cell death and also b) cellular homeostasis and cell migration. Given the high metabolic and protein folding needs of the islet beta cells, it is not surprising that the regulated proteins comprising these four functional pathways as well as the canonical pathways are largely comprised of metabolic enzymes (HSD17b10, SLC3A2, BCKDHA), protein chaperones (HSP90AB1, HSP90AA1, HSP4A, HSP8A, PPIA) and ribosomal proteins (GNB2L1, RPS3, RPSA). A total of four activation/inhibition pathways were returned as significant (p-value <0.05) with a z-score greater than 2 or less than −2 (Table 2). The most significant pathway (p-value 9.14 E-14) was associated with protein expression patterns that correlated to decreased effects of sirolimus activity (which can be construed as increased activation of the mTOR pathway).
Figure 1.
WEB-based GEne SeT AnaLysis Toolkit of identified islet proteins for gene ontological (GO) analysis. Accession numbers for proteins identified in WT and Tg islet lysates were aggregated and submitted to WEB-GESTALT to evaluate to prominent roles of the identified proteins with biological processes (Figure 1A), molecular function (Figure 1B), and cellular components (Figure 1C).
Table 2.
IPA Systems biology analysis of the thirty regulated proteins by network, biological functional annotation, canonical pathways and upstream activation/inhibition analysis
| Top Networks | Score | No. Proteins |
|---|---|---|
| 1. Post-translational modification, protein folding, protein synthesis (EEF1B2, EIF4A2, GGT1, GNB2L1, HSP90AA1, HSP90AB1, HSPA4, HSPA8, PPIA, RPL10A, RPN2, RPS3, RPS25, RPSA, SLC3A2, TPT1) | 41 | 16 |
| 2. Cancer, neurological disease, cell cycle (AK2, ALDH1L2, BCKDHA, DNPEP, HSD17B10, IDH2, MANF, PNLIP, RPL5, RPS25, SERPINI2) | 25 | 11 |
| Top Biological Functional Annotations (p-value) | Activation (z-score) | No. Proteins |
| 1. Necrosis (1.31 E-04) (GGT1, GNB2L1, HSD17B10, HSP90AA1, HSP90AB1, HSP4A, HSP8A, MANF, PPIA, RPS3, RPSA, SLC3A2, TPT1) | Decreased (−2.733) | 13 |
| 2. Cell death of tumor cell lines (4.11 E-04) (GGT1, GNB2L1, HSP90AB1, HSP4A, HSP8A, PPIA, RPS3, SLC3A2, TPT1) | Decreased (−2.192) | 9 |
| 3. Cellular homeostasis (3.62 E-02) (BCKDHA, GGT1, HSP90AA1, PPIA, SLC3A2) | Increased (2.213) | 6 |
| 4. Migration of cells (3.30 E-02) (GNB2L1, HSP90AA1, HSP90AB1, PPIA, RPSA, SLC3A2, TPT1) | Increased (2.312) | 7 |
| Canonical Pathways (p-value) | No. Proteins | |
| 1. EIF2 signaling (6.01 E-06) (EIF4A2, RPL10A, RPS3, RPS25, RPSA) | 5 | |
| 2. eNOS signaling (3.63 E-05) (HSP90AA1, HSP90AB1, HSP4A, HSP8A) | 4 | |
| 3. Regulation of eIF4 and p70S6K signaling (5.85 E-05) (EIF4A2, RPS3, RPS25, RPSA) | 4 | |
| 4. Aldosterone signaling in epithelial cells (6.49 E-05) (HSP90AA1, HSP90AB1, HSP4A, HSP8A) | 4 | |
| 5. mTOR signaling (1.57 E-04) (EI F4A2, RPS3, RPS25, RPSA) | 4 | |
| Upstream Activation/Inhibition Analysis (p-value) | Activation (z-score) | No. Proteins |
| 1. Sirolimus (9.14 E-14) (SLC3A2, RPSA, RPS3, RPN2, RPL10A, PPIA, HSPA4, HSP90AB1, HSP90AA1, GNB2L1, BCKDHA) | Decreased (−2.714) | 11 |
| 2. CD 437 (1.31 E-04) (HSPA8, HSP90AA1, EIT4A2, AK2) | Decreased (−2.000) | 4 |
| 3. 5-fluorouracil (−1.61 E-04) (RPL10A, IDH2, HSPA8, HSP90AB1) | Decreased (−2.000) | 4 |
| 4. beta-estradiol (1.40 E-02) (SLC3A2, RPN2, HSPA4, HSPA8, HSP90AB1, IDH2) | Increased (2.219) | 6 |
Figure 2.
Network analysis of WT and Tg islet proteomes. Ingenuity Pathways Analysis (IPA) was used to determine emergent properties within the regulated islet proteins. The most prominent network (z score 41) incorporated 16 identified proteins out of the 30 protein network. (Red coloration designates up-regulation in Tg islet proteome).
Immunoblot and co-immunoprecipitation assays
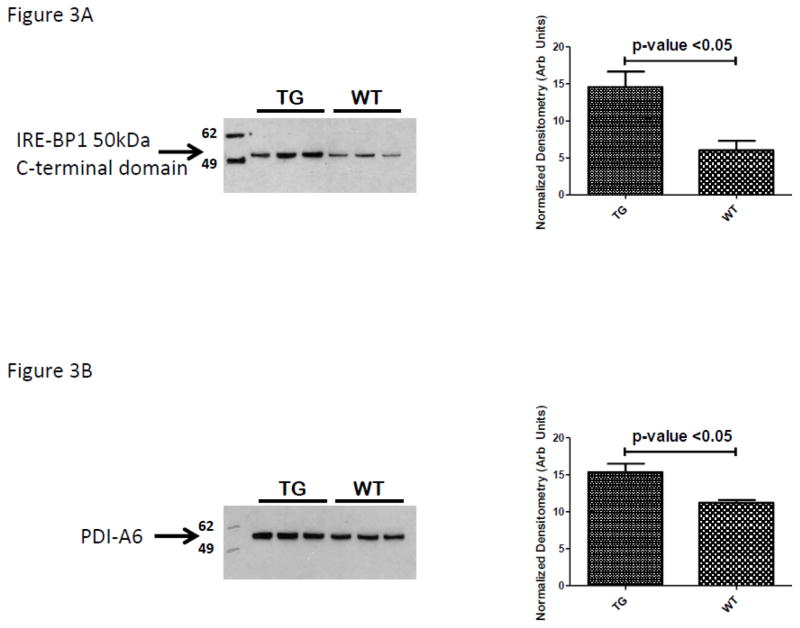
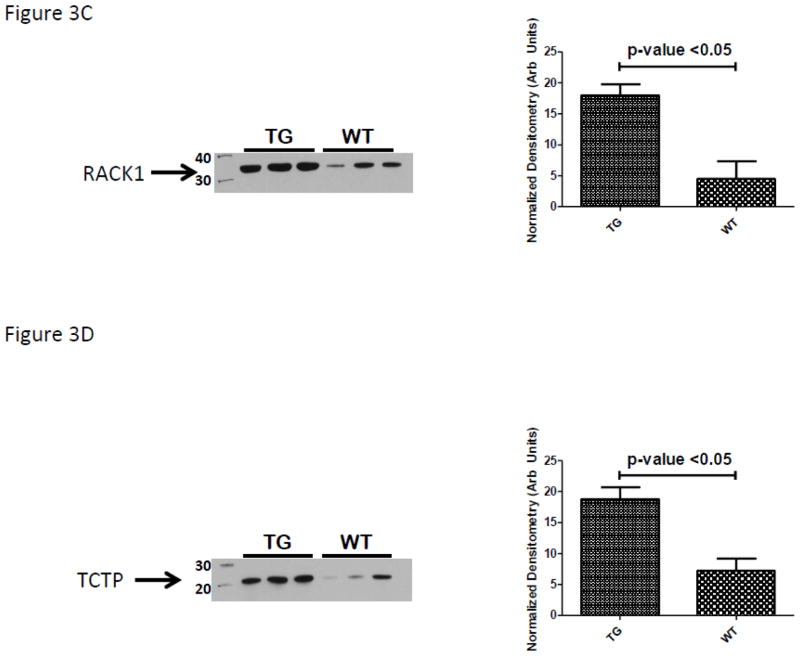
Using immunoblot experiments we first quantified the protein expression patterns for IRE-BP1, the transgene product. As demonstrated in Figure 3A, pancreatic islets isolated from our transgenic animals had three times the expression of the C-terminal 50kDa domain of IRE-BP1. Globally our findings of protein expression patterns were consistent with the reports of Petyuk et. al. and others demonstrating the islet proteome to be highly abundant in proteins involved in protein synthesis (ribosomal proteins), protein chaperones (to respond to high level of protein synthesis requiring concomitant protein folding needs) as well as metabolic proteins (Table 2, Top Networks). (8–10) A review of proteins whose expression was not significantly affected by the IRE-BP1 transgene expression was made to select a protein for IB loading control. This was conducted due to the nominal presence of actin and tubulin isoforms in the LC-MS/MS data set. Several protein disulfide isomerase (PDI) isoforms were detected by LC-MS/MS analysis but none were determined by ANOVA (p-value 0.15) to be differentially abundant using spectral counting data. A PDI-A6 isoform was selected as a target to immunoblot and demonstrate an effective loading control. As demonstrated in Figure 3B, PDI-A6 was marginally but consistently up-regulated in the islet lysates of the IRE-BP1 Tg mouse line. These IB data suggest that the use of the spectral counting method for quantification is an approach that identifies differentially regulated proteins with moderate to strong differences and can overlook those proteins with marginal differential abundances. Using IPA network analysis of differentially abundant proteins to define regulated proteins that explained the top biological functions (Table 2, Top Biological Functions) focused our attention on the immunoblot analysis of two target proteins recently demonstrated to be glucose sensitive islet b-cell transcripts- namely Guanine Nucleotide-Binding Protein Subunit Beta-2-Like 1 (GNB2L1 also known as receptor for activated protein kinase-1, RACK1) and tumor protein, translationally controlled-1 (TPT1 also known at translationally controlled tumor protein, TCTP). (11–13) The selected focus on GNB2L1/RACK1 was further supported by its interaction with protein (Akt and Erk1/2) and lipid (p85) kinases (Figure 2) which separately have previously been shown to be important regulators of IRE-BP1’s transcriptional activity. As demonstrated in Figure 3C and D both RACK1 and TCTP are significantly up-regulated in TG animals. (Equal loading of gels demonstrated by Coomassie stained post-transfer gels; as shown in Supplemental data).
Figure 3.
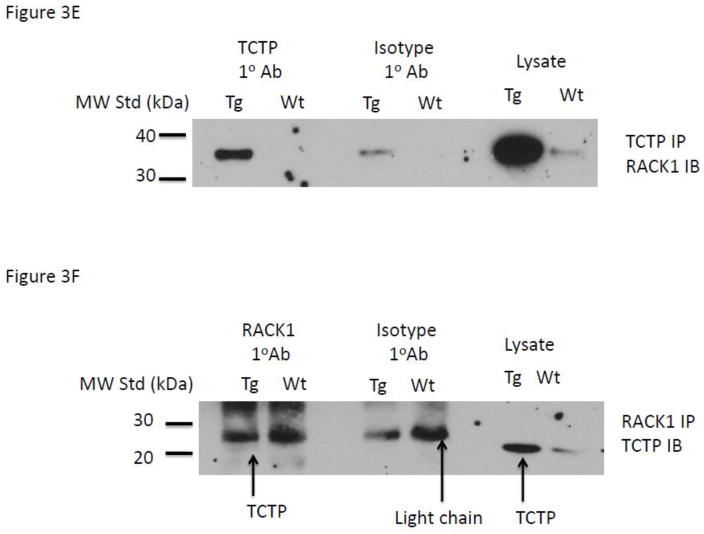
Evaluation of protein expression and association by immunochemical analysis. Confirmation of the over-expression of (A) the C-terminal IRE-BP1 50kDa C-terminal domain, (B) protein disulfide isomerase, PDI-A6, (C) the receptor for activated protein kinase-1, RACK1, (D) translationally controlled tumor protein, TCTP, (D) immunoprecipitation of TCTP and co-immunoblot for RACK1; control for non-specific binding is demonstrated by use of isotype primary antibody, (E) immunoprecipitation of RACK1 and co-immunoblot for TCTP; control for non-specific binding is demonstrated by use of isotype primary antibody and identification of correct non-Ig light chain band by total lysate lanes.
As RACK1 has structural homology to guanine nucleotide binding proteins with significant insulin-responsive singling properties (14–16) and TCTP has been demonstrated to interact with and have nucleotide exchange activity for Rheb GEF we hypothesized that RACK1 and TCTP might be co-associated in a complex. We examined if RACK1 and TCTP were associated using a co-immunoprecipitation assay. (17–19) Pooled TG and FvB islet lysates were developed by pooling 250ug islet lysates for TG and FvB animals. Reciprocal experiments for RACK1 immunoprecipitation and TCTP immunoblotting experiments were conducted. Primary antibodies (2–5ug) were incubated overnight at 4 C with 500ug of pooled lysate. Parallel experiments were conducted with isotype primary antibodies (5ug) to control for non-specific binding of lysate proteins to the Protein A/G beads and for false positive bands on the developed immunoblot. Pooled lysate was use as a positive control to demonstrate endogenous abundance of the protein. As shown in Figure 3E, immunoprecipitation of TCTP and immunoblotting for RACK1 demonstrates a strong enrichment above the levels of non-specific binding shown in the isotype control IP lanes. The lack of a RACK1 positive band in the Wt lane is assumed to be due to the low endogenous abundance of the TCTP protein in the WT lysate. As shown in Figure 3F, immunoprecipitation of RACK1 followed by IB for TCTP demonstrate a weak band at the correct molecular weight. Despite using dimethylpimelidate to crosslink the IgG and immobilize it to the protein A/G beads, the signal for the IgG light chain at 25kDa overwhelms the 22kDa TCTP band at longer exposures.
DISCUSSION
The susceptibility for developing a diabetic state increases when the endocrine pancreas loses the capacity to respond appropriately to changes in blood glucose levels. Previous research from our labs has suggested a significant role in the development of insulin insensitivity through pancreatic beta cell expression of insulin-response element binding protein-1 (IRE-BP1) and corresponding mediation of gene transcription. The novel findings in our study include identification of a discrete list of proteins whose inset abundance is modified by beta cell over-expression of IRE-BP1 and the demonstration that two of these proteins (RACK1 and TCTP1), known to be glucose sensitive transcripts, reciprocally co-immunoprecipitate in a protein complex.
We used proteomics to develop the emergent properties of the islet proteome when islet β-cells over-express the transcriptionally active 50kDa C-terminal domain of IRE-BP1. Based on our Web-GESTALT analysis our study is consistent with other expert proteomic reports (10, 11) that characterizes the islet proteomic as enriched in proteins having a functional roles in protein synthesis, protein transport and trafficking, energy generation, and protein folding and post-translational modification and endoplasmic reticulum proteins. This study adds to these previous studies by demonstrating a unique transgenic islet proteome that differs from the wild type proteome with increased abundance of proteins involved in protein synthesis, energy generation, and molecular scaffolding proteins. In our study a total of 302 proteins were identified using two or more peptide rule and a decoy database strategy to minimize false discovery rates. A limitation to this study was the presence of detergent (SDS and CHAPS) during the LC-MS/MS analysis of the islet protein digests. Despite the application of dynamic exclusion rules a significant amount of MS/MS time was used acquiring non-protein data; resulting in a reduced count of identified proteins. To address the presence of the detergent signal in the LTQ data set we chose the two peptide rule as a standard for protein identification at the expense of reporting higher numbers of (single peptide) protein identifications. A benefit to this approach is the pathways/informatics analysis constructs protein interaction networks comprised of reliable protein identifications. In our study approximately 75% of the identified proteins were common to both the Tg and Wt proteomes. These data suggest that IRE-BP1 does not broadly and indiscriminately affect protein transcription/translation activities of abundant proteins. As might be expected for the over-expression of a transcriptional co-activator protein, the majority of these uniquely identified proteins were observed in the Tg islet samples. To extend these findings away from a simple proteomic comparison we used a dichotomous informatics approach to a) develop a broader understanding of how the regulated proteins might affect islet function and to b) refine the list of identified and regulated proteins into smaller list of target proteins whose study might yield novel findings. To address this refinement we considered those proteins found within the top network (Network 1) the most significant biological functional annotation with decreased (necrosis) and increased (migration of cells) activation, and the decreased sirolimus activation analysis (or conversely as increased mTOR activation analysis). We then considered these proteins expression patterns in relation to diabetes and hyperglycemia; a functional outcome of IRE-BP1 over-expression. These refinements focused our attention on Guanine Nucleotide-Binding Protein Subunit Beta-2-Like 1 (GNB2L1) also known as receptor for activated protein kinase-1 (RACK1), and tumor protein translationally controlled-1 (TPT1) also known at translationally controlled tumor protein (TCTP). (11–13)
A primary function of the beta cell is to synthesize, store, and release insulin upon demand. The inability to address the heavy protein folding needs of the beta cell commensurate with high levels of proinsulin synthesis and storage can in pathophysiologic conditions lead to an inadequate unfolded protein response (UPR). Intriguingly, the chemical restoration of this UPR response in pre-diabetic mice has been shown to be sufficient to protect against diabetes onset through canonical UPR responsive pathways; including those pathways involving the ER-resident protein kinase inositol-requiring protein-1 (IRE-1). (20, 21) The activation of IRE-1 leads to transcription of X-box binding protein-1 (XBP-1) and induction of proteins needed to participate in the UPR. Qui et al demonstrated that in pancreatic beta cells and in primary islets, RACK1 functions as an adaptor protein to scaffold IRE-1 and protein phosphatase 2 (PP2A).(13) In pancreatic beta cells under normal glucose settings, RACK1 scaffolds PP2A onto a complex with IRE-1, maintaining IRE-1 in an inactivated state and moderating insulin biosynthesis. During chronic hyperglycemia, RACK1 expression is increased and its interaction with PP2A is lost, which leads to IRE-1 phosphorylation and activation, and induction of the UPR. These findings suggest that induction of endoplasmic reticulum proteins and markers of ER stress in our study may have also resulted from RACK1 upregulation. Additional roles for RACK1 include interaction with insulin like growth factor-1 receptor (IGF-1R), to regulate IGF-1-mediated functions such as cell migration and cell survival. (22, 23)
Similar to RACK1, Diraison et al demonstrated that TCTP is up regulated in pancreatic beta cells by high glucose concentrations and this enhanced expression negatively regulates pro-apoptotic stimuli. (12) Tsai et al found TCTP to be required for pancreatic cell proliferation of mass establishment during development. (24) Their study also showed that beta cell-specific knockdown of TCTP resulted in attenuated p70S6 kinase phosphorylation and cyclin D2 and cyclin dependent kinase 2, reduced beta cell mass, and hyperglycemia, supporting a role beta cell upregulation of TCTP during adaptation to insulin resistance. (24) Alternatively, Kim et al demonstrated enhanced expression of TCTP in glomerular podocytes of streptozotocin treated diabetic mice. The knock-down of TCTP in these glomerular podocytes attenuated the activation of mTOR complex 1 downstream effectors, increased production of cyclin-dependent kinase inhibitors (phospho-4EBP1, phospho-p70S6K, p27 and p21), and podocyte hypertrophy. (25) Collectively, these studies suggest that induction of TCTP by high glucose conditions confers adaptive responses to cells. Protein expression of RACK1 and TCTP are inversely regulated in 7,12-dimethylbenzanthracene (DMBA)-induced pancreatic intraepithelial neoplasia and carcinoma and rats. (26) The findings in our study with IRE-BP1 Tg mice suggest the hypothesis that induction of RACK1 and TCTP1 leads to increased abundances of novel molecular scaffolding complexes which modifies islet beta cell viability by shifting from cell death to more a favorable molecular phenotype for cell survival or proliferation. The roles for RACK1 and TCTP in some of IRE-BP1 biologic effects might be through their interaction, or they can contribute to the activation of UPR through regulating the activation of IRE-1, or other cell adaptive signaling mechanism. These hypotheses are the focus of on-going and future studies.
Conclusion
Proteomic analysis of IRE-BP1 over-expression in pancreatic islet beta cells suggest IRE-BP1 (a) directly or indirectly through establishing hyperglycemia results in increased expression of ribosomal proteins and markers of ER stress and (b) leads to the enhanced and previously un-described interaction of glucose –regulated proteins RACK1 and TCTP.
Supplementary Material
Footnotes
Publisher's Disclaimer: This is a PDF file of an unedited manuscript that has been accepted for publication. As a service to our customers we are providing this early version of the manuscript. The manuscript will undergo copyediting, typesetting, and review of the resulting proof before it is published in its final citable form. Please note that during the production process errors may be discovered which could affect the content, and all legal disclaimers that apply to the journal pertain.
References
- 1.Villafuerte BC, Zhao W, Herington AC, Saffery R, Phillips LS. Identification of an insulin-responsive element in the rat insulin-like growth factor-binding protein-3 gene. J Biol Chem. 1997;272:5024–5030. doi: 10.1074/jbc.272.8.5024. [DOI] [PubMed] [Google Scholar]
- 2.Chahal J, Chen CC, Rane MJ, Moore JP, Barati MT, Song Y, Villafuerte BC. Regulation of insulin-response element binding protein-1 in obesity and diabetes: potential role in impaired insulin-induced gene transcription. Endocrinology. 2008;149:4829–4836. doi: 10.1210/en.2007-1693. [DOI] [PMC free article] [PubMed] [Google Scholar]
- 3.Villafuerte BC, Phillips LS, Rane MJ, Zhao W. Insulin-response element-binding protein 1: a novel Akt substrate involved in transcriptional action of insulin. J Biol Chem. 2004;279:36650–36659. doi: 10.1074/jbc.M404349200. [DOI] [PubMed] [Google Scholar]
- 4.Villafuerte BC, Barati MT, Song Y, Moore JP, Epstein PN, Portillo J. Transgenic expression of insulin-response element binding protein-1 in beta-cells reproduces type 2 diabetes. Endocrinology. 2009;150:2611–2617. doi: 10.1210/en.2008-1294. [DOI] [PMC free article] [PubMed] [Google Scholar]
- 5.Wu R, Kausar H, Johnson P, Montoya-Durango DE, Merchant M, Rane MJ. Hsp27 regulates Akt activation and polymorphonuclear leukocyte apoptosis by scaffolding MK2 to Akt signal complex. J Biol Chem. 2007;282:21598–21608. doi: 10.1074/jbc.M611316200. [DOI] [PubMed] [Google Scholar]
- 6.Harlow E, Lane D. Immunoaffinity purification: coupling antibodies to protein a or g bead columns. CSH Protoc. 2006 doi: 10.1101/pdb.prot4303. [DOI] [PubMed] [Google Scholar]
- 7.Uriarte SM, Rane MJ, Merchant ML, Jin S, Lentsch AB, Ward RA, McLeish KR. Inhibition of neutrophil exocytosis ameliorates acute lung injury in rats. Shock. 2013;39:286–292. doi: 10.1097/SHK.0b013e318282c9a1. [DOI] [PMC free article] [PubMed] [Google Scholar]
- 8.Ahmed M, Forsberg J, Bergsten P. Protein profiling of human pancreatic islets by two-dimensional gel electrophoresis and mass spectrometry. J Proteome Res. 2005;4:931–940. doi: 10.1021/pr050024a. [DOI] [PubMed] [Google Scholar]
- 9.Petyuk VA, Qian WJ, Hinault C, Gritsenko MA, Singhal M, Monroe ME, Camp DG, 2nd, Kulkarni RN, Smith RD. Characterization of the Mouse Pancreatic Islet Proteome and Comparative Analysis with Other Mouse Tissues. J Proteome Res. 2008 doi: 10.1021/pr800205b. [DOI] [PMC free article] [PubMed] [Google Scholar]
- 10.Waanders LF, Chwalek K, Monetti M, Kumar C, Lammert E, Mann M. Quantitative proteomic analysis of single pancreatic islets. Proc Natl Acad Sci U S A. 2009;106:18902–18907. doi: 10.1073/pnas.0908351106. [DOI] [PMC free article] [PubMed] [Google Scholar]
- 11.Schrimpe-Rutledge AC, Fontes G, Gritsenko MA, Norbeck AD, Anderson DJ, Waters KM, Adkins JN, Smith RD, Poitout V, Metz TO. Discovery of novel glucose-regulated proteins in isolated human pancreatic islets using LC-MS/MS-based proteomics. J Proteome Res. 2012;11:3520–3532. doi: 10.1021/pr3002996. [DOI] [PMC free article] [PubMed] [Google Scholar]
- 12.Diraison F, Hayward K, Sanders KL, Brozzi F, Lajus S, Hancock J, Francis JE, Ainscow E, Bommer UA, Molnar E, Avent ND, Varadi A. Translationally controlled tumour protein (TCTP) is a novel glucose-regulated protein that is important for survival of pancreatic beta cells. Diabetologia. 2011;54:368–379. doi: 10.1007/s00125-010-1958-7. [DOI] [PubMed] [Google Scholar]
- 13.Qiu Y, Mao T, Zhang Y, Shao M, You J, Ding Q, Chen Y, Wu D, Xie D, Lin X, Gao X, Kaufman RJ, Li W, Liu Y. A crucial role for RACK1 in the regulation of glucose-stimulated IRE1alpha activation in pancreatic beta cells. Sci Signal. 2010;3:ra7. doi: 10.1126/scisignal.2000514. [DOI] [PMC free article] [PubMed] [Google Scholar]
- 14.Adams DR, Ron D, Kiely PA. RACK1, A multifaceted scaffolding protein: Structure and function. Cell Commun Signal. 2011;9:22. doi: 10.1186/1478-811X-9-22. [DOI] [PMC free article] [PubMed] [Google Scholar]
- 15.Siddle K. Molecular basis of signaling specificity of insulin and IGF receptors: neglected corners and recent advances. Front Endocrinol (Lausanne) 2012;3:34. doi: 10.3389/fendo.2012.00034. [DOI] [PMC free article] [PubMed] [Google Scholar]
- 16.Chen S, Spiegelberg BD, Lin F, Dell EJ, Hamm HE. Interaction of Gbetagamma with RACK1 and other WD40 repeat proteins. J Mol Cell Cardiol. 2004;37:399–406. doi: 10.1016/j.yjmcc.2004.04.019. [DOI] [PubMed] [Google Scholar]
- 17.Rehmann H, Bruning M, Berghaus C, Schwarten M, Kohler K, Stocker H, Stoll R, Zwartkruis FJ, Wittinghofer A. Biochemical characterisation of TCTP questions its function as a guanine nucleotide exchange factor for Rheb. FEBS Lett. 2008;582:3005–3010. doi: 10.1016/j.febslet.2008.07.057. [DOI] [PubMed] [Google Scholar]
- 18.Berkowitz O, Jost R, Pollmann S, Masle J. Characterization of TCTP, the translationally controlled tumor protein, from Arabidopsis thaliana. Plant Cell. 2008;20:3430–3447. doi: 10.1105/tpc.108.061010. [DOI] [PMC free article] [PubMed] [Google Scholar]
- 19.Dong X, Yang B, Li Y, Zhong C, Ding J. Molecular basis of the acceleration of the GDP-GTP exchange of human ras homolog enriched in brain by human translationally controlled tumor protein. J Biol Chem. 2009;284:23754–23764. doi: 10.1074/jbc.M109.012823. [DOI] [PMC free article] [PubMed] [Google Scholar]
- 20.Engin F, Yermalovich A, Nguyen T, Hummasti S, Fu W, Eizirik DL, Mathis D, Hotamisligil GS. Restoration of the unfolded protein response in pancreatic beta cells protects mice against type 1 diabetes. Sci Transl Med. 2013;5:211ra156. doi: 10.1126/scitranslmed.3006534. [DOI] [PMC free article] [PubMed] [Google Scholar]
- 21.Bernales S, Papa FR, Walter P. Intracellular signaling by the unfolded protein response. Annu Rev Cell Dev Biol. 2006;22:487–508. doi: 10.1146/annurev.cellbio.21.122303.120200. [DOI] [PubMed] [Google Scholar]
- 22.Kiely PA, O’Gorman D, Luong K, Ron D, O’Connor R. Insulin-like growth factor I controls a mutually exclusive association of RACK1 with protein phosphatase 2A and beta1 integrin to promote cell migration. Mol Cell Biol. 2006;26:4041–4051. doi: 10.1128/MCB.01868-05. [DOI] [PMC free article] [PubMed] [Google Scholar]
- 23.Kiely PA, Sant A, O’Connor R. RACK1 is an insulin-like growth factor 1 (IGF-1) receptor-interacting protein that can regulate IGF-1-mediated Akt activation and protection from cell death. J Biol Chem. 2002;277:22581–22589. doi: 10.1074/jbc.M201758200. [DOI] [PubMed] [Google Scholar]
- 24.Tsai MJ, Yang-Yen HF, Chiang MK, Wang MJ, Wu SS, Chen SH. TCTP is essential for beta-cell proliferation and mass expansion during development and beta-cell adaptation in response to insulin resistance. Endocrinology. 2014;155:392–404. doi: 10.1210/en.2013-1663. [DOI] [PubMed] [Google Scholar]
- 25.Kim DK, Nam BY, Li JJ, Park JT, Lee SH, Kim DH, Kim JY, Kang HY, Han SH, Yoo TH, Han DS, Kang SW. Translationally controlled tumour protein is associated with podocyte hypertrophy in a mouse model of type 1 diabetes. Diabetologia. 2012;55:1205–1217. doi: 10.1007/s00125-012-2467-7. [DOI] [PubMed] [Google Scholar]
- 26.Wang L, Liu HL, Li Y, Yuan P. Proteomic analysis of pancreatic intraepithelial neoplasia and pancreatic carcinoma in rat models. World journal of gastroenterology: WJG. 2011;17:1434–1441. doi: 10.3748/wjg.v17.i11.1434. [DOI] [PMC free article] [PubMed] [Google Scholar]
Associated Data
This section collects any data citations, data availability statements, or supplementary materials included in this article.


