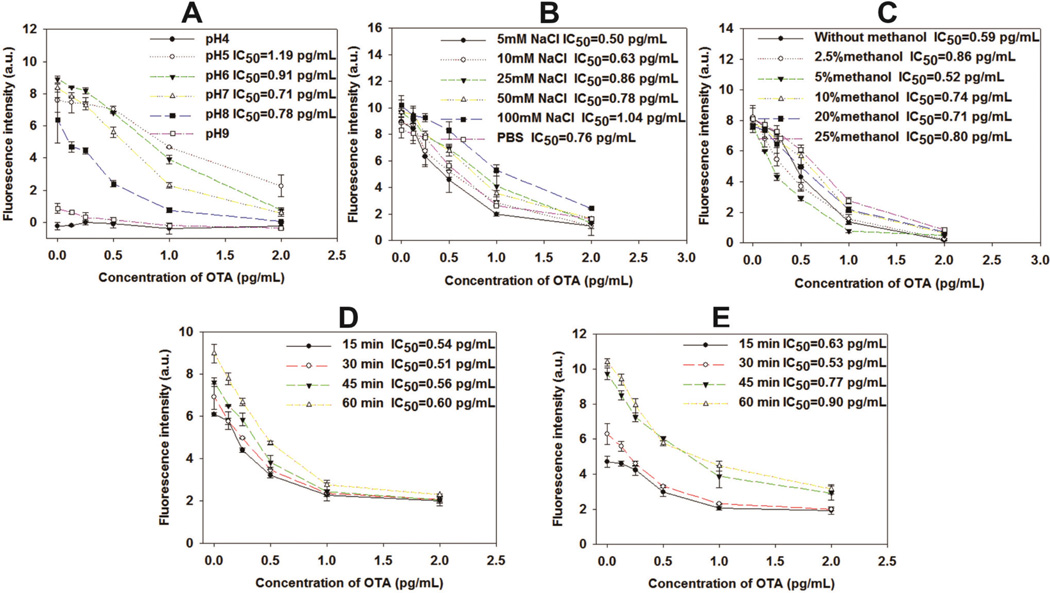
Fig. 2.
Optimization of the experimental conditions for fluorescence ELISA. The effects of (A) pH, (B) NaCl concentration, (C) methanol concentration, (D) immunoreaction time, and (E) enzyme reaction time on the performance of the direct competitive immunoassay. Vertical bars indicate the standard deviation (n = 3).

