

Abstract
The Generation R Study is a population-based prospective cohort study from fetal life until adulthood. The study is designed to identify early environmental and genetic causes and causal pathways leading to normal and abnormal growth, development and health from fetal life, childhood and young adulthood. This multidisciplinary study focuses on several health outcomes including behaviour and cognition, body composition, eye development, growth, hearing, heart and vascular development, infectious disease and immunity, oral health and facial growth, respiratory health, allergy and skin disorders of children and their parents. Main exposures of interest include environmental, endocrine, genomic (genetic, epigenetic, microbiome), lifestyle related, nutritional and socio-demographic determinants. In total, 9778 mothers with a delivery date from April 2002 until January 2006 were enrolled in the study. Response at baseline was 61%, and general follow-up rates until the age of 10 years were around 80%. Data collection in children and their parents includes questionnaires, interviews, detailed physical and ultrasound examinations, behavioural observations, lung function, Magnetic Resonance Imaging and biological sampling. Genome and epigenome wide association screens are available. Eventually, results from the Generation R Study contribute to the development of strategies for optimizing health and healthcare for pregnant women and children.
Keywords: Cohort study, Epidemiology, Pregnancy, Child, Adolescence
Introduction
The Generation R Study is a population-based prospective cohort study from fetal life until young adulthood. The background and design have been described in detail previously [1–7]. Briefly, the Generation R Study is designed to identify early environmental and genetic causes of normal and abnormal growth, development and health from fetal life until young adulthood. This multidisciplinary study focuses on several health outcomes including behaviour and cognition, body composition, eye development, growth, hearing, heart and vascular development, infectious disease and immunity, oral health and facial growth, respiratory health, allergy and skin disorders of children and their parents. Main exposures of interest include environmental, endocrine, genomic (genetic, epigenetic, microbiome) lifestyle related, nutritional and socio-demographic determinants. Full lists of exposures and outcomes are presented in Tables 1 and 2. An important focus of the study is on the identification of new early life determinants of common non-communicable diseases in adulthood or there risk factors, on which various papers have been published recently in this journal [8–26]. A detailed and extensive data collection has been conducted over the years, starting in the early prenatal phase and currently in early adolescence (age 13 years). Data collection in parents and their children included questionnaires, interviews, detailed physical and ultrasound examinations, behavioural observations, lung function, Magnetic Resonance Imaging (MRI) and biological sampling. In this paper, we give an update of the data collection in the children and their parents until the child’s age of 13 years.
Table 1.
Main outcomes per research area
| Maternal health | Cardiovascular health |
| Endothelial (dys)function | |
| Pregnancy complications | |
| Risk factors for osteoporosis | |
| Risk factors for type 2 diabetes | |
| Growth and physical development | Body composition and obesity |
| Bone development | |
| Childhood growth patterns | |
| Dental development | |
| Dental caries | |
| Fetal growth patterns and organ development | |
| Myopia | |
| Physical characteristics and appearance | |
| Puberty stages | |
| Risk factors for cardiovascular disease | |
| Risk factors for type 2 diabetes | |
| Behavioural and cognitive development | Attachment |
| Behavioural and emotional problems | |
| Brain development | |
| Child psychopathology | |
| Child risk taking behaviour (alcohol, drugs, smoking) | |
| Child physical activity and sedentary behaviours | |
| Child sleeping patterns | |
| Compliance and moral development | |
| Family interaction, parenting and child attachment | |
| Language delay | |
| Neuromotor development | |
| Neuropsychology—executive function | |
| Stress reactivity | |
| Use of social media | |
| Verbal and nonverbal cognitive development | |
| Airways, asthma, allergy and skin disordes | Airways and lung structure |
| Acne | |
| Allergy | |
| Asthma | |
| Eczema | |
| Hearing loss | |
| Lung function | |
| Physical (exercise) condition | |
| Microbiome skin | |
| Skin color | |
| Infectious and inflammatory diseases | Celiac disease |
| Infectious diseases and immune system | |
| Health and healthcare | Health care utilization |
| Social health inequalities | |
| Qualitiy of life |
Table 2.
Main determinants
| Endocrine determinants | Maternal and fetal thyroid hormone levels |
| Maternal thyroid autoimmunity | |
| Maternal hCG levels | |
| Childhood thyroid hormone and cortisol levels | |
| Environmental determinants | Air pollution during pregnancy and childhood (PM10, NO2) |
| Bisphenol A, pesticides, phthalates | |
| Housing conditions | |
| Home environment | |
| Genetic, epigenetic and microbiome determinants | Genetic variants (genome wide, candidate gene) DNA methylation (genome wide, candidate gene) |
| Lifestyle related determinants | Parental alcohol consumption |
| Parental anthropometrics and obesity | |
| Parental smoking | |
| Parental working conditions | |
| Child anthropometrics and obesity | |
| Child music listening behaviour | |
| Child sedentary and physical activity behaviour | |
| Child smoking | |
| Dental care | |
| Nutritional determinants | Maternal nutrition (products, patterns) |
| Folic acid supplement use | |
| Breastfeeding | |
| Infant and childhood nutrition (timing, products, patterns) | |
| Nutritional biomarkers (folate, homocystein, vitamin B12, vitamin D) | |
| Infection and micriobiota | Nasopharyngeal microbiota and bacterial carriage |
| Faeces microbiota | |
| Social-demographic determinants | Ethnicity |
| Parental education, employment status and household income | |
| Parental marital status | |
| Parental psychopathology |
Study design
The Generation R Study is conducted in Rotterdam, the second largest city in the Netherlands. Rotterdam is situated in the Western part of the Netherlands. The study is a population-based prospective cohort study from fetal life onwards. Pregnant women with an expected delivery date between April 2002 and January 2006 living in Rotterdam were eligible for participation in the study. Extensive assessments are performed in mothers, fathers and their children. Measurements were planned in early pregnancy (gestational age <18 weeks), mid pregnancy (gestational age 18–25 weeks) and late pregnancy (gestational age >25 weeks). The fathers were assessed once during the pregnancy of their partner. The children form a prenatally recruited birth cohort that will be followed at least until young adulthood. In the preschool period, which in the Netherlands refers to the period from birth until the age of 4 years, data collection was performed by a home-visit at the age of 3 months, and by repeated questionnaires and routine child health centers visits. Information from these routine visits was obtained and used for the study. Additional detailed measurements of fetal and postnatal growth and development were conducted in a randomly selected subgroup of Dutch children and their parents at a gestational age of 32 weeks and postnatally at the ages of 1.5, 6, 14, 24, 36 and 48 months in a dedicated research center.
Around the ages of 6 and 10 years all children and their parents were invited to visit our research center in the Erasmus MC-Sophia Children’s Hospital to participate in hands-on measurements, advanced imaging modalities, behavioural observations and biological sample collection. MRI scans of all participating children were made in order to image abdominal composition, brain, lungs, cardiovascular system, fat tissue, kidney, liver, and hip development. Furthermore, the parents received 6 questionnaires during this period. Children also received their own questionnaire around the age of 10. Information from municipal health services, schools and general practicionars has also been collected.
In the current adolescence period, all children and their parents will be re-invited around the child’s age of 13 and 16 years. We will again assess their growth, development and health in our research center and with questionnaires. We will perform MRI scans of the abdominal composition (fat), brain, and hip development.
Study cohort
Eligibility and enrolment
Eligible mothers were those who were resident in the study area at their delivery date and had an expected delivery date from April 2002 until January 2006. We aimed to enrol mothers in early pregnancy but enrolment was possible until birth of their child. The enrolment procedure has been described previously in detail [1–4]. In total, 9778 mothers were enrolled in the study. Of these mothers, 91% (n = 8879) was enrolled during pregnancy. Partners from mothers enrolled in pregnancy were invited to participate. In total, 71% (n = 6347) of all fathers were included. A total of 1232 pregnant women and their children form the subgroup of Dutch children for additional detailed studies. The overall response rate based on the number of children at birth was 61%.
The study group is an multi ethnic cohort. Ethnicity was defined according the classification of Statistics Netherlands [27–32]. Ethnic background was assessed in accordance with the country of birth of participants themselves and his or her parents. A participant was considered to have non-Dutch ethnic origin if one of her parents was born abroad. If both parents were born abroad, the country of birth of the participant’s mother determined the ethnic background [33]. The largest ethnic groups were the Dutch, Surinamese, Turkish and Moroccan groups. We also constructed a dichotomous variable “Western/non-Western”ethnicity. Western ethnicity included Dutch, European, American Western (including North American), Asian Western (including Indonesian and Japanese) and Oceanian. Non-Western ethnicity included Turkish, Moroccan, Surinamese, Antillean, Cape Verdean, African, Asian (except Indonesia and Japan) and South American and Central American [33, 34].
Response and follow-up
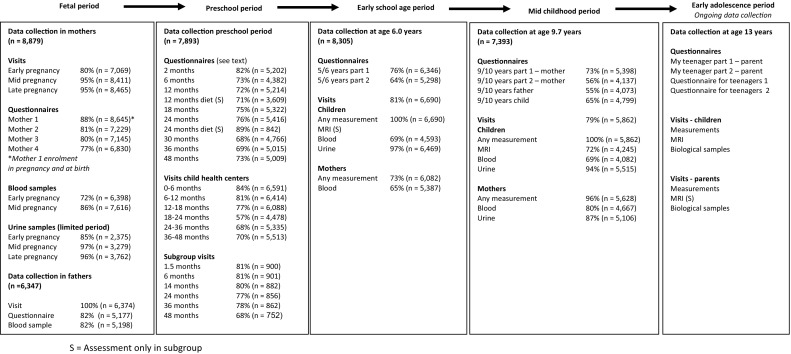
Figure 1 shows the enrolment and follow-up rates of the children and parents included in the Generation R Study. The 9778 mothers enrolled in the study gave birth to 9749 live born children. During the preschool period (0–4 years), the logistics of the postnatal follow-up studies were embedded in the municipal routine child care system and restricted to only part of the study area. In total 1166 children lived outside this defined study area at birth and were therefore not approached for the postnatal follow-up studies during the preschool period. Of the remaining 8583 children, 690 (8%) parents did not give consent, or their children died or were lost to follow-up, leaving 7893 children for the preschool studies. At the age of 6 years (early school age), we invited all 9278 children from the original cohort of 9749 children to participate in follow-up studies. This invitation was independent of their home address and participation in the preschool period. In total, 8305 children (90% of those who were invited (n = 9278) and 85% of the original cohort (n = 9749)) still participated in the study at this age, of whom 6690 visited the research center at a median age of 6.0 years. For the follow-up phase at the age of 10 years (mid childhood period) 730 children of the 9278 could not be invited. In total, 7393 children (86% of those who were invited (n = 8548) and 76% of the original cohort (n = 9749)) participated in the study in mid childhood, of whom 5862 visited the research center at a median age of 9.7 years. Of the 8548 children invited in the mid childhood period, 456 had withdrawn and 124 children were lost to follow-up during this period, leaving 7968 children for invitation around the age of 13 (early adolescence period).
Fig. 1.

Enrolment and follow-up rates in the Generation R Study
Table 3 shows the general characteristics of the mothers who were enrolled in the study at baseline, and who remaind in the study until the child’s age of 13 years. The median age of the women at enrolment was 30.5 (95% range, 19.3–39.6) years, 58% percent of those mothers were of the Dutch nationality, 43% of the mothers were highly educated and 55% had a high household income. The mean birth weight of the children was 3397 (SD 582) grams and they were born at a median gestational age of 40.0 (95% range, 34.9–42.3) weeks. Compared to the baseline characteristics, the mothers who still participated in the study at follow up were older, more frequently of Dutch nationality and higher educated.
Table 3.
General characteristics
| Fetal period (n = 9749) | Preschool period 0–5 years (n = 7893) | Early school age/ Mid childhood period 6–11 years (n = 8305) | Adolescence period 12–16 years (n = 7968) | |
|---|---|---|---|---|
| Mothers | ||||
| Age at enrolment (years) | 30.5 (19.3, 39.6) | 31.0 (19.6, 39.8) | 31.1 (19.9, 39.9) | 31.3 (20.0, 39.9) |
| Ethnicity | ||||
| Dutch, other-European (%) | 58 | 61 | 64 | 65 |
| Surinamese (%) | 9 | 8 | 8 | 8 |
| Moroccan (%) | 6 | 6 | 6 | 5 |
| Turkish (%) | 8 | 8 | 8 | 7 |
| Dutch Antilles (%) | 3 | 2 | 2 | 2 |
| Cape Verdian (%) | 4 | 4 | 4 | 4 |
| Others (%) | 12 | 11 | 8 | 9 |
| Educational level | ||||
| Low (no/primary education) (%) | 11 | 10 | 9 | 8 |
| Intermediate (secondary school, vocational training) (%) | 46 | 43 | 42 | 41 |
| High (Bachelor’s degree, University) (%) | 43 | 47 | 49 | 51 |
| Pre-pregnancy BMI | 23.6 (4.4) | 23.5 (4.2) | 23.5 (4.1) | 23.5 (4.1) |
| Net household income, per month | ||||
| <800 Euros (%) | 9 | 8 | 7 | 6 |
| 800–2200 Euros (%) | 36 | 34 | 32 | 32 |
| >2200 Euros (%) | 55 | 58 | 61 | 62 |
| Children | ||||
| Sex | ||||
| Male (%) | 51 | 51 | 51 | 50 |
| Female (%) | 49 | 49 | 49 | 50 |
| Ethnicity | ||||
| Dutch, other-European (%) | 62 | 65 | 67 | 68 |
| Surinamese (%) | 8 | 7 | 7 | 7 |
| Moroccan (%) | 7 | 6 | 6 | 6 |
| Turkish (%) | 8 | 8 | 7 | 6 |
| Dutch Antilles (%) | 4 | 3 | 3 | 3 |
| Cape Verdian (%) | 3 | 3 | 3 | 3 |
| Others (%) | 8 | 8 | 7 | 7 |
| Birth weight (grams) | 3397 (582) | 3404 (572) | 3412 (572) | 3411 (576) |
| Gestational age at birth (weeks) | 40.0 (34.9, 42.3) | 40.0 (35.4, 42.3) | 40.1 (35.4, 42.3) | 40.1 (35.4, 42,3) |
Values are means (standard deviation), percentages or medians (95% range)
Measurements
Data collection during pregnancy and fetal life
Physical examinations were planned at each visit in early pregnancy, mid pregnancy and late pregnancy and included height, weight and blood pressure measurements of both parents (Table 4).
Table 4.
Assessments in mothers, fathers and their children during the fetal period
| Early pregnancy | Mid pregnancy | Late pregnancy | Birth | |
|---|---|---|---|---|
| Mother | ||||
| Physical examination | + | + | + | |
| Questionnaire | + | + | + | |
| Interview | S | |||
| Fetal growth ultrasound exam | + | + | + | |
| Fetal organ ultrasound exam | S | |||
| Blood sample | + | + | ||
| Urine sample | + | + | + | |
| Father (or partner) | ||||
| Physical examination | + | +a | +a | |
| Questionnaire | + | |||
| Psychiatric interview | S | |||
| Blood sample | + | |||
| Child | ||||
| Physical examination | + | |||
| Cord blood | + | |||
Early pregnancy: gestational age <18 weeks; mid pregnancy: gestational age 18–25 weeks; late pregnancy: gestational age >25 weeks
+ = Assessment in whole cohort
S = Assessment only in subgroup
aIn case of intake at mid- or late pregnancy
Mothers received four postal questionnaires and fathers received one postal questionnaire during pregnancy. Topics in these questionnaires were:
Mother 1: medical and family history, previous pregnancies, quality of life, life style habits, housing conditions, ethnicity, and educational level;
Mother 2: diet, including macronutrients and micronutrients;
Mother 3: current pregnancy, quality of life, life style habits, and psychopathology;
Mother 4: current pregnancy, quality of life, life style habits, working conditions, household income, and self-esteem;
Father: medical history, family history, life style habits, educational level, and psychopathology.
Blood samples were collected in early (mother, father) and mid-pregnancy (mother) and at birth (child). A detailed overview of the design and response of the biological sample collection and available measurements is given elsewhere [5, 7].
Fetal ultrasound examinations were performed at each prenatal visit. These ultrasound examinations were used to establish gestational age and to assess fetal growth patterns [35, 36]. These methods have previously been described in detail [37–39]. Longitudinal curves of all fetal growth measurements (head circumference, biparietal diameter, abdominal circumference and femur length) were created resulting in standard deviation scores for all of these specific growth measurements. Placental hemodynamics including resistance indices of the uterine and umbilical arteries have been measured in second and third trimester [40–42]. Detailed measurements of fetal brain, heart and kidney development were done in the subgroup [40, 43–48].
The obstetric records of mothers have been retrieved from hospitals and mid-wife practices to collect information about pregnancy progress and outcomes. Specialists in the relevant field coded items in these records [49].
Data collection during the preschool period
At the age of 3 months, home visits were performed to assess neuromotor development using an adapted version of Touwen’s Neurodevelopmental examination and to perform a home environment assessment [50–53]. Information about growth (length (height), weight, head circumference) was collected at each visit to the routine child health centers in the study area using standardized procedures [54] (Table 5).
Table 5.
Assessments in mothers, fathers and children during the preschool period
| Age (months) | |||||||||||||
|---|---|---|---|---|---|---|---|---|---|---|---|---|---|
| 2 | 3 | 4 | 6 | 11 | 12 | 14 | 18 | 24 | 30 | 36 | 45 | 48 | |
| Child | |||||||||||||
| Questionnaire (parent) | + | + | + | + | + | + | + | + | + | ||||
| Physical examination | + | + | + | + | + | + | + | + | + | ||||
| Brain ultrasound | S | ||||||||||||
| Cardiac and renal ultrasound | S | S | |||||||||||
| Blood pressure | S | ||||||||||||
| Airway inflammation | S | S | |||||||||||
| Behavioural observation | S | S | S | ||||||||||
| Bacterial carriage | S | S | S | S | S | ||||||||
| Blood sample | S | S | S | ||||||||||
| Mother | |||||||||||||
| Questionnaire | + | + | + | S | |||||||||
| Interaction with child | S | S | |||||||||||
| Father (or partner) | |||||||||||||
| Questionnaire | + | ||||||||||||
| Interaction with child | S | ||||||||||||
+ = Assessment in whole cohort
S = Assessment only in subgroup
During the preschool period, parents received 8 questionnaires, of which one was specifically for fathers. Items included in these questionnaires and their references are listed in Tables 6 and 7. Response rates based on the number of sent questionnaires are shown in Fig. 2. Not all children received each questionnaire due to logistical constraints and delayed implementation of some of the questionnaires after the first group of children reached the target age for those questionnaires. Thus, although response rates may be similar, the absolute number of completed questionnaires differs between different ages. Response rates presented in Fig. 2 are based on the number of sent questionnaires.
Table 6.
Themes in postnatal questionnaires until early adolescence - Parental questionnaires
| Main themes | 2 months | 6 months | 12 months | 18 months | 24 months | 30 months | 36 monthse | 48 months | 6 yearsf | 10 years g | 13 years |
|---|---|---|---|---|---|---|---|---|---|---|---|
| Mother/father | |||||||||||
| General health | |||||||||||
| Quality of life [101] | + | + | |||||||||
| Pregnancy and complications | + | + | |||||||||
| Life events | + | ||||||||||
| Medical history | + | ||||||||||
| Lifestyle [102, 103] | + | + | + | ||||||||
| Eating behaviour [104] | + | ||||||||||
| Social and demographic factors | |||||||||||
| Housing and living conditionsa [105, 106] | + | + | + | + | + | + | + | ||||
| Work and working conditions | + | + | + | ||||||||
| Educational level and household income | + | + | + | + | + | ||||||
| Family activities and social support [107, 108] | + | + | |||||||||
| Mental health and stress | |||||||||||
| Parenting [109, 110] | + | + | + | ||||||||
| Depressive symptoms [111] | + | + | |||||||||
| Psychopathology [112–114] | + | + | + | + | |||||||
| Family functioning [115, 116] | + | + | |||||||||
| Child | |||||||||||
| Diet and physical activity | |||||||||||
| Dietb [117, 118] | + | + | + | +/S | + | ||||||
| Eating behaviour [119–127] | + | + | + | + | + | ||||||
| Television watching, use of computer and physical activity [128–131] | + | + | + | + | + | ||||||
| Day-care, School | + | + | + | + | + | + | |||||
| Childhood health and diseases | |||||||||||
| Quality of life [132–135] | + | + | + | + | |||||||
| Fever and infectious diseases [136] | + | + | + | + | + | + | + | + | |||
| Asthma, Asthma related symptoms and eczema [137–140] | + | + | + | + | + | + | + | + | |||
| Acne [141] | + | ||||||||||
| Allergy | + | + | + | + | |||||||
| Accidents [142, 143] | + | + | + | + | + | + | |||||
| Seizuresc | + | + | + | + | + | + | + | ||||
| Abdominal pain, stool pattern [144] | + | + | + | + | + | ||||||
| Doctors visit | + | + | + | + | + | + | + | ||||
| Teeth and dental care [145–148] | + | + | |||||||||
| Physical characteristics | + | ||||||||||
| Hearing (listen to music, use of headphone) [149] | + | + | |||||||||
| Vision/Eyes (glasses, viewing habits (“close” and “far away”)) | + | + | |||||||||
| Behaviour and cognition | |||||||||||
| Sleeping, crying and soothing [150–152] | + | + | + | + | + | + | |||||
| Temperament [153–156] | + | + | + | ||||||||
| Motor development [157] | + | + | + | + | + | ||||||
| Behaviour and emotional problems [158–161] | + | + | + | + | + | + | |||||
| Pain perception [162–164] | + | + | + | ||||||||
| Language development [165] | + | + | + | + | |||||||
| Non-verbal cognition [166] | + | + | |||||||||
| Executive function [167] | + | ||||||||||
| Prosocial behaviour [168–171] | + | + | |||||||||
| Autistic traits [172–174] | + | + | |||||||||
| Obsessive compulsive disorder [175] | + | + | |||||||||
| Bullying | + | ||||||||||
| Social media use [176, 177] | + | ||||||||||
+ = Assessment in whole cohort. S = Assessment only in subgroup
a Housing and living conditions include information about family structure, poverty, (environmental) smoking and pets
b Diet questionnaires included in 2, 6 and 12 months questionnaire. Additional food frequency questionnaires at 12 months for all Dutch speaking children and at 24 months for the Dutch subgroup children
c Screening 10 items questionnaire on seizures. Screen positives receive additional questionnaire and are being asked for their medical records
d Infant Behaviour Questionnaire at the age of 6 months, Child Behaviour Checklist thereafter
e For parenting, psychopathology and child behaviour additional questionnaire for fathers
f Diet and part of behaviour and cognition additional at the age of 8 years
g For medical history, lifestyle, depressive symptoms, psychopathology, family activities, behaviour and emotional problems additional questionnaire for fathers
Table 7.
Themes in postnatal questionnaires—child questionnaire
| Main themes | 10 years | 13 years |
|---|---|---|
| Friendships [161, 178] | + | + |
| Bullying [179–181] | + | |
| General health [132] | + | |
| Abdominal pain, stool pattern [182] | + | |
| Social status [183] | + | |
| Development and well-being [122, 184, 185] | + | |
| Eating behaviour [126, 127, 186–189] | + | + |
| Television watching and physical activity [128, 131, 180, 181] | + | + |
| Temperament [182, 183] | + | |
| Behaviour [161, 175, 194, 195] | + | + |
| Body Image [196, 197] | + | + |
| Self-perception [198–200] | + | + |
| Sleeping behaviour [201–204] | + | + |
| Puberty stages [203, 205] | + | |
| Social media [176, 177] | + | |
| Hearing (listen to music, use of headphone) | + | |
| Vision (viewing habits (“close” and “far away”)) | + |
+ = Assessment in whole cohort
Fig. 2.
Response to the questionnaires and visits in the Generation R Study
During the preschool period, children participating in the subgroup were invited six times to a dedicated research center. Measurements at these visits included physical examinations (height, weight, head circumference, skinfold thickness and waist—hip ratio, Touwen’s Neurodevelopmental Examination) and ultrasound examinations (brain, cardiac and kidney structures) [44, 55–59]. Dual X Energy Absorptiometry (DXA) scanning and Fractional exhaled Nitric Oxide (FeNO) measurements have been performed in a smaller subgroup [60, 61]. Blood pressure was measured at the age of 24 months [62, 63]. Observations of parent–child interaction and behaviour, such as executive function, heart rate variability, infant-parent attachment, moral development, and compliance with mother and child have been repeatedly performed and with father and child once [64–68]. Biological materials were collected if parents gave consent [69–71].
Data collection during the early school age, mid childhood and adolescence period
From the age of 6 years onwards, we invite all participating children to a well-equipped and dedicated research center at the Erasmus MC-Sophia Children’s Hospital every 3–4 years. Visits at age 6 and 10 years have been completed, at age 13 years are ongoing and age 16 years are being planned.
Currently, the total visit takes about 3 h and all measurements are grouped in thematic 35 min blocks. Clinically relevant results are discussed with the children and their parents and, if needed, children or parents are referred to their general practitioner or other relevant health care provider.
At each age, we collect data using questionnaires on growth, health and physical and mental development of the children. Also, we collect information on childhood diet and behaviour (Table 6, 7). These questionnaires are sent to the primary caregiver.
The measurements at the research center are focused on several health parameters including behaviour and cognition, body composition, bone health and muscle function, eye development, growth, hearing, heart and vascular development, infectieus diseases and immunity, oral health and facial growth, respiratory health, allergy and skin disorders (Table 8) [72–79].
Table 8.
Assessments in mothers and children during early school age, mid childhood and early adolescence visit
| Early school age (median age 6.0 (95% range 5.6–7.9) years) | Mid childhood (median age 9.7 (95% range 9.4–10.8) years) | Early adolescence (13 years, ongoing datacollection) | |
|---|---|---|---|
| Mothers | |||
| Behaviour and cognition | |||
| Cognition | + | ||
| Dutch language skills | + | ||
| Interaction with child | + | ||
| Life events | + | ||
| Interview about health, parenting, family situation, depression | + | ||
| Maternal health | |||
| Anthropometrics and blood pressure | + | + | + |
| Arterial stiffness | + | ||
| Endothelial function | + | ||
| Body composition and bone mineral density (DXA) | + | + | |
| Intima-media thickness | + | ||
| Physical appearance | + | + | |
| Ultrasound heart | + | ||
| Eyes; retinal vasculature, refraction | + | ||
| Biological samples | |||
| Blood sample | + | + | |
| Urine sample | + | + | |
| Hair sample | + | ||
| Child | |||
| Behaviour and cognition | |||
| Behaviour and behavioural observation | + | + | + |
| Cognition | + | + | + |
| Language development | + | + | + |
| Pain perception | + | ||
| Risk taking interview | + | ||
| Cardiovascular and metabolic development | |||
| Anthropometrics and blood pressure | + | + | + |
| Arterial stiffness | + | ||
| Body composition and bone mineral density (DXA) | + | + | + |
| Bone mineral density and geometry of the tibia (PQCT) | + | + | |
| Intima-media thickness | + | + | |
| Ultrasound abdominal fat | + | + | |
| Ultrasound heart | + | + | |
| Ultrasound kidney | + | ||
| Physical appearance | + | + | |
| Puberty stages (Tanner) | + | ||
| Eyes, ears and mouth | |||
| Eyes; visual acuity, retinal picture, refraction, IOL master, OCT | + | + | + |
| Dental status and development | + | + | + |
| Face development | + | + | |
| Hearing | + | + | |
| Taste experience | + | ||
| Lungs | |||
| Airway inflammation | + | ||
| Lung function | + | + | + |
| Exercise test (SRT) | + | ||
| Allergy test | + | ||
| Dermatology | |||
| Spectrophotometry | + | ||
| Biological samples | |||
| Nasopharynx bacterial carriage | + | + | |
| Blood and urine sample | + | + | + |
| Dental plaque | |||
| Faeces microbiota | + | ||
| Hair sample | + | + | + |
| Saliva | + | + | |
| Skin swab (head, elbow) | + | ||
DXA Dual energy X-ray Absorptiometry scan, PQCT Peripheral quantitative computertomografie scan, SRT steep ramp test, IOL intraoculaire measurement, OCT optical coherence tomografie
S = assessment only in subgroup
We use various advanced imaging techniques including ultrasound and Doppler (GE LOGIQ E9, Milwaukee, WI, USA) for measuring thoracic and abdominal structures, Dual X Absorptiometry for measuring body composition and bone mineral density (iDXA scanner, GE Healthcare, Madison, WI, USA) and Peripheral Quantitative Computed Tomography (PQCT, Stratec Medicin Technik, Pforzheim, Germany) for measuring bone mineral density and geometry of the tibia. We use orthopantomograms (OP 200 D, Intrumentarium Dental, Tuusula, Finland) for measuring dental development.
MRI has been used for brain imaging in a subgroup (n = 801) of 6–8 year old children using a hospital-based 3.0 Tesla MRI scanner (Discovery MR750, GE Healthcare, Milwaukee, WI, USA) [80–83]. From 2014 onwards, we use a dedicated 3.0 Tesla MRI (Discovery MR750, GE Healthcare, Milwaukee, WI, USA) for brain and total body imaging of all children participating in the study at the mid childhood visit (age 10 years) (see Table 9 for the MRI outcome measures). We use a mock MRI scanner, to familiarize the children and get use to the scanning procedures. Children are scanned using standard imaging and positioning protocols, wearing light clothing without metal objects while undergoing the scanning procedure. Total scanning time amounts to approximately 60 min. The scanner is operated by trained research technicians and all imaging data are collected according to standardized imaging protocols. Changes or updates in hardware are avoided. Changes or updates in software configuration are minimized and regular checks with phantoms are performed to secure validity of cross-subject and cross-scan comparisons. Imaging is performed without administration of contrast agents. All imaging data are stored on a securely backed-up research picture archiving system, using programmed scripts to check for completeness of the data received. We will re-scanning the abdominal composition (fat), brain imaging and hip development during adolescence (age 13 years) of all participating children in Generation R. MRI scan of the brains will also be conducted in the parents of a subgroup of Generation R participants. This research is focused on aging effects of the brains in young adults and follow up of mothers who experienced gestational hypertensive complications.
Table 9.
MRI measurements in children of the Generation R Study
| Early school age (median age 8.0 (95% range 6.3–10.1) years) | Mid childhood (median age 9.9 (95% range 9.5–11.9) years) | Early adolescence (13 years, ongoing datacollection) | |
|---|---|---|---|
| Children | |||
| Brain measurements | |||
| Structural imaging | |||
| 3D T1-weighted GRE sequence | X(S) | X | X |
| 2D-PD-weighted TSE sequence | X(S) | X | X |
| Diffusion tensor imaging (DTI) | X(S) | X | X |
| Resting state functional MRI | X(S) | X | X |
| Lungs | |||
| Inspiratory volume | X | ||
| Expiratory volume | X | ||
| Sizes of the trachea | X | ||
| Sizes of the main bronchi | X | ||
| Chronic obstructive lung problems | |||
| Air trapping | X | ||
| Atelectasis | X | ||
| Cardiac measurements | |||
| Structural cardiac measurements | X | ||
| Diastolic volume | X | ||
| Cardiac mass | X | ||
| Functional cardiac measurements | X | ||
| Systolic volume | X | ||
| Ejection fraction | X | ||
| Stroke volume | X | ||
| Aortic diameter | X (S) | ||
| Total visceral adipose tissue from top of liver to femur head | |||
| Fat volume/mass | X | x | |
| Subcutaneous adipose tissue from top of liver to femur head | |||
| Fat volume/mass | X | x | |
| Pericardial fat | |||
| Fat volume/mass | X | x | |
| Kidney | |||
| Length | X | ||
| Width | X | ||
| Depth | X | ||
| Volume | X | ||
| Liver | |||
| Fat fraction | X | ||
| Liver volume | X | ||
| Structure and morphology of the hipbone | X | X | |
| Testicular volume | X | ||
| Ovarial volume | X | ||
S = assessment only in subgroup
Blood and urine samples are collected in the mothers and their children during every visit. A detailed overview of the design and response of the biological sample collection and available measures is given elsewhere [5, 7].
Genomics: genetic, epigenetic and microbiome biobank
DNA from parents and children has been extracted and used for genotyping using taqman analyses for individual genetic variants and using a genome-wide association scan (GWAS) using the Illumina 670 K platform in the children [5, 7]. For genotyping, we used the infrastructure of the Human Genomics Facility (HuGe-F) of the Genetic Laboratory of the Department of Internal Medicine (www.glimdna.org). The GWAS dataset underwent a stringent QC process, which has been described in detail previously [5, 7, 84]. Most GWAS analyses are strongly embedded in the Early Growth Genetics (EGG) (http://egg-consortium.org/) and Early Genetics and Longitudinal Epidemiology (EAGLE) Consortia, in which several birth cohort studies combine their GWAS efforts focused on multiple outcomes in fetal life, childhood and adolescence. These efforts have already led to successful identification of various common genetic variants related to birth weight, infant head circumference, childhood body mass index, bone development and obesity and atopic dermatitis [85–91]. DNA from parents is used for genotyping for candidate gene or replication studies.
DNA methylation was measured on a genome wide level in a subgroup of Dutch children, using the Illumina Infinium HumanMethylation450 BeadChip (Illumina Inc., San Diego, USA). We used cord blood samples of 1339 children, blood samples in 469 children aged 6 years and blood samples in 425 children aged 10 years. Quality control and normalization of analyzed samples was performed using standardized criteria. Many of the epigenome-wide association analyses are performed in the context of the Pregnancy And Childhood Epigenetics (PACE) Consortium (http://www.niehs.nih.gov/research/atniehs/labs/epi/pi/genetics/pace/index.cfm), which brings together studies with epigenome-wide DNA-methylation data in pregnant women, newborns and/or children. Recent studies have identified differentially methylated sites in association with maternal smoking, maternal folate levels, maternal stress and air pollution during pregnancy [92–95].
Gut microbiota profiles were determined by Next Generation Sequencing (on Illumina MiSeq) of the V3 and V4 variable regions of the 16S ribosomal RNA gene in DNA extracted from feacal samples. Samples were collected at mid childhood in 2414 children. Phylogenetic de novo profiling was performed using the QIIME [96] and USEARCH [97] software packages and resulted in an operational taxonomic unit table with 239 species, 109 genera and 8 phyla. For example, those samples can be used for studying the effects of the fecel microbiota with overweight or obesity [98–100].
Ethics
The general design, all research aims and the specific measurements in the Generation R Study have been approved by the Medical Ethical Committee of Erasmus MC, University Medical Center Rotterdam. New measurements are only introduced into the study after approval of the Medical Ethical Committee. Participants need to give written informed consent for each phase of the study (fetal, preschool, childhood and adolescence period). From the age of 12 years onwards, children must sign their own consent form, in accordance with Dutch Law. At the start of each phase, children and their parents receive written and oral information about the study. Even with consent, when the child or the parents are not willing to participate actively, specific measurements are skipped or no measurements at all are performed.
Follow-up and retention strategies
Thus far, loss to follow-up has been lower than 10%. Major efforts are made to keep the children and parents involved in the study and to minimize loss to follow-up. Several strategies have been implemented and are currently part of the study design:
Addresses: new addresses of participants, which are known by the municipal health service, can be retrieved by the study staff;
Newsletters: participants receive two to four newsletters per year, in which several results of the study are presented and explained, questions of participants are answered and new research initiatives are presented;
Facebook: every week we post a short news update about the ongoing research on our facebook page;
Website: we have an up-to-date website where participants can find information about the ongoing research, the procedures at the dedicated research center and our contact information;
Presents and discounts: all children who visit our research center receive small presents. Also, discount offers are regularly presented in the newsletter;
Transport costs: all costs for transport and parking related to visits to the research center are reimbursed;
Reminders for questionnaires: when the questionnaire has not been returned within 3 weeks, a kind reminder letter is sent to the parents. After 6 weeks, if the questionnaire still has not been returned, the parents receive a phone call. If necessary, help with completing the questionnaire is offered and the importance of filling out the questionnaire is explained once more during this phone call;
Individual feedback: if clinically relevant, results of measurements are discussed with the parents and children at the visit. If necessary, follow-up appointments with the general practitioner are planned;
Support for non-Dutch speaking participants: all study materials such as questionnaires, newsletters, website, and information folders are available in three languages (Dutch, English, and Turkish). Furthermore, staff from different ethnic backgrounds is available and verbally translate these materials into Arabic, French and Portuguese. As such, the study staff is able to communicate with all participants;
Additional help: children and parents who showed low response rates for different measurements, showed difficulties in completing questionnaires or require additional explanation or support are pro-actively contacted by one dedicated member of the study staff;
Home visits: We visit children and parents who cannot be contacted by phone, e-mail or letter. Most visits are planned in the evenings to have higher chances that both parents and children are at home.
Power, datamanagement, privacy protection
Power calculations for the Generation R Study are shown in Tables 10 and 11. Due to missing values and loss to follow-up, most analyses in the study are not based on data in all subjects. Therefore, these power calculations demonstrated are based on 7000 subjects in the whole cohort and 700 subjects in the subgroup. The presented power calculations are conservative since most studies will assess the effects of continuous instead of dichotomous exposures and studies may be focused on outcomes collected in more than only 1 year.
Table 10.
Effects sizes that can minimally be detected according to the prevalence of the exposure
| Proportion exposed (%) | Whole cohort (n = 7000) | Subgroup (n = 700) |
|---|---|---|
| 50 | 0.067 | 0.212 |
| 25 | 0.077 | 0.276 |
| 10 | 0.112 | 0.353 |
| 5 | 0.154 | 0.486 |
| 1 | 0.337 | 1.064 |
The presented effect sizes are detectable proportions of the standard deviation with a type I error of 5% and a type II error of 20% (power 80%)
Table 11.
Relative risks that can minimally be detected according to the prevalence of the exposure
| Proportion exposed (%) | Incidence (1 year) of outcome of interest | |||||
|---|---|---|---|---|---|---|
| Whole cohort (n = 7000) | Subgroup (n = 700) | |||||
| 10% | 5% | 1% | 10% | 5% | 1% | |
| 50 | 1.23 | 1.33 | 1.83 | 1.83 | 2.28 | 4.94 |
| 25 | 1.26 | 1.38 | 1.94 | 1.96 | 2.46 | 5.41 |
| 10 | 1.39 | 1.56 | 2.42 | 2.48 | 3.26 | 7.92 |
| 5 | 1.55 | 1.80 | 3.09 | 3.20 | 4.39 | 11.74 |
| 1 | 2.36 | 3.04 | 6.83 | 7.75 | 11.61 | 37.55 |
The presented effect sizes are detectable relative risks with a type I error of 5% and a type II error of 20% (power 80%)
From 2016 onwards, data collected during the measurements at the research center are entered directly into an electronic database. Data collected by questionnaires are scanned and manually entered into an electronic database by a commercial company. Random samples of all questionnaires are double checked by study staff members to monitor the quality of this manual data entry process. The percentage of mistakes does not exceed 3% per questionnaire. Open text fields are entered into the electronic database exactly as they are filled in on the questionnaires. In a secondary stage, these open text fields are cleaned and coded by a specialist in the relevant field.
All measurements are centrally checked by examination of the data including their ranges, distributions, means, standard deviations, outliers and logical errors. Data outliers and missing values are checked with the original forms. The data of one specific measurement are only distributed for analyses after data collection and preparation is completed for that measurement for the whole cohort.
Datasets needed for answering specific research questions are centrally constructed from different databases. All information in these datasets that enables identification of a particular participant, including names and dates of birth, is excluded before distribution to the researchers. The datasets for researchers include unique identification numbers for each subject that enable feedback about individuals to the datamanager but do not enable identification of that particular subject. Currently, we are exploring possibilities for a remote access environment, in which researchers can access centrally stored research data from their own computer without storing such data locally.
Collaboration
The Generation R Study is conducted by several research groups from the Erasmus MC in close collaboration with the Erasmus University Rotterdam and the Municipal Health Service Rotterdam area. Since the data collection is still ongoing and growing, the number of collaborating research groups in and outside the Netherlands is expected to increase. Various research projects are performed as part of ongoing European or worldwide collaboration projects. The study has an open policy with regard to collaboration with other research groups. Request for collaboration can be sent to Vincent Jaddoe (v.jaddoe@erasmusmc.nl). These requests will be discussed in the Generation R Study Management Team regarding their study aims, overlap with ongoing studies, logistic consequences and related finances. After approval of a project by the Generation R Study Management Team and the Medical Ethical Committee of Erasmus MC, the collaborative research project is embedded in one of the research areas supervised by the corresponding principal investigator.
Acknowledgements
We thank our previous Principal Investigators Professor Hans A. Büller, Professor Albert J. van der Heijden, Professor Albert Hofman, Professor Jan Lindemans, Dr. Rosaline F.M. Snijders, Dr. Hajo Wildschut and Professor Jacqueline C.M. Witteman for their important contribution to the Generation R Study. The Generation R Study is conducted by the Erasmus Medical Center in close collaboration with the School of Law and Faculty of Social Sciences of the Erasmus University Rotterdam, the Municipal Health Service Rotterdam area, Rotterdam, the Rotterdam Homecare Foundation, Rotterdam and the Stichting Trombosedienst & Artsenlaboratorium Rijnmond (STAR-MDC), Rotterdam. We gratefully acknowledge the contribution of children and parents, general practitioners, hospitals, midwives and pharmacies in Rotterdam. We thank Sylvie van den Assum, Ronald van den Nieuwenhof and Patricia van Sichem-Maeijer for their study coordination. The general design of Generation R Study is made possible by financial support from the Erasmus MC, University Medical Center, Rotterdam, the Netherlands Organization for Health Research and Development (ZonMw) and the Ministry of Health, Welfare and Sport. Liesbeth Duijts received additional funding from the Lung Foundation Netherlands (no 3.2.12.089; 2012). Liesbeth Duijts, Janine Felix and Vincent Jaddoe received additional funding from the European Union’s Horizon 2020 research and innovation programme (733206, LIFECYCLE). Marinus van Ijzendoorn, Henning Tiemeier and Frank Verhulst received additional funding from the Gravitation program of the Dutch Ministry of Education, Culture, and Science and the Netherlands Organization for Scientific Research (NWO grant number 024.001.003). Robin P. Peeters recieved funding from a clinical fellowship from ZonMw, project number 90700412. Fernando Rivadeneira received additional funding from the Netherlands Organization for Health Research and Development (VIDI 016. 136. 367). Janine Felix and Vincent Jaddoe received additional funding from the European Union’s Horizon 2020 research and innovation programme under grant agreement No 633595 (DynaHEALTH). Vincent Jaddoe received additional funding from the Netherlands Organization for Health Research and Development (VIDI 016. 136. 361), European Research Council (ERC Consolidator Grant, ERC-2014-CoG-648916) and European Union’s FP-7 programme (Early Nutrition).
References
- 1.Hofman A, Jaddoe VW, Mackenbach JP, Moll HA, Snijders RF, Steegers EA, et al. Growth, development and health from early fetal life until young adulthood: the Generation R Study. Paediatr Perinat Epidemiol. 2004;18(1):61–72. doi: 10.1111/j.1365-3016.2003.00521.x. [DOI] [PubMed] [Google Scholar]
- 2.Jaddoe VW, van Duijn CM, van der Heijden AJ, Mackenbach JP, Moll HA, Steegers EA, et al. The Generation R Study: design and cohort update until the age of 4 years. Eur J Epidemiol. 2008;23(12):801–811. doi: 10.1007/s10654-008-9309-4. [DOI] [PubMed] [Google Scholar]
- 3.Jaddoe VW, van Duijn CM, van der Heijden AJ, Mackenbach JP, Moll HA, Steegers EA, et al. The Generation R Study: design and cohort update 2010. Eur J Epidemiol. 2010;25(11):823–841. doi: 10.1007/s10654-010-9516-7. [DOI] [PMC free article] [PubMed] [Google Scholar]
- 4.Jaddoe VW, van Duijn CM, Franco OH, van der Heijden AJ, van IJzendoorn MH, de Jongste JC, et al. The Generation R Study: design and cohort update 2012. Eur J Epidemiol. 2012;27(9):739–756. doi: 10.1007/s10654-012-9735-1. [DOI] [PubMed] [Google Scholar]
- 5.Jaddoe VW, Bakker R, van Duijn CM, van der Heijden AJ, Lindemans J, Mackenbach JP, et al. The Generation R Study biobank: a resource for epidemiological studies in children and their parents. Eur J Epidemiol. 2007;22(12):917–923. doi: 10.1007/s10654-007-9209-z. [DOI] [PMC free article] [PubMed] [Google Scholar]
- 6.White T, el Marroun H, Nijs I, Schmidt M, van der Lugt A, Wielopolki PA, et al. Pediatric population-based neuroimaging and the Generation R Study: the intersection of developmental neuroscience and epidemiology. Eur J Epidemiol. 2013;28(1):99–111. doi: 10.1007/s10654-013-9768-0. [DOI] [PubMed] [Google Scholar]
- 7.Kruithof CJ, Kooijman MN, van Duijn CM, Franco OH, de Jongste JC, Klaver CC, et al. The Generation R Study: biobank update 2015. Eur J Epidemiol. 2014;29(12):911–927. doi: 10.1007/s10654-014-9980-6. [DOI] [PubMed] [Google Scholar]
- 8.Duijts L, Reiss IK, Brusselle G, de Jongste JC. Early origins of chronic obstructive lung diseases across the life course. Eur J Epidemiol. 2014;29(12):871–885. doi: 10.1007/s10654-014-9981-5. [DOI] [PubMed] [Google Scholar]
- 9.Eveborn GW, Schirmer H, Lunde P, Heggelund G, Hansen JB, Rasmussen K. Assessment of risk factors for developing incident aortic stenosis: the Tromso Study. Eur J Epidemiol. 2014;29(8):567–575. doi: 10.1007/s10654-014-9936-x. [DOI] [PubMed] [Google Scholar]
- 10.Gaillard R. Maternal obesity during pregnancy and cardiovascular development and disease in the offspring. Eur J Epidemiol. 2015;30(11):1141–1152. doi: 10.1007/s10654-015-0085-7. [DOI] [PMC free article] [PubMed] [Google Scholar]
- 11.Gunnell AS, Knuiman MW, Divitini ML, Cormie P. Leisure time physical activity and long-term cardiovascular and cancer outcomes: the Busselton Health Study. Eur J Epidemiol. 2014;29(11):851–857. doi: 10.1007/s10654-014-9963-7. [DOI] [PubMed] [Google Scholar]
- 12.Horvei LD, Braekkan SK, Mathiesen EB, Njolstad I, Wilsgaard T, Hansen JB. Obesity measures and risk of venous thromboembolism and myocardial infarction. Eur J Epidemiol. 2014;29(11):821–830. doi: 10.1007/s10654-014-9950-z. [DOI] [PubMed] [Google Scholar]
- 13.Jiang W, Ju C, Jiang H, Zhang D. Dairy foods intake and risk of Parkinson’s disease: a dose-response meta-analysis of prospective cohort studies. Eur J Epidemiol. 2014;29(9):613–619. doi: 10.1007/s10654-014-9921-4. [DOI] [PubMed] [Google Scholar]
- 14.Kunutsor SK, Burgess S, Munroe PB, Khan H. Vitamin D and high blood pressure: causal association or epiphenomenon? Eur J Epidemiol. 2014;29(1):1–14. doi: 10.1007/s10654-013-9874-z. [DOI] [PubMed] [Google Scholar]
- 15.Liu XM, Liu YJ, Zhan J, He QQ. Overweight, obesity and risk of all-cause and cardiovascular mortality in patients with type 2 diabetes mellitus: a dose-response meta-analysis of prospective cohort studies. Eur J Epidemiol. 2015;30(1):35–45. doi: 10.1007/s10654-014-9973-5. [DOI] [PubMed] [Google Scholar]
- 16.Luczynska A, Logan C, Nieters A, Elgizouli M, Schottker B, Brenner H, et al. Cord blood 25(OH)D levels and the subsequent risk of lower respiratory tract infections in early childhood: the Ulm birth cohort. Eur J Epidemiol. 2014;29(8):585–594. doi: 10.1007/s10654-014-9918-z. [DOI] [PubMed] [Google Scholar]
- 17.Schmidt M, Botker HE, Pedersen L, Sorensen HT. Adult height and risk of ischemic heart disease, atrial fibrillation, stroke, venous thromboembolism, and premature death: a population based 36-year follow-up study. Eur J Epidemiol. 2014;29(2):111–118. doi: 10.1007/s10654-013-9867-y. [DOI] [PubMed] [Google Scholar]
- 18.Sandvei MS, Lagiou P, Romundstad PR, Trichopoulos D, Vatten LJ. Size at birth and risk of breast cancer: update from a prospective population-based study. Eur J Epidemiol. 2015;30(6):485–492. doi: 10.1007/s10654-015-0045-2. [DOI] [PubMed] [Google Scholar]
- 19.Aune D, Norat T, Leitzmann M, Tonstad S, Vatten LJ. Physical activity and the risk of type 2 diabetes: a systematic review and dose-response meta-analysis. Eur J Epidemiol. 2015;30(7):529–542. doi: 10.1007/s10654-015-0056-z. [DOI] [PubMed] [Google Scholar]
- 20.Etemadi A, Abnet CC, Kamangar F, Islami F, Khademi H, Pourshams A, et al. Impact of body size and physical activity during adolescence and adult life on overall and cause-specific mortality in a large cohort study from Iran. Eur J Epidemiol. 2014;29(2):95–109. doi: 10.1007/s10654-014-9883-6. [DOI] [PMC free article] [PubMed] [Google Scholar]
- 21.Ueda P, Cnattingius S, Stephansson O, Ingelsson E, Ludvigsson JF, Bonamy AK. Cerebrovascular and ischemic heart disease in young adults born preterm: a population-based Swedish cohort study. Eur J Epidemiol. 2014;29(4):253–260. doi: 10.1007/s10654-014-9892-5. [DOI] [PubMed] [Google Scholar]
- 22.Engeland A, Bjorge T, Klungsoyr K, Skjaerven R, Skurtveit S, Furu K. Preeclampsia in pregnancy and later use of antihypertensive drugs. Eur J Epidemiol. 2015;30(6):501–508. doi: 10.1007/s10654-015-0018-5. [DOI] [PMC free article] [PubMed] [Google Scholar]
- 23.Vatten LJ. Dimitrios Trichopoulos and the early life origins of breast cancer. Eur J Epidemiol. 2015;30(6):463–464. doi: 10.1007/s10654-015-0055-0. [DOI] [PubMed] [Google Scholar]
- 24.Lagiou P, Samoli E, Hsieh CC, Lagiou A, Xu B, Yu GP, et al. Maternal and cord blood hormones in relation to birth size. Eur J Epidemiol. 2014;29(5):343–351. doi: 10.1007/s10654-014-9914-3. [DOI] [PubMed] [Google Scholar]
- 25.Rydell M, Granath F, Cnattingius S, Magnusson C, Galanti MR. In-utero exposure to maternal smoking is not linked to tobacco use in adulthood after controlling for genetic and family influences: a Swedish sibling study. Eur J Epidemiol. 2014;29(7):499–506. doi: 10.1007/s10654-014-9912-5. [DOI] [PubMed] [Google Scholar]
- 26.Greenwood DC, Thatcher NJ, Ye J, Garrard L, Keogh G, King LG, et al. Caffeine intake during pregnancy and adverse birth outcomes: a systematic review and dose-response meta-analysis. Eur J Epidemiol. 2014;29(10):725–734. doi: 10.1007/s10654-014-9944-x. [DOI] [PubMed] [Google Scholar]
- 27.Statistics Netherlands, Allochtonen in Nederland: Statistics Netherlands, Den Haag/Heerlen; [Available from: http://statline.cbs.nl/statweb/].
- 28.Troe EJ, Raat H, Jaddoe VW, Hofman A, Looman CW, Moll HA, et al. Explaining differences in birthweight between ethnic populations. The Generation R Study. BJOG. 2007;114(12):1557–1565. doi: 10.1111/j.1471-0528.2007.01508.x. [DOI] [PubMed] [Google Scholar]
- 29.Silva LM, Jansen PW, Steegers EA, Jaddoe VW, Arends LR, Tiemeier H, et al. Mother’s educational level and fetal growth: the genesis of health inequalities. Int J Epidemiol. 2010;39(5):1250–1261. doi: 10.1093/ije/dyq069. [DOI] [PubMed] [Google Scholar]
- 30.Raat H, Wijtzes A, Jaddoe VW, Moll HA, Hofman A, Mackenbach JP. The health impact of social disadvantage in early childhood; the Generation R study. Early Hum Dev. 2011;87(11):729–733. doi: 10.1016/j.earlhumdev.2011.08.022. [DOI] [PubMed] [Google Scholar]
- 31.Nationaal Kompas: Volksgezondheid en zorg Nederland; [Available from: http://www.nationaalkompas.nl/bevolking/etniciteit/wat-is-etniciteit/].
- 32.Standaard onderwijsindeling Nederland: Statistics Netherlands, Den Haag/Heerlen; [Available from: https://www.cbs.nl/nl-nl/onze-diensten/methoden/classificaties/onderwijs%20en%20beroepen/standaard-onderwijsindeling–soi–].
- 33.Troe EJ, Raat H, Jaddoe VW, Hofman A, Steegers EA, Verhulst FC, et al. Smoking during pregnancy in ethnic populations: the Generation R study. Nicotine Tob Res. 2008;10(8):1373–1384. doi: 10.1080/14622200802238944. [DOI] [PubMed] [Google Scholar]
- 34.Wijtzes AI, Jansen W, Jaddoe VW, Moll HA, Tiemeier H, Verhulst FC, et al. Ethnic background and television viewing time among 4-year-old preschool children: the generation R study. J Dev Behav Pediatr. 2013;34(2):63–71. doi: 10.1097/DBP.0b013e31827b163a. [DOI] [PubMed] [Google Scholar]
- 35.Gaillard R, Jaddoe VW. Assessment of fetal growth by customized growth charts. Ann Nutr Metab. 2014;65(2–3):149–155. doi: 10.1159/000361055. [DOI] [PubMed] [Google Scholar]
- 36.Jaddoe VW, de Jonge LL, Hofman A, Franco OH, Steegers EA, Gaillard R. First trimester fetal growth restriction and cardiovascular risk factors in school age children: population based cohort study. BMJ. 2014;348:g14. doi: 10.1136/bmj.g14. [DOI] [PMC free article] [PubMed] [Google Scholar]
- 37.Gaillard R, de Ridder MA, Verburg BO, Witteman JC, Mackenbach JP, Moll HA, et al. Individually customised fetal weight charts derived from ultrasound measurements: the Generation R Study. Eur J Epidemiol. 2011;26(12):919–926. doi: 10.1007/s10654-011-9629-7. [DOI] [PMC free article] [PubMed] [Google Scholar]
- 38.Verburg BO, Steegers EA, de Ridder M, Snijders RJ, Smith E, Hofman A, et al. New charts for ultrasound dating of pregnancy and assessment of fetal growth: longitudinal data from a population-based cohort study. Ultrasound Obstet Gynecol. 2008;31(4):388–396. doi: 10.1002/uog.5225. [DOI] [PubMed] [Google Scholar]
- 39.Verburg BO, Mulder PG, Hofman A, Jaddoe VW, Witteman JC, Steegers EA. Intra- and interobserver reproducibility study of early fetal growth parameters. Prenat Diagn. 2008;28(4):323–331. doi: 10.1002/pd.1972. [DOI] [PubMed] [Google Scholar]
- 40.Kooijman MN, Gaillard R, Reiss I, Hofman A, Steegers EA, Jaddoe VW. Influence of fetal blood flow redistribution on fetal and childhood growth and fat distribution: the Generation R Study. BJOG. 2016;123(13):2104–2112. doi: 10.1111/1471-0528.13933. [DOI] [PMC free article] [PubMed] [Google Scholar]
- 41.Gaillard R, Arends LR, Steegers EA, Hofman A, Jaddoe VW. Second- and third-trimester placental hemodynamics and the risks of pregnancy complications: the Generation R Study. Am J Epidemiol. 2013;177(8):743–754. doi: 10.1093/aje/kws296. [DOI] [PubMed] [Google Scholar]
- 42.Rurangirwa AA, Gaillard R, Steegers EA, Hofman A, Jaddoe VW. Hemodynamic adaptations in different trimesters among nulliparous and multiparous pregnant women; the Generation R study. Am J Hypertens. 2012;25(8):892–899. doi: 10.1038/ajh.2012.57. [DOI] [PubMed] [Google Scholar]
- 43.Geelhoed JJ, Steegers EA, van Osch-Gevers L, Verburg BO, Hofman A, Witteman JC, et al. Cardiac structures track during the first 2 years of life and are associated with fetal growth and hemodynamics: the Generation R Study. Am Heart J. 2009;158(1):71–77. doi: 10.1016/j.ahj.2009.04.018. [DOI] [PubMed] [Google Scholar]
- 44.Geelhoed JJ, Verburg BO, Nauta J, Lequin M, Hofman A, Moll HA, et al. Tracking and determinants of kidney size from fetal life until the age of 2 years: the Generation R Study. Am J Kidney Dis. 2009;53(2):248–258. doi: 10.1053/j.ajkd.2008.07.030. [DOI] [PubMed] [Google Scholar]
- 45.Roza SJ, Steegers EA, Verburg BO, Jaddoe VW, Moll HA, Hofman A, et al. What is spared by fetal brain-sparing? Fetal circulatory redistribution and behavioral problems in the general population. Am J Epidemiol. 2008;168(10):1145–1152. doi: 10.1093/aje/kwn233. [DOI] [PubMed] [Google Scholar]
- 46.Verburg BO, Jaddoe VW, Wladimiroff JW, Hofman A, Witteman JC, Steegers EA. Fetal hemodynamic adaptive changes related to intrauterine growth: the Generation R Study. Circulation. 2008;117(5):649–659. doi: 10.1161/CIRCULATIONAHA.107.709717. [DOI] [PubMed] [Google Scholar]
- 47.Roza SJ, Verburg BO, Jaddoe VW, Hofman A, Mackenbach JP, Steegers EA, et al. Effects of maternal smoking in pregnancy on prenatal brain development. The Generation R Study. Eur J Neurosci. 2007;25(3):611–617. doi: 10.1111/j.1460-9568.2007.05393.x. [DOI] [PubMed] [Google Scholar]
- 48.Kooijman MN, Bakker H, van der Heijden AJ, Hofman A, Franco OH, Steegers EA, et al. Childhood kidney outcomes in relation to fetal blood flow and kidney size. J Am Soc Nephrol. 2014;25(11):2616–2624. doi: 10.1681/ASN.2013070746. [DOI] [PMC free article] [PubMed] [Google Scholar]
- 49.Coolman M, de Groot CJ, Jaddoe VW, Hofman A, Raat H, Steegers EA. Medical record validation of maternally reported history of preeclampsia. J Clin Epidemiol. 2010;63(8):932–937. doi: 10.1016/j.jclinepi.2009.10.010. [DOI] [PubMed] [Google Scholar]
- 50.van Batenburg-Eddes T, de Groot L, Arends L, de Vries A, Moll HA, Steegers EA, et al. Does gestational duration within the normal range predict infant neuromotor development? Early Hum Dev. 2008;84(10):659–665. doi: 10.1016/j.earlhumdev.2008.04.007. [DOI] [PubMed] [Google Scholar]
- 51.Rijlaarsdam J, Stevens GW, van der Ende J, Arends LR, Hofman A, Jaddoe VW, et al. A brief observational instrument for the assessment of infant home environment: development and psychometric testing. Int J Methods Psychiatr Res. 2012;21(3):195–204. doi: 10.1002/mpr.1361. [DOI] [PMC free article] [PubMed] [Google Scholar]
- 52.van Batenburg-Eddes T, Henrichs J, Schenk JJ, Sincer I, de Groot L, Hofman A, et al. Early infant neuromotor assessment is associated with language and nonverbal cognitive function in toddlers: the Generation R Study. J Dev Behav Pediatr. 2013;34(5):326–334. doi: 10.1097/DBP.0b013e3182961e80. [DOI] [PubMed] [Google Scholar]
- 53.Rijlaarsdam J, Tiemeier H, Hofman A, Jaddoe VW, Mackenbach JP, Verhulst FC, et al. Home environments of infants: relations with child development through age 3. J Epidemiol Community Health. 2013;67(1):14–20. doi: 10.1136/jech-2012-200987. [DOI] [PubMed] [Google Scholar]
- 54.Burgmeijer RJ, Merkx JA. Pakket… en hoe pakt het uit? Ouder- en Kindzorg tussen wetenschap en praktijk. Assen, the Netherlands: van Gorcum. 1999.
- 55.Ay L, Hokken-Koelega AC, Mook-Kanamori DO, Hofman A, Moll HA, Mackenbach JP, et al. Tracking and determinants of subcutaneous fat mass in early childhood: the Generation R Study. Int J Obes (Lond) 2008;32(7):1050–1059. doi: 10.1038/ijo.2008.76. [DOI] [PubMed] [Google Scholar]
- 56.Durmus B, Mook-Kanamori DO, Holzhauer S, Hofman A, van der Beek EM, Boehm G, et al. Growth in foetal life and infancy is associated with abdominal adiposity at the age of 2 years: the generation R study. Clin Endocrinol (Oxf) 2010;72(5):633–640. doi: 10.1111/j.1365-2265.2009.03708.x. [DOI] [PubMed] [Google Scholar]
- 57.Roza SJ, Govaert PP, Vrooman HA, Lequin MH, Hofman A, Steegers EA, et al. Foetal growth determines cerebral ventricular volume in infants The Generation R Study. Neuroimage. 2008;39(4):1491–1498. doi: 10.1016/j.neuroimage.2007.11.004. [DOI] [PubMed] [Google Scholar]
- 58.de Jonge LL, van Osch-Gevers L, Willemsen SP, Steegers EA, Hofman A, Helbing WA, et al. Growth, obesity, and cardiac structures in early childhood: the Generation R Study. Hypertension. 2011;57(5):934–940. doi: 10.1161/HYPERTENSIONAHA.110.163303. [DOI] [PubMed] [Google Scholar]
- 59.Kok R, van IJzendoorn MH, Linting M, Bakermans-Kranenburg MJ, Tharner A, Luijk MP, et al. Attachment insecurity predicts child active resistance to parental requests in a compliance task. Child Care Health Dev. 2013;39(2):277–287. doi: 10.1111/j.1365-2214.2012.01374.x. [DOI] [PubMed] [Google Scholar]
- 60.Ay L, van Houten VA, Steegers EA, Hofman A, Witteman JC, Jaddoe VW, et al. Fetal and postnatal growth and body composition at 6 months of age. J Clin Endocrinol Metab. 2009;94(6):2023–2030. doi: 10.1210/jc.2008-2045. [DOI] [PubMed] [Google Scholar]
- 61.Gabriele C, Asgarali R, Jaddoe VW, Hofman A, Moll HA, de Jongste JC. Smoke exposure, airway symptoms and exhaled nitric oxide in infants: the Generation R study. Eur Respir J. 2008;32(2):307–313. doi: 10.1183/09031936.00132607. [DOI] [PubMed] [Google Scholar]
- 62.van Houten VA, Steegers EA, Witteman JC, Moll HA, Hofman A, Jaddoe VW. Fetal and postnatal growth and blood pressure at the age of 2 years. The Generation R Study. J Hypertens. 2009;27(6):1152–1157. doi: 10.1097/HJH.0b013e3283299973. [DOI] [PubMed] [Google Scholar]
- 63.van Houten VA, Mook-Kanamori DO, van Osch-Gevers L, Steegers EA, Hofman A, Moll HA, et al. A variant of the IGF-I gene is associated with blood pressure but not with left heart dimensions at the age of 2 years: the Generation R Study. Eur J Endocrinol. 2008;159(3):209–216. doi: 10.1530/EJE-07-0907. [DOI] [PubMed] [Google Scholar]
- 64.Dierckx B, Kok R, Tulen JH, Jaddoe VW, Hofman A, Verhulst FC, et al. A prospective study of heart rate and externalising behaviours in young children. J Child Psychol Psychiatry. 2014;55(4):402–410. doi: 10.1111/jcpp.12175. [DOI] [PubMed] [Google Scholar]
- 65.Ghassabian A, Szekely E, Herba CM, Jaddoe VW, Hofman A, Oldehinkel AJ, et al. From positive emotionality to internalizing problems: the role of executive functioning in preschoolers. Eur Child Adolesc Psychiatry. 2014;23(9):729–741. doi: 10.1007/s00787-014-0542-y. [DOI] [PubMed] [Google Scholar]
- 66.Szekely E, Tiemeier H, Jansen PW, Jaddoe VW, Hofman A, Verhulst FC, et al. Maternal depressive symptoms are associated with low fearfulness in preschoolers. J Clin Child Adolesc Psychol. 2014;43(5):791–798. doi: 10.1080/15374416.2013.862800. [DOI] [PubMed] [Google Scholar]
- 67.Szekely E, Lucassen N, Tiemeier H, Bakermans-Kranenburg MJ, van Van IJzendoorn MH, Kok R, et al. Maternal depressive symptoms and sensitivity are related to young children’s facial expression recognition: the Generation R Study. Dev Psychopathol. 2014;26(2):333–345. doi: 10.1017/S0954579413001028. [DOI] [PubMed] [Google Scholar]
- 68.Mileva-Seitz VR, Ghassabian A, Bakermans-Kranenburg MJ, van den Brink JD, Linting M, Jaddoe VW, et al. Are boys more sensitive to sensitivity? Parenting and executive function in preschoolers. J Exp Child Psychol. 2015;130:193–208. doi: 10.1016/j.jecp.2014.08.008. [DOI] [PubMed] [Google Scholar]
- 69.Labout JA, Duijts L, Arends LR, Jaddoe VW, Hofman A, de Groot R, et al. Factors associated with pneumococcal carriage in healthy Dutch infants: the generation R study. J Pediatr. 2008;153(6):771–776. doi: 10.1016/j.jpeds.2008.05.061. [DOI] [PubMed] [Google Scholar]
- 70.Labout JA, Duijts L, Lebon A, de Groot R, Hofman A, Jaddoe VV, et al. Risk factors for otitis media in children with special emphasis on the role of colonization with bacterial airway pathogens: the Generation R study. Eur J Epidemiol. 2011;26(1):61–66. doi: 10.1007/s10654-010-9500-2. [DOI] [PMC free article] [PubMed] [Google Scholar]
- 71.Luijk MP, Saridjan N, Tharner A, van IJzendoor MH, Bakermans-Kranenburg MJ, Jaddoe VW, et al. Attachment, depression, and cortisol: deviant patterns in insecure-resistant and disorganized infants. Dev Psychobiol. 2010;52(5):441–452. doi: 10.1002/dev.20446. [DOI] [PubMed] [Google Scholar]
- 72.Toemen L, Gishti O, van Osch-Gevers L, Steegers EA, Helbing WA, Felix JF, et al. Maternal obesity, gestational weight gain and childhood cardiac outcomes: role of childhood body mass index. Int J Obes (Lond) 2016;40(7):1070–1078. doi: 10.1038/ijo.2016.86. [DOI] [PubMed] [Google Scholar]
- 73.van der Tas JT, Kragt L, Veerkamp JJ, Jaddoe VW, Moll HA, Ongkosuwito EM, et al. Ethnic disparities in dental caries among six-year-old children in the Netherlands. Caries Res. 2016;50(5):489–497. doi: 10.1159/000448663. [DOI] [PubMed] [Google Scholar]
- 74.Ringoot AP, Tiemeier H, Jaddoe VW, So P, Hofman A, Verhulst FC, et al. Parental depression and child well-being: young children’s self-reports helped addressing biases in parent reports. J Clin Epidemiol. 2015;68(8):928–938. doi: 10.1016/j.jclinepi.2015.03.009. [DOI] [PubMed] [Google Scholar]
- 75.Miliku K, Bergen NE, Bakker H, Hofman A, Steegers EA, Gaillard R, et al. Associations of maternal and paternal blood pressure patterns and hypertensive disorders during pregnancy with childhood blood pressure. J Am Heart Assoc. 2016;5(10):e003884. doi: 10.1161/JAHA.116.003884. [DOI] [PMC free article] [PubMed] [Google Scholar]
- 76.Mackenbach JD, Ringoot AP, van der Ende J, Verhulst FC, Jaddoe VW, Hofman A, et al. Exploring the relation of harsh parental discipline with child emotional and behavioral problems by using multiple informants. The generation R study. PLoS ONE. 2014;9(8):e104793. doi: 10.1371/journal.pone.0104793. [DOI] [PMC free article] [PubMed] [Google Scholar]
- 77.Heppe DH, Medina-Gomez C, de Jongste JC, Raat H, Steegers EA, Hofman A, et al. Fetal and childhood growth patterns associated with bone mass in school-age children: the Generation R Study. J Bone Miner Res. 2014;29(12):2584–2593. doi: 10.1002/jbmr.2299. [DOI] [PubMed] [Google Scholar]
- 78.Gishti O, Jaddoe VW, Felix JF, Klaver CC, Hofman A, Wong TY, et al. Retinal microvasculature and cardiovascular health in childhood. Pediatrics. 2015;135(4):678–685. doi: 10.1542/peds.2014-3341. [DOI] [PubMed] [Google Scholar]
- 79.den Dekker HT, Sonnenschein-van der Voort AM, Jaddoe VW, Reiss IK, de Jongste JC, Duijts L. Breastfeeding and asthma outcomes at the age of 6 years: the Generation R Study. Pediatr Allergy Immunol. 2016;27(5):486–492. doi: 10.1111/pai.12576. [DOI] [PubMed] [Google Scholar]
- 80.Ars CL, Nijs IM, El Marroun H, Muetzel R, Schmidt M, Steenweg-de Graaff J, et al. Prenatal folate, homocysteine and vitamin B12 levels and child brain volumes, cognitive development and psychological functioning: the Generation R Study. Br J Nutr. 2016. doi:10.1017/S0007114515002081. [DOI] [PubMed]
- 81.Muetzel RL, Blanken LM, Thijssen S, van der Lugt A, Jaddoe VW, Verhulst FC, et al. Resting-state networks in 6-to-10 year old children. Hum Brain Mapp. 2016;37(12):4286–4300. doi: 10.1002/hbm.23309. [DOI] [PMC free article] [PubMed] [Google Scholar]
- 82.Thijssen S, Ringoot AP, Wildeboer A, Bakermans-Kranenburg MJ, el Marroun H, Hofman A, et al. Brain morphology of childhood aggressive behavior: a multi-informant study in school-age children. Cogn Affect Behav Neurosci. 2015;15(3):564–577. doi: 10.3758/s13415-015-0344-9. [DOI] [PMC free article] [PubMed] [Google Scholar]
- 83.White T, Muetzel RL, Schmidt M, Langeslag SJ, Jaddoe VW, Hofman A, et al. Time of acquisition and network stability in pediatric resting-state functional magnetic resonance imaging. Brain Connect. 2014;4(6):417–427. doi: 10.1089/brain.2013.0195. [DOI] [PMC free article] [PubMed] [Google Scholar]
- 84.Medina-Gomez C, Felix JF, Estrada K, Peters MJ, Herrera L, Kruithof CJ, et al. Challenges in conducting genome-wide association studies in highly admixed multi-ethnic populations: the Generation R Study. Eur J Epidemiol. 2015;30(4):317–330. doi: 10.1007/s10654-015-9998-4. [DOI] [PMC free article] [PubMed] [Google Scholar]
- 85.Taal HR, St Pourcain B, Thiering E, Das S, Mook-Kanamori DO, Warrington NM, et al. Common variants at 12q15 and 12q24 are associated with infant head circumference. Nat Genet. 2012;44(5):532–538. doi: 10.1038/ng.2238. [DOI] [PMC free article] [PubMed] [Google Scholar]
- 86.Bradfield JP, Taal HR, Timpson NJ, Scherag A, Lecoeur C, Warrington NM, et al. A genome-wide association meta-analysis identifies new childhood obesity loci. Nat Genet. 2012;44(5):526–531. doi: 10.1038/ng.2247. [DOI] [PMC free article] [PubMed] [Google Scholar]
- 87.Horikoshi M, Beaumont RN, Day FR, Warrington NM, Kooijman MN, Fernandez-Tajes J, et al. Genome-wide associations for birth weight and correlations with adult disease. Nature. 2016;538(7624):248–252. doi: 10.1038/nature19806. [DOI] [PMC free article] [PubMed] [Google Scholar]
- 88.Freathy RM, Mook-Kanamori DO, Sovio U, Prokopenko I, Timpson NJ, Berry DJ, et al. Variants in ADCY5 and near CCNL1 are associated with fetal growth and birth weight. Nat Genet. 2010;42(5):430–435. doi: 10.1038/ng.567. [DOI] [PMC free article] [PubMed] [Google Scholar]
- 89.Parmar PG, Taal HR, Timpson NJ, Thiering E, Lehtimaki T, Marinelli M, et al. International genome-wide Association Study consortium identifies novel loci associated with blood pressure in children and adolescents. Circ Cardiovasc Genet. 2016;9(3):266–278. doi: 10.1161/CIRCGENETICS.115.001190. [DOI] [PMC free article] [PubMed] [Google Scholar]
- 90.Felix JF, Bradfield JP, Monnereau C, van der Valk RJ, Stergiakouli E, Chesi A, et al. Genome-wide association analysis identifies three new susceptibility loci for childhood body mass index. Hum Mol Genet. 2016;25(2):389–403. doi: 10.1093/hmg/ddv472. [DOI] [PMC free article] [PubMed] [Google Scholar]
- 91.Medina-Gomez C, Kemp JP, Estrada K, Eriksson J, Liu J, Reppe S, et al. Meta-analysis of genome-wide scans for total body BMD in children and adults reveals allelic heterogeneity and age-specific effects at the WNT16 locus. PLoS Genet. 2012;8(7):e1002718. doi: 10.1371/journal.pgen.1002718. [DOI] [PMC free article] [PubMed] [Google Scholar]
- 92.Joubert BR, den Dekker HT, Felix JF, Bohlin J, Ligthart S, Beckett E, et al. Maternal plasma folate impacts differential DNA methylation in an epigenome-wide meta-analysis of newborns. Nat Commun. 2016;7:10577. doi: 10.1038/ncomms10577. [DOI] [PMC free article] [PubMed] [Google Scholar]
- 93.Rijlaarsdam J, Pappa I, Walton E, Bakermans-Kranenburg MJ, Mileva-Seitz VR, Rippe RC, et al. An epigenome-wide association meta-analysis of prenatal maternal stress in neonates: a model approach for replication. Epigenetics. 2016;11(2):140–149. doi: 10.1080/15592294.2016.1145329. [DOI] [PMC free article] [PubMed] [Google Scholar]
- 94.Joubert BR, Felix JF, Yousefi P, Bakulski KM, Just AC, Breton C, et al. DNA Methylation in newborns and maternal smoking in pregnancy: genome-wide consortium meta-analysis. Am J Hum Genet. 2016;98(4):680–696. doi: 10.1016/j.ajhg.2016.02.019. [DOI] [PMC free article] [PubMed] [Google Scholar]
- 95.Gruzieva O, Xu CJ, Breton CV, Annesi-Maesano I, Anto JM, Auffray C, et al. Epigenome-wide meta-analysis of methylation in children related to prenatal NO2 air pollution exposure. Environ Health Perspect. 2016. doi:10.1289/EHP36. [DOI] [PMC free article] [PubMed]
- 96.Caporaso JG, Kuczynski J, Stombaugh J, Bittinger K, Bushman FD, Costello EK, et al. QIIME allows analysis of high-throughput community sequencing data. Nat Methods. 2010;7(5):335–336. doi: 10.1038/nmeth.f.303. [DOI] [PMC free article] [PubMed] [Google Scholar]
- 97.Edgar RC. UPARSE: highly accurate OTU sequences from microbial amplicon reads. Nat Methods. 2013;10(10):996–998. doi: 10.1038/nmeth.2604. [DOI] [PubMed] [Google Scholar]
- 98.Raoult D, Henrissat B. Are stool samples suitable for studying the link between gut microbiota and obesity? Eur J Epidemiol. 2014;29(5):307–309. doi: 10.1007/s10654-014-9905-4. [DOI] [PubMed] [Google Scholar]
- 99.Aguirre M, Venema K. The use of fecal samples for studying human obesity. Eur J Epidemiol. 2015;30(9):1067–1069. doi: 10.1007/s10654-015-0048-z. [DOI] [PubMed] [Google Scholar]
- 100.Raoult D. Obesity and stools, the “emperor’s new clothing” paradigm. Eur J Epidemiol. 2015;30(9):1071. doi: 10.1007/s10654-015-0079-5. [DOI] [PubMed] [Google Scholar]
- 101.Ware JE, Sherbourne CD. The MOS 36-item short-form health survey (SF-36). I. Conceptual framework and item selection. Med Care. 1992;30(6):473–483. doi: 10.1097/00005650-199206000-00002. [DOI] [PubMed] [Google Scholar]
- 102.Lloyd-Jones DM, Hong Y, Labarthe D, Mozaffarian D, Appel LJ, Van Horn L, et al. Defining and setting national goals for cardiovascular health promotion and disease reduction: the American Heart Association’s strategic Impact Goal through 2020 and beyond. Circulation. 2010;121(4):586–613. doi: 10.1161/CIRCULATIONAHA.109.192703. [DOI] [PubMed] [Google Scholar]
- 103.Henry BW, Smith TJ, Ahmad S. Psychometric assessment of the Behavior and Attitudes Questionnaire for Healthy Habits: measuring parents’ views on food and physical activity. Public Health Nutr. 2014;17(5):1004–1012. doi: 10.1017/S136898001200554X. [DOI] [PMC free article] [PubMed] [Google Scholar]
- 104.van Strien T, Frijters JE, Bergers GP, Defares PB. The Dutch Eating Behavior Questionnaire (Debq) for assessment of restrained, emotional, and external eating behavior. Int J Eat Disorder. 1986;5(2):295–315. doi: 10.1002/1098-108X(198602)5:2<295::AID-EAT2260050209>3.0.CO;2-T. [DOI] [Google Scholar]
- 105.Blumberg SJ, Bialostosky K, Hamilton WL, Briefel RR. The effectiveness of a short form of the household food security scale. Am J Public Health. 1999;89(8):1231–1234. doi: 10.2105/AJPH.89.8.1231. [DOI] [PMC free article] [PubMed] [Google Scholar]
- 106.Arora VS, Karanikolos M, Clair A, Reeves A, Stuckler D, McKee M. Data resource profile: the European Union statistics on income and living conditions (EU-SILC) Int J Epidemiol. 2015;44(2):451–461. doi: 10.1093/ije/dyv069. [DOI] [PubMed] [Google Scholar]
- 107.Israel AC, Roderick HA. A measure of the stability of family activities: an initial examination. Assessment. 2001;8(4):417–424. doi: 10.1177/107319110100800406. [DOI] [PubMed] [Google Scholar]
- 108.Carver DJ, Chapman CA, Thomas VS, Stadnyk KJ, Rockwood K. Validity and reliability of the Medical Outcomes Study Short Form-20 questionnaire as a measure of quality of life in elderly people living at home. Age Ageing. 1999;28(2):169–174. doi: 10.1093/ageing/28.2.169. [DOI] [PubMed] [Google Scholar]
- 109.de Brock AJ, Vermulst AA, Gerris JR, Abidin RR. Nijmeegse Ouderlijke Stress Index. Swets en Zeitlinger BV: Lisse; 1992. [Google Scholar]
- 110.Gerris JR, Boxtel DA, Vermulst AA, Janssens JM, van Zutphen RA, Felling JA. Parenting in Dutch families, Nijmegen, the Netherlands. 1993.
- 111.Cox JL, Holden JM, Sagovsky R. Detection of postnatal depression. Development of the 10-item edinburgh postnatal depression scale. Br J Psychiatry. 1987;150:782–786. doi: 10.1192/bjp.150.6.782. [DOI] [PubMed] [Google Scholar]
- 112.Derogatis LR, Melisaratos N. The Brief symptom inventory: an introductory report. Psychol Med. 1983;13(3):595–605. doi: 10.1017/S0033291700048017. [DOI] [PubMed] [Google Scholar]
- 113.de Beurs E. Brief Symptom Inventory: Handleiding. Leiden: Pits Publishers; 2004. [Google Scholar]
- 114.Derogatis LR, Fitzpatrick M. The SCL-90-R, the Brief Symptom Inventory (BSI) and the BSI-18. In: Maruish ME, editor. The use of psychological testing for treatment planning and outcomes assessment: instruments for adults 3rd ed. Mahwah: Erlbaum;2004. (pp. 1–41).
- 115.Israel AC, Roderick HA, Ivanova MY. A measure of the stability of activities in a family environment. J Psychopathol Behav. 2002;24(2):85–95. doi: 10.1023/A:1015336707701. [DOI] [Google Scholar]
- 116.Epstein NB, Baldwin LM, Bishop DS. The mcmaster family assessment device. J Marital Fam Ther. 1983;9(2):171–180. doi: 10.1111/j.1752-0606.1983.tb01497.x. [DOI] [Google Scholar]
- 117.van Rossem L, Vogel I, Steegers EA, Moll HA, Jaddoe VW, Hofman A, et al. Breastfeeding patterns among ethnic minorities: the Generation R Study. J Epidemiol Community Health. 2010;64(12):1080–1085. doi: 10.1136/jech.2009.095380. [DOI] [PubMed] [Google Scholar]
- 118.Duijts L, Jaddoe VW, Hofman A, Moll HA. Prolonged and exclusive breastfeeding reduces the risk of infectious diseases in infancy. Pediatrics. 2010;126(1):e18–e25. doi: 10.1542/peds.2008-3256. [DOI] [PubMed] [Google Scholar]
- 119.Wardle J, Guthrie CA, Sanderson S, Rapoport L. Development of the children’s eating behaviour questionnaire. J Child Psychol Psychiatry. 2001;42(7):963–970. doi: 10.1111/1469-7610.00792. [DOI] [PubMed] [Google Scholar]
- 120.Landgraf JM, Maunsell E, Speechley KN, Bullinger M, Campbell S, Abetz L, et al. Canadian-French, German and UK versions of the child health questionnaire: methodology and preliminary item scaling results. Qual Life Res. 1998;7(5):433–445. doi: 10.1023/A:1008810004694. [DOI] [PubMed] [Google Scholar]
- 121.van der Horst K, Oenema A, van de Looij-Jansen P, Brug J. The ENDORSE study: research into environmental determinants of obesity related behaviors in Rotterdam schoolchildren. BMC Public Health. 2008;8:142. doi: 10.1186/1471-2458-8-142. [DOI] [PMC free article] [PubMed] [Google Scholar]
- 122.Goodman R, Ford T, Richards H, Gatward R, Meltzer H. The Development and well-being assessment: description and initial validation of an integrated assessment of child and adolescent psychopathology. J Child Psychol Psychiatry. 2000;41(5):645–655. doi: 10.1111/j.1469-7610.2000.tb02345.x. [DOI] [PubMed] [Google Scholar]
- 123.Micali N, Simonoff E, Elberling H, Rask CU, Olsen EM, Skovgaard AM. Eating patterns in a population-based sample of children aged 5 to 7 years: association with psychopathology and parentally perceived impairment. J Dev Behav Pediatr. 2011;32(8):572–580. doi: 10.1097/DBP.0b013e31822bc7b7. [DOI] [PubMed] [Google Scholar]
- 124.Braet C, Van Strien T. Assessment of emotional, externally induced and restrained eating behaviour in nine to twelve-year-old obese and non-obese children. Behav Res Ther. 1997;35(9):863–873. doi: 10.1016/S0005-7967(97)00045-4. [DOI] [PubMed] [Google Scholar]
- 125.Birch LL, Fisher JO, Grimm-Thomas K, Markey CN, Sawyer R, Johnson SL. Confirmatory factor analysis of the Child Feeding Questionnaire: a measure of parental attitudes, beliefs and practices about child feeding and obesity proneness. Appetite. 2001;36(3):201–210. doi: 10.1006/appe.2001.0398. [DOI] [PubMed] [Google Scholar]
- 126.House J, Eisler I, Simic M, Micali N. Diagnosing eating disorders in adolescents: a comparison of the eating disorder examination and the development and well-being assessment. Int J Eat Disord. 2008;41(6):535–541. doi: 10.1002/eat.20528. [DOI] [PubMed] [Google Scholar]
- 127.van Strien T, Oosterveld P. The children’s DEBQ for assessment of restrained, emotional, and external eating in 7- to 12-year-old children. Int J Eat Disorder. 2008;41(1):72–81. doi: 10.1002/eat.20424. [DOI] [PubMed] [Google Scholar]
- 128.Owens J, Maxim R, McGuinn M, Nobile C, Msall M, Alario A. Television-viewing habits and sleep disturbance in school children. Pediatrics. 1999;104(3):e27. doi: 10.1542/peds.104.3.e27. [DOI] [PubMed] [Google Scholar]
- 129.Velde SJ, de Bourdeaudhuij I, Thorsdottir I, Rasmussen M, Hagstromer M, Klepp KI, et al. Patterns in sedentary and physical exercise behaviors and overweight in boys and girls. Int J Obes. 2006;30:S20. [Google Scholar]
- 130.van Rooij AJ, Schoenmakers TM, van den Eijnden RJ, Vermulst AA, van de Mheen D. Video game addiction test: validity and psychometric characteristics. Cyberpsychol Behav Soc Netw. 2012;15(9):507–511. doi: 10.1089/cyber.2012.0007. [DOI] [PubMed] [Google Scholar]
- 131.Veldhuis L, Struijk MK, Kroeze W, Oenema A, Renders CM, Bulk-Bunschoten AM, et al. ‘Be active, eat right’, evaluation of an overweight prevention protocol among 5-year-old children: design of a cluster randomised controlled trial. BMC Public Health. 2009;9:177. doi: 10.1186/1471-2458-9-177. [DOI] [PMC free article] [PubMed] [Google Scholar]
- 132.Raat H, Botterweck AM, Landgraf JM, Hoogeveen WC, Essink-Bot ML. Reliability and validity of the short form of the child health questionnaire for parents (CHQ-PF28) in large random school based and general population samples. J Epidemiol Community Health. 2005;59(1):75–82. doi: 10.1136/jech.2003.012914. [DOI] [PMC free article] [PubMed] [Google Scholar]
- 133.Raat H, Mohangoo AD, Grootenhuis MA. Pediatric health-related quality of life questionnaires in clinical trials. Curr Opin Allergy Clin Immunol. 2006;6(3):180–185. doi: 10.1097/01.all.0000225157.67897.c2. [DOI] [PubMed] [Google Scholar]
- 134.Raat H, Landgraf JM, Oostenbrink R, Moll HA, Essink-Bot ML. Reliability and validity of the Infant and Toddler Quality of Life Questionnaire (ITQOL) in a general population and respiratory disease sample. Qual Life Res. 2007;16(3):445–460. doi: 10.1007/s11136-006-9134-8. [DOI] [PMC free article] [PubMed] [Google Scholar]
- 135.Raat H, van Rossem L, Jaddoe VW, Landgraf JM, Feeny D, Moll HA, et al. The Generation R study: a candidate gene study and genome-wide association study (GWAS) on health-related quality of life (HRQOL) of mothers and young children. Qual Life Res. 2010;19(10):1439–1446. doi: 10.1007/s11136-010-9773-7. [DOI] [PubMed] [Google Scholar]
- 136.Duijts L, Jaddoe VW, Hofman A, Steegers EA, Mackenbach JP, de Jongste JC, et al. Maternal smoking in prenatal and early postnatal life and the risk of respiratory tract infections in infancy. The Generation R study. Eur J Epidemiol. 2008;23(8):547–555. doi: 10.1007/s10654-008-9264-0. [DOI] [PubMed] [Google Scholar]
- 137.Jenkins MA, Clarke JR, Carlin JB, Robertson CF, Hopper JL, Dalton MF, et al. Validation of questionnaire and bronchial hyperresponsiveness against respiratory physician assessment in the diagnosis of asthma. Int J Epidemiol. 1996;25(3):609–616. doi: 10.1093/ije/25.3.609. [DOI] [PubMed] [Google Scholar]
- 138.Asher MI, Keil U, Anderson HR, Beasley R, Crane J, Martinez F, et al. International Study of Asthma and Allergies in Childhood (ISAAC): rationale and methods. Eur Respir J. 1995;8(3):483–491. doi: 10.1183/09031936.95.08030483. [DOI] [PubMed] [Google Scholar]
- 139.Weiland SK, Bjorksten B, Brunekreef B, Cookson WO, von Mutius E, Strachan DP, et al. Phase II of the International Study of Asthma and Allergies in Childhood (ISAAC II): rationale and methods. Eur Respir J. 2004;24(3):406–412. doi: 10.1183/09031936.04.00090303. [DOI] [PubMed] [Google Scholar]
- 140.Flohr C, Weinmayr G, Weiland SK, Addo-Yobo E, Annesi-Maesano I, Bjorksten B, et al. How well do questionnaires perform compared with physical examination in detecting flexural eczema? Findings from the International Study of Asthma and Allergies in Childhood (ISAAC) Phase Two. Br J Dermatol. 2009;161(4):846–853. doi: 10.1111/j.1365-2133.2009.09261.x. [DOI] [PubMed] [Google Scholar]
- 141.Zhang M, Qureshi AA, Fortner RT, Hankinson SE, Wei Q, Wang LE, et al. Teenage acne and cancer risk in US women: a prospective cohort study. Cancer. 2015;121(10):1681–1687. doi: 10.1002/cncr.29216. [DOI] [PMC free article] [PubMed] [Google Scholar]
- 142.Clark EM, Ness AR, Tobias JH. Bone fragility contributes to the risk of fracture in children, even after moderate and severe trauma. J Bone Miner Res. 2008;23(2):173–179. doi: 10.1359/jbmr.071010. [DOI] [PMC free article] [PubMed] [Google Scholar]
- 143.van Beelen ME, Beirens TM, Struijk MK, den Hertog P, Oenema A, van Beeck EF, et al. ‘BeSAFE’, effect-evaluation of internet-based, tailored safety information combined with personal counselling on parents’ child safety behaviours: study design of a randomized controlled trial. BMC Public Health. 2010;10:466. doi: 10.1186/1471-2458-10-466. [DOI] [PMC free article] [PubMed] [Google Scholar]
- 144.Rasquin A, Di Lorenzo C, Forbes D, Guiraldes E, Hyams JS, Staiano A, et al. Childhood functional gastrointestinal disorders: child/adolescent. Gastroenterology. 2006;130(5):1527–1537. doi: 10.1053/j.gastro.2005.08.063. [DOI] [PMC free article] [PubMed] [Google Scholar]
- 145.Broder HL, McGrath C, Cisneros GJ. Questionnaire development: face validity and item impact testing of the Child Oral Health Impact Profile. Community Dent Oral Epidemiol. 2007;35(Suppl 1):8–19. doi: 10.1111/j.1600-0528.2007.00401.x. [DOI] [PubMed] [Google Scholar]
- 146.Dunlow N, Phillips C, Broder HL. Concurrent validity of the COHIP. Community Dent Oral Epidemiol. 2007;35(Suppl 1):41–49. doi: 10.1111/j.1600-0528.2007.00404.x. [DOI] [PMC free article] [PubMed] [Google Scholar]
- 147.Geels LM, Hoogstraten J, Prahl-Andersen B. Confirmative factor analysis of the dimensions of the Child Oral Health Impact Profile (Dutch version) Eur J Oral Sci. 2008;116(2):148–152. doi: 10.1111/j.1600-0722.2007.00515.x. [DOI] [PubMed] [Google Scholar]
- 148.Wilson-Genderson M, Broder HL, Phillips C. Concordance between caregiver and child reports of children’s oral health-related quality of life. Community Dent Oral. 2007;35:32–40. doi: 10.1111/j.1600-0528.2007.00403.x. [DOI] [PubMed] [Google Scholar]
- 149.Vogel I, Verschuure H, van der Ploeg CP, Brug J, Raat H. Estimating adolescent risk for hearing loss based on data from a large school-based survey. Am J Public Health. 2010;100(6):1095–1100. doi: 10.2105/AJPH.2009.168690. [DOI] [PMC free article] [PubMed] [Google Scholar]
- 150.Stjamesroberts I. Persistent Crying in Infancy. J Child Psychol Psyc. 1989;30(2):189–195. doi: 10.1111/j.1469-7610.1989.tb00233.x. [DOI] [PubMed] [Google Scholar]
- 151.van den Berg MP, van der Ende J, Crijnen AA, Jaddoe VW, Moll HA, Mackenbach JP, et al. Paternal depressive symptoms during pregnancy are related to excessive infant crying. Pediatrics. 2009;124(1):e96–e103. doi: 10.1542/peds.2008-3100. [DOI] [PubMed] [Google Scholar]
- 152.Brouilette R, Hanson D, David R, Klemka L, Szatkowski A, Fernbach S, et al. A diagnostic approach to suspected obstructive sleep apnea in children. J Pediatr. 1984;105(1):10–14. doi: 10.1016/S0022-3476(84)80348-0. [DOI] [PubMed] [Google Scholar]
- 153.Gartstein MA, Rothbart MK. Studying infant temperament via the Revised Infant Behavior Questionnaire. Infant Behav Dev. 2003;26(1):64–86. doi: 10.1016/S0163-6383(02)00169-8. [DOI] [Google Scholar]
- 154.Putnam SP, Rothbart MK. Development of short and very short forms of the Children’s Behavior Questionnaire. J Pers Assess. 2006;87(1):102–112. doi: 10.1207/s15327752jpa8701_09. [DOI] [PubMed] [Google Scholar]
- 155.Kochanska G, Devet K, Goldman M, Murray K, Putnam SP. Maternal Reports of Conscience Development and Temperament in Young-Children. Child Dev. 1994;65(3):852–868. doi: 10.2307/1131423. [DOI] [PubMed] [Google Scholar]
- 156.Gioia GA, Isquith PK, Guy SC, Kenworthy L, Baron IS. Test review: behavior rating inventory of executive function. Child Neuropsychol. 2000;6(3):235–238. doi: 10.1076/chin.6.3.235.3152. [DOI] [PubMed] [Google Scholar]
- 157.Ireton H, Glascoe FP. Assessing children’s development using parents’ reports. The child development inventory. Clin Pediatr (Phila) 1995;34(5):248–255. doi: 10.1177/000992289503400504. [DOI] [PubMed] [Google Scholar]
- 158.James-Roberts IS, Wolke D. Differences between maternal and objective ratings of ‘difficult’ neonatal behavioural style: implications for temperament research and clinical perspectives. J Reprod Infant Psychol. 1983;1(2):53–60. doi: 10.1080/02646838308403151. [DOI] [Google Scholar]
- 159.James-Roberts IS, Wolke D. Converges and discrepancies, among mothers’ and professionals’ assessments of difficult neonatal behaviour. J Child Psychol Psychiatry. 1988;29(1):21–42. doi: 10.1111/j.1469-7610.1988.tb00686.x. [DOI] [PubMed] [Google Scholar]
- 160.Verhulst FC, van der Ende J, Koot HM. Handleiding voor de cbcl/4-18. Rotterdam: Afdeling Kinder- en jeugdpsychiatrie Sophia Kinderziekenhuis; 1996. [Google Scholar]
- 161.Achenbach TM, Dumenci L, Rescorla LA. Ratings of relations between DSM-IV diagnostic categories and items of the CBCL/6-18, TRF, and YSR. Burlington: University of Vermont; 2001. [Google Scholar]
- 162.Walker LS, Smith CA, Garber J, van Slyke DA. Development and validation of the pain response inventory for children. Psychol Assess. 1997;9(4):392–405. doi: 10.1037/1040-3590.9.4.392. [DOI] [Google Scholar]
- 163.Wolff NJ, Darlington AS, Hunfeld JA, Verhulst FC, Jaddoe VW, Moll HA, et al. The association of parent behaviors, chronic pain, and psychological problems with venipuncture distress in infants: the Generation R Study. Health Psychol. 2009;28(5):605–613. doi: 10.1037/a0015202. [DOI] [PubMed] [Google Scholar]
- 164.Perquin CW, Hazebroek-Kampschreur AA, Hunfeld JA, Bohnen AM, van Suijlekom-Smit LW, Passchier J, et al. Pain in children and adolescents: a common experience. Pain. 2000;87(1):51–58. doi: 10.1016/S0304-3959(00)00269-4. [DOI] [PubMed] [Google Scholar]
- 165.Fenson L, Pethick S, Renda C, Cox JL, Dale PS, Reznick JS. Short-form versions of the MacArthur communicative development inventories. Appl Psycholinguist. 2000;21(1):95–115. doi: 10.1017/S0142716400001053. [DOI] [Google Scholar]
- 166.Saudino KJ, Dale PS, Oliver B, Petrill SA, Richardson V, Rutter M, et al. The validity of parent-based assessment of the cognitive abilities of 2-year-olds. Brit J Dev Psychol. 1998;16:349–363. doi: 10.1111/j.2044-835X.1998.tb00757.x. [DOI] [Google Scholar]
- 167.Isquith PK, Gioia GA, Espy KA. Executive function in preschool children: examination through everyday behavior. Dev Neuropsychol. 2004;26(1):403–422. doi: 10.1207/s15326942dn2601_3. [DOI] [PubMed] [Google Scholar]
- 168.Goodman R. The strengths and difficulties questionnaire: a research note. J Child Psychol Psychiatry. 1997;38(5):581–586. doi: 10.1111/j.1469-7610.1997.tb01545.x. [DOI] [PubMed] [Google Scholar]
- 169.Kimonis ER, Frick PJ, Barry CT. Callous-unemotional traits and delinquent peer affiliation. J Consult Clin Psychol. 2004;72(6):956–966. doi: 10.1037/0022-006X.72.6.956. [DOI] [PubMed] [Google Scholar]
- 170.Pardini D, Obradovic J, Loeber R. Interpersonal callousness, hyperactivity/impulsivity, inattention, and conduct problems as precursors to delinquency persistence in boys: a comparison of three grade-based cohorts. J Clin Child Adolesc Psychol. 2006;35(1):46–59. doi: 10.1207/s15374424jccp3501_5. [DOI] [PubMed] [Google Scholar]
- 171.Kimonis ER, Frick PJ, Skeem JL, Marsee MA, Cruise K, Munoz LC, et al. Assessing callous-unemotional traits in adolescent offenders: validation of the Inventory of Callous-Unemotional Traits. Int J Law Psychiatry. 2008;31(3):241–252. doi: 10.1016/j.ijlp.2008.04.002. [DOI] [PubMed] [Google Scholar]
- 172.Constantino JN, Davis SA, Todd RD, Schindler MK, Gross MM, Brophy SL, et al. Validation of a brief quantitative measure of autistic traits: comparison of the social responsiveness scale with the autism diagnostic interview-revised. J Autism Dev Disord. 2003;33(4):427–433. doi: 10.1023/A:1025014929212. [DOI] [PubMed] [Google Scholar]
- 173.James-Roberts IS, Halil T. Infant crying patterns in the first year: normal community and clinical findings. J Child Psychol Psychiatry. 1991;32(6):951–968. doi: 10.1111/j.1469-7610.1991.tb01922.x. [DOI] [PubMed] [Google Scholar]
- 174.Hoekstra RA, Vinkhuyzen AA, Wheelwright S, Bartels M, Boomsma DI, Baron-Cohen S, et al. The construction and validation of an abridged version of the autism-spectrum quotient (AQ-Short) J Autism Dev Disord. 2011;41(5):589–596. doi: 10.1007/s10803-010-1073-0. [DOI] [PMC free article] [PubMed] [Google Scholar]
- 175.Uher R, Heyman I, Mortimore C, Frampton I, Goodman R. Screening young people for obsessive compulsive disorder. Br J Psychiatry. 2007;191:353–354. doi: 10.1192/bjp.bp.106.034967. [DOI] [PubMed] [Google Scholar]
- 176.Widyanto L, McMurran M. The psychometric properties of the internet addiction test. Cyberpsychol Behav. 2004;7(4):443–450. doi: 10.1089/cpb.2004.7.443. [DOI] [PubMed] [Google Scholar]
- 177.Young SJ. CyberPsychol Behavior. 2009;1(3):237–244. doi: 10.1089/cpb.1998.1.237. [DOI] [Google Scholar]
- 178.Parker JG, Asher SR. Friendship and friendship quality in middle childhood—links with peer group acceptance and feelings of loneliness and social dissatisfaction. Dev Psychol. 1993;29(4):611–621. doi: 10.1037/0012-1649.29.4.611. [DOI] [Google Scholar]
- 179.Perren S, Alsaker FD. Social behavior and peer relationships of victims, bully-victims, and bullies in kindergarten. J Child Psychol Psychiatry. 2006;47(1):45–57. doi: 10.1111/j.1469-7610.2005.01445.x. [DOI] [PubMed] [Google Scholar]
- 180.Wolke D, Tippett N, Dantchev S. Bullying in the family: sibling bullying. Lancet Psychiatry. 2015;2(10):917–929. doi: 10.1016/S2215-0366(15)00262-X. [DOI] [PubMed] [Google Scholar]
- 181.Tippett N, Wolke D. Aggression between siblings: associations with the home environment and peer bullying. Aggress Behav. 2015;41(1):14–24. doi: 10.1002/ab.21557. [DOI] [PubMed] [Google Scholar]
- 182.Baber KF, Anderson J, Puzanovova M, Walker LS. Rome II versus Rome III classification of functional gastrointestinal disorders in pediatric chronic abdominal pain. J Pediatr Gastroenterol Nutr. 2008;47(3):299–302. doi: 10.1097/MPG.0b013e31816c4372. [DOI] [PMC free article] [PubMed] [Google Scholar]
- 183.Goodman E, Adler NE, Kawachi I, Frazier AL, Huang B, Colditz GA. Adolescents’ perceptions of social status: development and evaluation of a new indicator. Pediatrics. 2001;108(2):E31. doi: 10.1542/peds.108.2.e31. [DOI] [PubMed] [Google Scholar]
- 184.Zeman JL, Cassano M, Suveg C, Shipman K. Initial validation of the children’s worry management scale. J Child Fam Stud. 2010;19(4):381–392. doi: 10.1007/s10826-009-9308-4. [DOI] [Google Scholar]
- 185.Muris P, Meesters C, Eijkelenboom A, Vincken M. The self-report version of the Strengths and Difficulties Questionnaire: its psychometric properties in 8- to 13-year-old non-clinical children. Br J Clin Psychol. 2004;43(Pt 4):437–448. doi: 10.1348/0144665042388982. [DOI] [PubMed] [Google Scholar]
- 186.Sonneville KR, Calzo JP, Horton NJ, Field AE, Crosby RD, Solmi F, et al. Childhood hyperactivity/inattention and eating disturbances predict binge eating in adolescence. Psychol Med. 2015;45(12):2511–2520. doi: 10.1017/S0033291715000148. [DOI] [PMC free article] [PubMed] [Google Scholar]
- 187.de Lauzon B, Romon M, Deschamps V, Lafay L, Borys JM, Karlsson J, et al. The three-factor eating Questionnaire-R18 is able to distinguish among different eating patterns in a general population. J Nutr. 2004;134(9):2372–2380. doi: 10.1093/jn/134.9.2372. [DOI] [PubMed] [Google Scholar]
- 188.Cappelleri JC, Bushmakin AG, Gerber RA, Leidy NK, Sexton CC, Lowe MR, et al. Psychometric analysis of the Three-Factor Eating Questionnaire-R21: results from a large diverse sample of obese and non-obese participants. Int J Obes (Lond) 2009;33(6):611–620. doi: 10.1038/ijo.2009.74. [DOI] [PubMed] [Google Scholar]
- 189.Thompson JK, Cattarin J, Fowler B, Fisher E. The Perception of Teasing Scale (POTS): a revision and extension of the Physical Appearance Related Teasing Scale (PARTS) J Pers Assess. 1995;65(1):146–157. doi: 10.1207/s15327752jpa6501_11. [DOI] [PubMed] [Google Scholar]
- 190.Wijtzes AI, Jansen W, Kamphuis CB, Jaddoe VW, Moll HA, Tiemeier H, et al. Increased risk of exceeding entertainment-media guidelines in preschool children from low socioeconomic background: the Generation R Study. Prev Med. 2012;55(4):325–329. doi: 10.1016/j.ypmed.2012.07.023. [DOI] [PubMed] [Google Scholar]
- 191.Roberts C, Freeman J, Samdal O, Schnohr CW, de Looze ME, Nic Gabhainn S, et al. The Health Behaviour in School-aged Children (HBSC) study: methodological developments and current tensions. Int J Public Health. 2009;54(Suppl 2):140–150. doi: 10.1007/s00038-009-5405-9. [DOI] [PMC free article] [PubMed] [Google Scholar]
- 192.Ellis LK, Rothbart MK. Revision of the early adolescent temperament questionnaire. Poster presented at the 2001 Biennial Meeting of the Society for Research in Child Development, MinneaopolisMinnesota. 2001.
- 193.Snyder HR, Gulley LD, Bijttebier P, Hartman CA, Oldehinkel AJ, Mezulis A, et al. Adolescent emotionality and effortful control: core latent constructs and links to psychopathology and functioning. J Pers Soc Psychol. 2015;109(6):1132–1149. doi: 10.1037/pspp0000047. [DOI] [PMC free article] [PubMed] [Google Scholar]
- 194.Kaufman J, Birmaher B, Brent D, Rao U, Flynn C, Moreci P, et al. Schedule for affective disorders and schizophrenia for school-age children-present and lifetime version (K-SADS-PL): initial reliability and validity data. J Am Acad Child Adolesc Psychiatry. 1997;36(7):980–988. doi: 10.1097/00004583-199707000-00021. [DOI] [PubMed] [Google Scholar]
- 195.Adriaanse M, van Domburgh L, Hoek HW, Susser E, Doreleijers TAH, Veling W. Prevalence, impact and cultural context of psychotic experiences among ethnic minority youth. Psychological Med. 2015;45(3):637–646. doi: 10.1017/S0033291714001779. [DOI] [PubMed] [Google Scholar]
- 196.Truby H, Paxton SJ. Development of the children’s body image scale. Br J Clin Psychol. 2002;41(2):185–203. doi: 10.1348/014466502163967. [DOI] [PubMed] [Google Scholar]
- 197.Saxton J, Hill C, Chadwick P, Wardle J. Weight status and perceived body size in children. Arch Dis Child. 2009;94(12):944–949. doi: 10.1136/adc.2009.162578. [DOI] [PubMed] [Google Scholar]
- 198.Collins ME. Body figure perceptions and preferences among preadolescent children. Int J Eat Disord. 1991;10(2):199–208. doi: 10.1002/1098-108X(199103)10:2<199::AID-EAT2260100209>3.0.CO;2-D. [DOI] [Google Scholar]
- 199.Veerman JW, Straathof MA, Treffers PD, Bergh BR, van den Brink LT. Handleiding bij de competentiebelevingsschaal voor kinderen, CBSK : handleiding (manual of the self perception profile for children—Dutch version) Lise: Swets & Zeitlinger; 1997. [Google Scholar]
- 200.Harter S. Manual for the self-perception profile for children. Denver: University of Denver; 1985. [Google Scholar]
- 201.Wolfson AR, Carskadon MA, Acebo C, Seifer R, Fallone G, Labyak SE, et al. Evidence for the validity of a sleep habits survey for adolescents. Sleep. 2003;26(2):213–216. doi: 10.1093/sleep/26.2.213. [DOI] [PubMed] [Google Scholar]
- 202.Drake C, Nickel C, Burduvali E, Roth T, Jefferson C, Pietro B. The pediatric daytime sleepiness scale (PDSS): sleep habits and school outcomes in middle-school children. Sleep. 2003;26(4):455–458. [PubMed] [Google Scholar]
- 203.Carskadon MA, Vieira C, Acebo C. Association between puberty and delayed phase preference. Sleep. 1993;16(3):258–262. doi: 10.1093/sleep/16.3.258. [DOI] [PubMed] [Google Scholar]
- 204.Owens JA, Spirito A, McGuinn M. The Children’s Sleep Habits Questionnaire (CSHQ): psychometric properties of a survey instrument for school-aged children. Sleep. 2000;23(8):1043–1051. [PubMed] [Google Scholar]
- 205.Carskadon MA, Acebo C. A self-administered rating scale for pubertal development. J Adolesc Health. 1993;14(3):190–195. doi: 10.1016/1054-139X(93)90004-9. [DOI] [PubMed] [Google Scholar]