

Abstract
The pathological and radiological hallmarks of multiple sclerosis (MS) include multiple demyelinated lesions disseminated throughout the white matter of the central nervous system (CNS). More recently, the cerebral cortex has been shown to be affected in MS, but the elucidation of events causing cortical demyelination has been hampered by the lack of animal models reflecting such human cortical pathology. In this report, we have described the presence of cortical gray matter and callosal white matter demyelinating lesions in the chronic experimental autoimmune encephalomyelitis (EAE) mouse model of MS. Similar to the pathological lesions of MS patients, EAE lesions have been classified as type I‐leukocortical, type II‐intracortical and type III‐subpial. All of these lesions had varying degrees of demyelination, inflammatory cells and reactive astrocytes. Similar to MS, cortical layers during EAE showed demyelination, microglia activation, synaptic protein alterations and apoptotic cells. In addition, the callosal white matter during EAE had many inflammatory demyelinating lesions and axon degeneration. Functional electrophysiological conduction analysis showed deficits in both myelinated and unmyelinated callosal axons during early and late EAE. The chronic EAE mouse model has features that mimic cortical and callosal pathology of MS, and can be potentially used to screen agents to prevent these features of disease.
Keywords: callosal pathology, cortical pathology, demyelination, experimental autoimmune encephalomyelitis, inflammation, multiple sclerosis
INTRODUCTION
Multiple sclerosis (MS) often presents as an episode of an acute focal neurologic deficit with subsequent magnetic resonance imaging (MRI) examination revealing periventricular plaques. MS pathology is characterized by focal demyelinating lesions in white matter and gray matter of the central nervous system (CNS) of the brain and spinal cord. While sensorimotor impairment is well recognized, 40%–65% of MS patients have cognitive impairment (54). Disruption of white matter tracts in the corpus callosum (CC), which is the largest tract in the brain interconnecting associative cortical areas, has been associated with fatigue, motor impairment and cognitive changes 12, 41, 42. Integrity of the CC in MS reflects both discrete white matter lesions and diffuse normal‐appearing white matter changes, making it a potentially useful surrogate marker of clinically significant brain abnormalities in MS 13, 49, 69. Cortical atrophy is a significant determinant of progressive cognitive dysfunction (2), and cortical demyelination dominates in patients with primary and secondary progressive MS 15, 33, 50, 62.
The elucidation of pathomechanism(s) of cortical and callosal dysfunction MS has been hampered by the lack of useful animal models reflecting human cortical pathology. Experimental autoimmune encephalomyelitis (EAE) is the most widely used animal model of MS. Neocortical demyelination reflecting the topographically different cortical lesion subtypes in MS has recently been described in the marmoset induced with EAE 45, 53. The high cost of marmoset husbandry and lack of transgenic animals make the availability of rodent models more attractive. Cortical lesions during acute (Lewis rat) and relapsing remitting [Swiss Jim Lambert strain (SJL) mice] EAE in rodent models have been described, but because cortical demyelination dominates in patients with primary and secondary progressive MS, a better rodent model that mimics progressive MS clinically and pathologically is needed 46, 55, 63. Identifying historical, behavioral, functional and structural correlates will allow parametric analysis, both to more clearly identify disease‐associated changes and to suggest potential mechanisms underlying the functional changes.
Chronic Myelin Oligodendrocyte Glycoprotein (MOG) peptide‐induced EAE in C57Bl/6 mice has generally been thought to predominantly target the spinal cord, leading to sensory and motor impairments. However, recently, it was recognized that EAE may involve other CNS structures such as cerebellum and hippocampus 14, 30, 39, 55, 71, 74. Because cerebral cortical pathology as well as callosal pathology are widely recognized features of MS, herein, we examined whether these structures might also be affected in chronic EAE‐induced C57Bl/6 mice. In the present study, EAE was induced with MOG 35–55 peptide in transgenic C57Bl/6 mice expressing enhanced green fluorescent proteins (EGFP) under the proteolipid protein (PLP) promoter (PLP_EGFP) 26, 40 or yellow fluorescent protein (YFP) under the Thymocyte differentiation antigen‐1 (Thy1) promoter (21). We have described here histopathological basis of cortical and callosal pathology (inflammation, demyelination, neuronal and axonal damage) and utilized electrophysiologic compound action potential (CAP) analysis in the CC of EAE mice to describe the usefulness of functional assays to model some of the functional deficits described in MS. We hereby demonstrate for the first time cortical and callosal pathology, and callosal axon dysfunction similar to MS in chronic EAE. The chronic EAE mouse model can potentially be used to develop novel treatments targeting prevention of cortical and callosal pathology.
RESULTS
Transgenic PLP_EGFP and Thy1‐YFP C57BL/6 mice show classic clinical and histopathology signs of MOG 35–55 peptide‐induced EAE
Intact PLP_EGFP and Thy1‐YFP female C57BL/6 mice were immunized with MOG 35–55 peptide to induce active EAE. Onset of clinical signs as measured by the standard EAE grading scale began at approximately post‐injection day 12 (PI d12), peaked around days 17–20 (early EAE) and remained constant for the duration of the experiments, day 40 (late EAE, Figure 1A). These results are consistent with our previous findings using wild‐type C57BL/6 mice 37, 39, 48, 64 and shown previously in Thy1‐YFP mice 3, 4. Spinal cord, hippocampus and cerebellum of early EAE and late EAE (Figure 1B–1D) contained inflammatory lesions with the typical periventricular infiltration and accumulation of mononuclear cells.
Figure 1.

Immunization with MOG 35–55 results in generation of inflammatory demyelinating lesions throughout the spinal cord and brain. A. Intact PLP_EGFP C57BL/6 and Thy1‐YFP B6.Cg transgenic female mice were immunized with MOG peptide 35–55 to induce EAE and scored using the standard EAE grading scale. Onset of clinical signs (as measured by the standard EAE grading scale) occurred at post‐injection days 10–12, peaked around days 15–18 and remained as such for the duration of the experiments. Normal mice did not show any disease, and their clinical scores remained 0 throughout the experiment (P < 0.001, Friedman test). Number of mice in each group was n = 20. Data are representative of experiments repeated twice. B–D. Significant decrease in PLP_EGFP fluorescence and a subsequent increase in cellularity as denoted by increased DAPI nuclei (red) can be seen in the spinal cord (thoracic section), hippocampus (montage of two separate images from the same brain section) and cerebellum. Lesion borders are marked with arrows and perivascular lesion sites are marked with a dashed box. Abbreviations: EAE = experimental autoimmune encephalomyelitis; MOG = myelin oligodendrocyte protein; Thy1 = thymocyte differentiation antigen‐1; YFP = yellow fluorescent protein; PLP = proteolipid protein; EGFP = enhanced green fluorescent protein; DC = dorsal column; GM = gray matter; LF = lateral funiculus; AF = anterior funiculus; CC = corpus callosum; CA2 = cornu ammonis part 2 of hippocampus; DG = dentate gyrus; fi = fimbrae; WM = white matter; ML = molecular layer; GCL = granule cell layer; DAPI = 4′, 6‐diamidino‐2‐phenylindole.
Cortical lesions in EAE brain
The majority of MS lesions are present in the forebrain; therefore, we examined coronal brain slices with midline‐crossing segments of the CC (Figure 2A) corresponding approximately to plates 29–48 in the atlas of Paxinos and Franklin (Figure 2B) (24). In addition to the presence of inflammatory lesions in the spinal cord, hippocampus and cerebellum (Figure 1, compared with normal brain structures shown in the Supporting Information for normal brain) 14, 39, 64, 74, an increase in inflammatory lesions was seen throughout the EAE forebrain (Figure 2A). Specifically, inflammatory lesions were present in the subpial layers, cortical neuronal layers and CC white matter tracts (Figure 2). A montage of sections representing part of the EAE forebrain (the gray dashed box of Figure 2B) showed increased cellularity denoted by the nuclear stain [4′, 6‐diamidino‐2‐phenylindole (DAPI) red, Figure 2A]. The topography of extensive infiltration in various regions was classified according to those proposed by Peterson et al (50): cortical type I (leukocortical), type II (intracortical) and type III (subpial) as shown in Figure 2A and 2B. All lesions had increased inflammation as observed by an increase in DAPI+ cells, decrease in PLP_EGFP fluorescence and a decrease in Myelin Basic Protein‐MBP+ fluorescence intensity (Figure 2B). All three types of neocortical inflammatory lesions were detected in all EAE mice examined, with nearly 22 ± 8 lesions in the gray matter of the forebrain of each EAE mouse (Figure 2C). Quantification of number of various lesions showed no significant difference during early (day 20 PI) and late (day 40 PI) EAE (Figure 2C).
Figure 2.

Forebrain pathology during chronic EAE. A. Representative “late EAE” (day 40 after EAE induction) coronal brain slice (a montage of three separate images from the same brain section) stained with DAPI (red) is imaged at 4×. The total number of inflammatory lesions (yellow dashed boxes) per whole brain section was significantly increased at all time points compared with control. Consecutive sections were immunostained with microglia marker–CD45 (red) myelin protein–MBP (red) and DAPI (blue/red), and 40× magnification images are shown to emphasize the different types of cortical lesions. In addition, there were also a number of purely white matter inflammatory lesions, specifically in the CC (denoted by *). B. Area under the gray dashed box imaged at 4× magnification is shown in (A). Coronal brain slices stained with DAPI corresponded approximately to plates 29–48 in the atlas of Franklin and Paxinos (24). The inflammatory lesions were found in various areas of the brain and were divided into the following three groups: (type I‐blue) leukocortical (type II‐black) intracortical and (type III‐red) subpial. C. Quantification of the number of lesions in brain slices corresponding to plates 29–48 in the atlas of Franklin and Paxinos showed more intracortical lesions compared with leukocortical and subpial lesions. There was no significant difference in lesion numbers of early vs. late EAE time points. Number of mice used for quantification were n = 4. Abbreviations: EAE = experimental autoimmune encephalomyelitis; CC = corpus callosum; CD = cluster of differentiation; MBP = myelin basic prtoein; DAPI = 4′, 6‐diamidino‐2‐phenylindole; LC = leukocortical; IC = intracortical; SP = subpial; S1 = somatosensory cortex; M = motor cortex; LV = lateral ventricle.
Demyelination and the cellular infiltrate in EAE forebrain
There was an overall increase in DAPI+ nuclei in the cortical layers during early EAE that persisted during late EAE. In addition, a significant decrease in PLP_EGFP+ oligodendrocyte (OL) numbers and a decrease in the intensity of myelin protein immunostaining were also observed (Figure 3A, Figure S2). Leukocortical lesions involving both white matter and adjacent cortical gray matter were of variable size and shape, and were often found centered on a vessel in cortical layers VI–VII (2, 3). Some leukocortical lesions encompassed more than four cortical layers (2, 5). In addition, there was extensive demyelination and increased cell infiltration (Figure 3B). Intracortical inflammatory lesions were always centered on a vessel. They were smaller, mostly round and devoid of myelin (2, 3), whereas subpial lesions were located in the superficial pial layers, running parallel to the cortical surface (2, 3).
Figure 3.

Demyelination with persistent activation of microglia, macrophages and T cells in the cortical layers of EAE mice. A. and B. Cortical layers of normal mice present a fine pattern of OLs (PLP_EGFP‐green) and myelin (MBP‐red) along with intact subpial border (white stars). Significant decreases in PLP_EGFP fluorescence and MBP staining intensity are found throughout the cortical layers and subpial regions. Specifically, minimal MBP immunostaining is found in subpial, leukocortical and intracortical lesions, and these areas are surrounded by many DAPI+ nuclei (marked with arrows). C. Maximum numbers of infiltrating cell are found in leukocortical vessels and periventricular intracortical lesions of EAE mice at the late time point. Consecutive sections immunostained with cell markers for microglia/macrophages (CD45), T cells (CD3), B cells (CD19) and reactive astrocytes (GFAP) did not show differences in cell populations of either lesion types. Most cells were CD45+, and the least number of cells were CD19+. Abbreviations: EAE = experimental autoimmune encephalomyelitis; OL = oligodendrocytes; MBP = myelin basic protein; DAPI = 4′, 6‐diamidino‐2‐phenylindole; PLP = proteolipid protein; EGFP = enhanced green fluorescent protein; CC = corpus callosum; CD = cluster of differentiation; GFAP = glial acidic fibrillary protein.
Figure 5.

Apoptosis of neurons and OLs in cortical layers during chronic EAE. Brain section from late EAE imaged at 10× magnification represents a periventricular leukocortical lesion that has merged with a subpial lesion. A significant decrease in PLP_EGFP fluorescence and increase in DAPI+ nuclei numbers along with many TUNEL (red) positive cells specifically bordering the lesion (marked with white arrows) are seen. There are cortical OLs that are PLP_EGFP+ and TUNEL+ (A), cortical neurons that are NeuN+ and TUNEL+ (B), as well as callosal OLs that are PLP_EGFP+ and TUNEL+ (C). Abbreviations: OL = oligodendrocyte; TUNEL = terminal deoxynucleotidyl transferase dUTP nick‐end labeling; PLP = proteolipid protein; EGFP = enhanced green fluorescent protein; DAPI = 4′, 6‐diamidino‐2‐phenylindole; EAE = experimental autoimmune encephalomyelitis; NeuN = Neuronal nuclei.
Immunostaining with various immune cell markers revealed that the 10–20 times increase in DAPI+ nuclei in various lesions were Cluster of differentiation (CD) 45+ microglia/macrophages, CD3+ T cells, CD19+ B cells and Glial Fibrillary Acidic Protein (GFAP)+ activated astrocytes (Figure 3B,3C). The overall CD45+ microglia populations in all the cortical layers of early and late EAE cortices were ramified with multiple processes as compared with normal cortex (Figure S3). Similar ramified microglia populations were observed in the intracortical lesions, whereas more circular macrophage‐appearing CD45+ cells were present in subpial and leukocortical lesions (Figure 3). Subpial, intracortical and leukocortical lesions had cells that were predominantly CD45+, CD3+ and GFAP+ cells. There were fewer CD19+ B cells in these lesions. The total number of infiltrating cells did not show significant differences when comparing day 20 to day 40 of EAE. In addition, some demyelinating cortical lesions had very few infiltrating cells during late EAE (Figure S4). Furthermore, significant increase in number of demyelinated, swollen and transected axons was observed in cortical lesions that had fewer infiltrating cells (Figure S4). Thus, inflammatory cells in various regions of the MOG EAE cortex were similar to those previously described for MS 6, 23, 25, 35, 36, 46, 55, 63.
Changes in cortical neuronal morphology and apoptosis
Inflammatory demyelinating lesions in the cortex may impact cortical neurons. Thus, the integrity and overall appearance of YFP+ cortical projection neurons were assessed in Thy1‐YFP transgenic mice during early and late EAE. There was a decrease in YFP intensity in the cell body and processes of neurons, as well as Thy1‐YFP neuron numbers in the layer II and layer V of the cortex with EAE. Co‐immunostaining with myelin protein demonstrated extensive cortical demyelination (3, 4). Consecutive sections labeled with synaptic proteins showed decreased synaptic protein staining during early and late EAE (Figure 4B, 4D). As previously noted, there were many CD45+ microglia in the cortical layers during early and late EAE. These microglia encircled YFP+ cortical neurons, and a significant reduction in YFP fluorescent intensity in EAE brains occurred compared with normal brain where neurons showed minimal contact with microglia (Figure 4C).
Figure 4.

Demyelination, neuronal and synaptic pathology in cortical layers during chronic EAE. A. A subset of projection neurons in layer V are fluorescent (green) in Thy1‐YFP mice. EAE (early and late) shows decreased fluorescence in the cell bodies of these neurons. Demyelination, as seen by less coherent fiber staining of MBP (red), is associated with these abnormal neurons and increased DAPI+ (blue) nuclei. No significant difference is observed between early and late EAE. B. Synapsin immunostaining (red) in layer V of normal cortex shows typical punctuate staining in the neuron cell body but not the nucleus. Decreased staining for synapsin was seen throughout the cortex during early and late EAE, along with decreased fluorescence of Thy1‐YFP. C. Resident microglial cells (CD45‐red) in normal cortex (shown in layer V) have fewer processes and are evenly distributed. During EAE, CD45+ microglia become ramified and hypertrophied, and closely associate with many projection neurons that show decreased Thy1‐YFP fluorescence. D. Quantification of Thy1‐YFP neurons, MBP staining intensity and synapsin staining intensity in layer V showed a significant decrease in early EAE and late EAE groups (*P < 0.05; **P < 0.001, ANOVA, n = 5). Abbreviations: MBP = myelin basic protein; DAPI = 4′, 6‐diamidino‐2‐phenylindole; EAE = experimental autoimmune encephalomyelitis; Thy1= thymocyte differentiation antigen‐1; YFP = yellow fluorescent protein; CD = cluster of differentiation.
Continued demyelination and inflammation in the cortical layers of MS brain may result in apoptosis of various brain cells specifically neurons and oligodendrocytes 20, 66. To determine if cell death was also occurring in the cortex and CC during early and late EAE, terminal deoxynucleotidyl transferase deoxyuridine triphosphate (dUTP) nick‐end labeling (TUNEL) staining was performed. There was a marked increase in TUNEL‐positive cells in the various cortical layers of early and late EAE mice. Many TUNEL‐positive cells were found surrounding demyelinating lesions during early (not shown) and late EAE (Figure 5). These TUNEL‐positive cells were a mixture of immune cells, astrocytes (not shown), PLP_EGFP+ cortical OLs, callosal OLs (Figure 5A, 5C) and NeuN+ cortical neurons (Figure 5A, 5B).
Similar neural degeneration, OL loss (70), transected neurites, apoptotic neurons (50) and reduced neuronal density 25, 67 have been reported in MS cortical lesions 9, 50.
Callosal lesions in EAE brain: inflammation, demyelination and axon degeneration
The CC plays a central role in interhemispheric communication, and callosal atrophy in MS patients has been shown to correlate with disability status 12, 41, 42, 44, 59. The increase in DAPI+ nuclei in and around the lesions of CC (2, 5) was infiltrating cells that were mostly CD45+ microglia and Mac3+ macrophages (Figure 6A, 6B). Of these, nearly 30%–40% of infiltrating cells were CD3+ T cells (Figure 6C). Very few CD19+ B cells were observed in the CC (Figure 6D). In addition, GFAP+ reactive astrocytes were present (Figure 6E). The number and type of cells infiltrating the CC of EAE was not significantly different when comparing early and late EAE time points.
Figure 6.
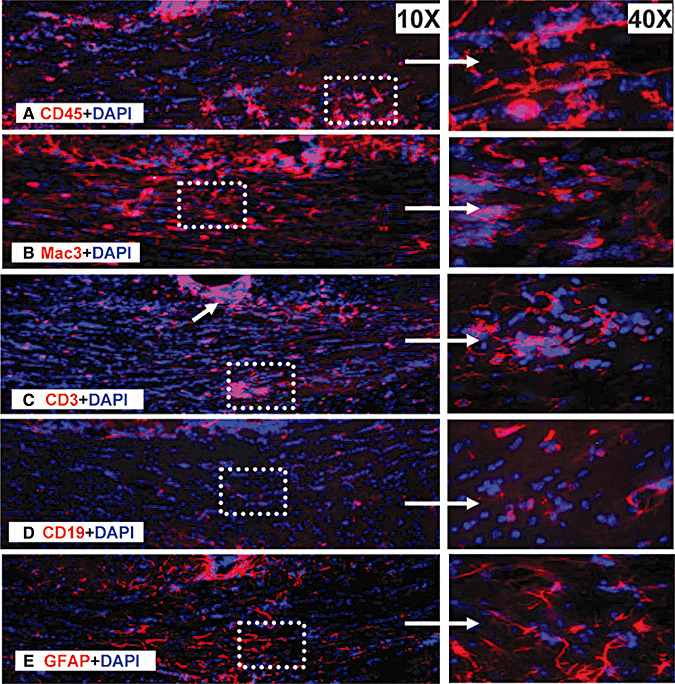
Persistent activation of infiltrating cells in the CC of chronic EAE mice. Consecutive sections from late EAE mice were immunostained with cell markers for microglia (CD45—A), macrophages (Mac3—B), T cells (CD3—C), B cells (CD19—D) and reactive astrocytes (GFAP—E), and CC was imaged at 10×. Area under the white dashed box was further imaged at 40× to show the details of infiltrating cells. Abbreviations: CC = corpus callosum; CD = cluster of differentiation; CC = corpus callosum; GFAP = glial fibrillary acidic protein.
Callosal lesions had significant decrease in myelin intensity (MBP+), and an increase in infiltrating DAPI+ nuclei that were centered on vessels was observed in both the CC of early and late EAE groups (Figure 7A). Decreased numbers of green PLP_EGFP+ cells that are OL progenitors and mature OLs were observed in the CC of early and late EAE mice compared with normal mice. Quantification of MBP intensity (callosal tracts in the area between lateral ventricles in Figure 2A) showed a significant decrease in immunostaining intensity during early and late EAE (Figure 7A, 7D). Decrease in myelin density was further confirmed by examining CC by electron microscopy (EM). High‐magnification EM images were compared from normal, early and late EAE CC (Figure 7C). Normal CC had a mixture of myelinated and unmyelinated axons. Early EAE CC had many activated microglia and large areas with demyelinated and/or thinly myelinated axons. Late EAE had many more demyelinated axons, characterized by the presence of increased vacuoles and enlarged mitochondria. Some axons had the signature thin myelin sheath around them, denoting potential remyelination (Figure 7C). The g ratio of callosal axons was significantly higher during early and late EAE CC (0.90 ± 0.026 and 0.94 ± 0.016) as compared with normal group (0.87 ± 0.004) (*P < 0.05, **P < 0.001, Figure 7D).
Figure 7.

Callosal lesions and demyelinating axons during chronic EAE. A. Representative brain section from the Thy1‐YFP group with late EAE was immunostained with MBP (green) + DAPI (red) and imaged at 4× magnification (i). Many infiltrating lesions that are periventricular, around blood vessels (white dashed box) and scattered throughout the white matter were also imaged at 40× (ii, iii). Higher magnification images show demyelination in the center of lesions surrounded by DAPI+ nuclei. B. Representative normal, early and late EAE brain sections from the PLP_EGFP group stained with DAPI (red) and imaged at 10× magnification. The CC of early and late EAE mice had reduced PLP_EGFP fluorescence in callosal axons and decreased number of PLP_EGFP OLs compared with normal controls. C. Representative electron micrographs of the CC from normal control, early EAE and late EAE show differential levels of axon myelination. Compared with normal controls, the CC of early and late EAE shows increased numbers of unmyelinated and/or damaged axons. There are numerous thinly myelinated axons in late EAE CC, and this could be an indication of remyelination. Pictures are at 4800× magnification. D. Quantification of MBP immunoreactivity in the CC was significantly lower in early and late EAE mice as compared with normal mice. Myelin intensity is presented as percent of normal controls. Measurement of axon diameter/fiber diameter (g ratio) showed a significant increase in early and late EAE callosal axons. The increase in callosal axon g ratio of EAE CC was because of demyelination of axons (*P < 0.05; **P < 0.001, ANOVAs; Bonferroni's multiple comparison post‐test). At least three mice from each group (early and late EAE) were analyzed, and a minimum of 500 fibers were measured from each mouse. Abbreviations: D3V = dorsal third ventricle; fi‐ = fimbrae; LV = lateral ventricle; cg = cingulum; OL = oligodendrocyte; MBP = myelin basic protein; DAPI = 4′, 6‐diamidino‐2‐phenylindole; CC = corpus callosum; CA1 = cornu ammonis part 1 of hippocampus; CA2 = cornu ammonis part 2 of hippocampus; PLP = proteolipid protein; EGFP = enhanced green fluorescent protein; EAE = experimental autoimmune encephalomyelitis.
Chronic EAE‐induced demyelination is accompanied by significant axon damage in the spinal cord 3, 4, 68. Axon damage in the CC of EAE brain was assessed using markers for axon structure (neurofilament NF200) and for axon damage (beta Amyloid Precursor Protein (β‐APP) and unphosphorylated neurofilament protein, SMI‐32, Figure 8A). Normal callosal axons had coherent axon structure with anti‐NF200 immunostaining and demonstrated minimal β‐APP and SMI‐32 staining consistent with no damage. Early EAE mice exhibited changes in NF200 or β‐APP immunostaining in some axons. In contrast, the late EAE group showed NF200+ and β‐APP+ immunoreactive axonal swelling and axon bulbs. Swollen axons were found with long stretches of SMI‐32+ and β‐APP+ immunostaining, indicative of significant axonal pathology (Figure 8A). Significant damage in callosal axons of early and late EAE was quantified by measuring the immunostaining intensity of SMI‐32 and β‐APP (Figure 8B).
Figure 8.

Callosal axon damage during chronic EAE. A. High‐magnification confocal images (40×) were taken to identify the presence of axon damage in PLP_EGFP mice with late EAE. CC from normal brain had coherent NF200+, robust PLP_EGFP OL numbers, and no β‐APP+ or SMI‐32+ immunostaining. In comparison, EAE mice had disrupted, incoherent, swollen and transected NF200+ axons as denoted by white stars (**). In addition, decreased numbers of PLP_EGFP OLs and increased staining intensity of β‐APP+ and SMI‐32+ was observed in late EAE mice. B. Quantification of β‐APP and SMI‐32 staining intensity showed a significant increase in early EAE and late EAE groups (*P < 0.05; **P < 0.001 ANOVA, n = 5). Abbreviations: CC = corpus callosum; OL = oligodendrocyte; EAE = experimental autoimmune encephalomyelitis; β‐APP = beta amyloid precursor protein; PLP = proteolipid protein; EGFP = enhanced green fluorescent protein; SMI‐32 = unphosphorylated neurofilament protein; **white stars = swollen and transected axons.
CC functional conduction abnormalities
For the first time, CC CAPs in EAE were recorded using methods previously used by our laboratory in the cuprizone mouse model of demyelination 17, 18, as well as by other labs investigating different CNS disease conditions 1, 38, 56. CAP recordings performed in the CC (Figure 9A) showed two downward phases, N1 and N2 (Figure 9B). The N1 component represents fast depolarization from mostly large myelinated axons, and N2 is because of slower depolarization from non‐myelinated axons. Early EAE callosal fibers had suppressed N1 and N2 responses, suggesting a disease effect on both types of fibers (Figure 9C,9D). There was a further decrease in both N1 and N2 CAP components during late EAE.
Figure 9.

Callosal conduction deficit in EAE. A. Compound action potential (CAP) responses were recorded from slices with midline‐crossing segments of the CC overlying the mid‐dorsal hippocampus. Stimulating (Sti) and recording (Rec) electrodes were each placed ∼1 mm away from midline. B. Typical CC CAPs from normal—black, early EAE—blue and late EAE—red brain slices evoked at a stimulus of 4 mA. There is a decrease in N1 and N2 amplitude in both early and late EAE groups, as well as a slight shift in peak latency for both CAP components (dashed vertical line represents CAPs beyond the stimulus artifact.). C. and D. Quantification of N1 and N2 CAP amplitudes in the CC of early EAE mice showed a significant decrease. As the disease course progressed, the CAP responses showed a small but significant further decrease in conduction. Number of mice = 4 per treatment group, number of CC sections per mouse = 3, total number of sections per treatment group = 12. Statistically significant compared with normal groups (*P < 0.05; **P < 0.001 compared with normal; 0–4 mA stimulus strength; ANOVAs, n = 3). E. Correlation of CAP amplitudes and clinical disease score: The N1 and N2 CAP amplitudes from both early and late disease were pooled together by disease score, and linear regression was performed. Both CAP components are inversely related to EAE scores (N1 slope = −0.09 ± 0.02 and P = 0.0001; N2 slope = −0.065 ± 0.02 and P = 0.005; n = 30). Abbreviations: CC = corpus callosum; Hip = hippocampus; S1 = somatosensory cortex; M = motor cortex; EAE = experimental autoimmune encephalomyelitis.
The standard clinical score used in EAE is more representative of motor issues and reflects the extent of disease predominantly in the spinal cord, not the CC. Interestingly, a time line study showed a significant negative correlation between increased clinical scores (dependent on spinal cord lesions and motor deficit) and decreased N1 and N2 CAP amplitudes in the CC. The N1 and N2 CAP amplitudes from both early and late disease were pooled together by disease score, and linear regression was performed. Both CAP components are inversely related to EAE scores (N1 slope = −0.09 ± 0.02 and P = 0.0001; N2 slope = −0.065 ± 0.02 and P = 0.005; n = 30). This suggests that pathology of the cord correlates with pathology of the CC and suggests that the inflammatory attack is multifocal (Figure 9E).
Decrease in conduction velocity is an indication of deficits in callosal axons incurred because of demyelination or direct axon damage. Estimation of conduction velocity within the CC was made possible by changing the separation between the stimulating and recording electrodes as described earlier (17). The conduction velocity of the N1 component for normal mice was 1.81 ± 0.23 ms–1. EAE mice showed a significant reduction in N1 conduction with velocities of 1.57 ± 0.07 ms–1 and 1.69 ± 0.13 ms–1 for early and late EAE time points, respectively. No significant reduction in N2 conduction velocity was observed during the early and late EAE time points (early EAE 0.51 ± 0.02 ms–1 and late EAE 0.55 ± 0.01 ms–1) compared with normal (0.58 ± 0.1 ms–1). These data establish the functional effects of EAE‐induced demyelination and axon damage in the CC.
To estimate conduction deficits because of axon damage, as opposed to demyelination, an estimation of refractoriness of CC axons was performed. Refractoriness is the phenomenon of reduced excitability following an action potential. This was analyzed by quantifying the suppression of a second CAP response in paired stimulus trials as previously described 17, 56. Similar example series of the second response evoked in paired stimulus presentations at interpulse intervals from 2 to 8 ms, after subtracting out the responses to a conditioning pulse have been recently published (17). The CAP amplitude elicited by the second pulse in each paired stimulation (C2) divided by the CAP amplitude to single‐pulse stimulation (C1) was plotted (Figure 10B). These C2/C1 ratios were averaged for each group, and mean values were fitted to Boltzmann sigmoid curves (Figure 10B). Rightward shifts in these curves correspond to increases in the refractory recovery cycle in the callosal axons and are indicative of axonal damage during EAE.
Figure 10.

Conduction velocity and refractoriness of callosal axons. A. To assess the effect of EAE on axon conduction velocity within the CC, the distance between the stimulating and recording electrodes was varied from 0.5 to 2.5 mm, and CAPs were recorded. The CAP latency of the N1 and N2 components was measured at each point and graphed vs. this distance. Linear regression analysis was performed for each CAP component to yield a slope that was the inverse of the velocity, followed by statistical comparison of the velocities (17). Conduction velocity of myelinated axons showed a marked decrease in both early and late EAE mice as compared with normal control. No significant differences in conduction velocity of N2 components of various groups were found. The velocities (mean ± SD m/s) of normal, early and late EAE are presented in the table. B. Average C2/C1 ratios [obtained from plots of mean CAP amplitude elicited by the second pulse in each paired stimulation (C2) divided by the CAP amplitude to single‐pulse stimulation (C1) were fitted to Boltzmann sigmoid curves. A rightward shift in curves for N1 shows decreased refractoriness in both early and late EAE groups (n = 4). The interpulse interval values (mean ± SD) at 50% of C2/C1 ratios are for N1 and N2 components of normal, early and late EAE, and are presented in the table. Abbreviations: EAE = experimental autoimmune encephalomyelitis; CC = corpus callosum; CAP = compound action potential; SD = standard deviation.
In normal mice, the N1 component evoked by the second pair of pulses was 50% of the amplitude of a single‐pulse presentation when the interpulse interval was 2.1 ± 0.22 ms. EAE induced a significant rightward shift in N1 refractoriness, with interpulse interval values of 3.8 ± 0.2 ms and 4.0 ± 0.11 ms for the early and late time periods, respectively (P < 0.05). Interestingly, there was no difference among the normal (3.7 ± 0.12 ms), early EAE (3.9 ± 0.2 ms) and late EAE (4.1 ± 0.22 ms) groups in N2 interpulse interval values. These N2 results are likely because of greater numbers of unmyelinated axons conducting in the diseased state.
DISCUSSION
Cortical pathology, callosal atrophy and callosal axonal loss are substrates of progression in MS 7, 33, 34. These pathologies appear to be prevalent in MS, but even with major advances in the imaging field, many cortical lesions are thought to remain largely undetected with current MRI resolution 27, 28. In contrast, histopathological studies are able to distinguish between acute axonal damage and permanent loss of axons, but these studies can only be performed in MS tissue from patients with long‐standing MS. Important questions such as the role of inflammation, demyelination, axonal damage and conduction abnormalities on motor dysfunction have remain unanswered.
A more definitive understanding of the evolution of MS pathologic abnormalities during the MS disease course has been hampered by the lack of useful rodent models reflecting human cortical pathology. Cortical lesions in the Lewis rat model immunized with MOG peptide have been described, but these lesions are reversible, making the model less suitable for investigating chronic phases of MS 46, 63. Recently, the presence of cortical lesions in relapsing remitting model of EAE in SJL mice has been shown (55), but because cortical demyelination dominates in patients with primary and secondary progressive MS, a better rodent model that mimics progressive MS clinically and pathologically is needed. Identifying historical, behavioral, functional and structural correlates allows parametric analysis, both to more clearly identify disease‐associated changes and to suggest potential mechanisms underlying the functional changes. While there is no perfect MS model, the MOG‐induced chronic EAE model appears to show some salient features of cortical and callosal abnormalities in MS.
The majority of white matter plaques in MS occurs in a periventricular distribution (10). Similar lesions are also observed during chronic EAE. Unlike white matter lesions, cortical lesions typically have less blood–brain barrier breakdown (65) and the absence of infiltrates (with the exception of some activated ramified microglia) 10, 50, 61. This leads to the possibility that cortical lesions are mediated by soluble factors (8). However, virtually all that is known regarding cortical MS pathology is based on the analysis of archival MS tissue from patients with long‐standing disease. Thus, the extent and relevance of cortical inflammation in MS pathogenesis may be underappreciated as lymphocyte infiltration has been reported in purely cortical lesions of biopsied MS patients 6, 19, 51. This may signify either that the pathogenesis of cortical demyelination is different in the subgroup of MS patients that were biopsied or that cortical inflammation was transient and therefore rarely observed in chronic MS patients. During EAE, majority of cortical lesions had infiltrating immune cells. It is possible that EAE at day 40 is not really late in disease, and majority of cortical lesions may become non‐inflammatory much later in disease (EAE at days 60–100).
Microglia‐mediated neurotoxicity has been well described in vitro, where activated microglia trigger the production and release of neurotoxic molecules and pro‐inflammatory cytokines that lead to severe neuronal dysfunction through axonal loss 16, 60. In vivo neuronal toxicity with synaptic dysfunction during EAE has been correlated with the appearance of inflammatory infiltrates and activated microglia in the present and past studies 43, 73. Despite reports of limited inflammation in chronic cortical demyelinated MS lesions, the presence of hypertrophied astrocytes, microglial major histocompatibility complex, CD68, inducible nitric oxide synthase, elevated levels of myeloperoxidase, allograft inflammatory factor 1 expression and meningeal T cell infiltration has been observed in the MS cortex 19, 25, 29. In addition, there is clear evidence for neural degeneration, oligodendroglia loss (70), transected neurites, apoptotic neurons (50) and reduced neuronal density 25, 67.
Similar findings have been observed in the present study during chronic EAE with some differences. The borders of demyelinating cortical lesions in EAE are not clearly defined as cortical MS lesions and a smaller number of demyelinating cortical lesions with no infiltrating immune cells have been detected in EAE as compared with MS. These differences could be attributed partially to the origin of disease and differences in human and rodent brain structure. MS is a spontaneous disease, while EAE is induced with brain tissue antigens. In the human brain, the white matter underlying the cerebral cortex is highly prominent, developed and occupies a much larger volume than in other mammals including rodent and may reflect the difference in the presentation of cortical pathology between chronic EAE and published cortical histopathology data of archival MS tissue from patients with long‐standing MS 6, 35, 61.
MS is a heterogeneous disease, and different regions of CNS are affected more in some MS patients compared with others 32, 36, 52. Some patients have primarily spinal cord disease and sensorimotor disability, while others have primarily cortical disability. Because permanent disability accumulation occurs in a setting of robust immunosuppressive therapy 22, 47, novel treatments are needed that are directly neuroprotective to the CNS, not merely indirectly neuroprotective via reduced immune attack. To this end, different CNS regions are known to vary with respect to neurotrophic factors, receptor expression and sensitivity to excitotoxicity‐induced cell death11, 31, 57, 58, 72. It is therefore unlikely that one treatment will provide neuroprotection in all CNS regions.
As the field moves closer to realistic neuroprotective treatments in MS, one can appreciate that further directly neuroprotective treatments may need to be tailored to one region of the CNS vs. another (5). It is possible that a given future neuroprotective treatment in MOG EAE may prevent spinal cord pathology, but not cortical or callosal pathology, and vice versa. Thus, better developed models of MS, focusing on various regions of neurodegeneration, are needed for such tailored neuroprotective treatments. While, clearly, the spinal cord is a major target in MOG EAE, our data show that the cortical layers and CC are also targeted. This has relevance to MS because both the spinal cord and CC are affected in MS.
METHODS
Animals
Breeding pairs of PLP_EGFP mice on the C57BL/6J background were a kind gift from Dr Wendy Macklin (University of Colorado, Denver School of Medicine). The generation, characterization and genotyping of PLP_EGFP transgenic mice have been reported 26, 40. Breeding pairs of Thy1‐YFP on the C6.Bg background were purchased from Jackson labs (Bar Harbor, Maine). Mice were bred in‐house at the University of California, Los Angeles animal facility. All procedures were conducted in accordance with the National Institutes of Health (NIH) and were approved by the Institutional Guide for the Care and Use of Laboratory Animals, Animal Care and Use Committee of UCLA.
EAE induction
We have routinely induced chronic EAE in female transgenic PLP_EGFP (green fluorescent protein in PLP‐expressing OLs and myelin) C57BL/6 mice immunized with MOG peptide 35–55 1, 2. On post‐injection (PI) day 0, each mouse received both subcutaneous inoculation with MOG peptide 35–55 (300 µg/mouse, Mimotopes, Clayton, Victoria, Australia) in Complete Freund's Adjuvant (CFA) (1 mg/mL Myobacterium tuberculosis strain ATCC 25177 / H37 Ra) and an intravenous inoculation of Bordatella pertussis toxin (PTx: 500 ng/mouse). A second inoculation of PTx was administered on PI day 2. All mice were then immunized with MOG again at day 7. Mice were monitored and scored daily for clinical disease severity according to the standard 0–5 EAE grading scale: 0, unaffected; 1, tail limpness; 2, failure to right upon attempt to roll over; 3, partial paralysis; 4, complete paralysis; and 5, moribund. Each day, the mean of the clinical scores of all mice within a given treatment group were determined, thereby yielding the mean clinical score for that treatment group. EAE clinical signs began at days 10–12. Some mice were followed clinically for up to 40 days (late EAE) after disease induction, whereas others were killed earlier at day 20 (early EAE) after disease induction.
Number of mice
There were two different groups (normal and EAE) per experiment. Animals were sacrificed during “early EAE” and during “late EAE.” There were 20 animals per group (4 + 4 animals for electrophysiology recording; 4 + 4 animals perfused for immunohistochemistry, 2 + 2 animals perfused for EM). The experiment was repeated two times for the Thy1‐YFP and two times for the PLP_EGFP groups.
Histopathology, immunohistochemistry and EM
Mice were deeply anesthetized with isoflurane and intracardially perfused with phosphate‐buffered saline (PBS), followed by either 4% paraformaldehyde (PFA) solution (for immunohistochemistry) or 2% PFA + 2% glutaraldehyde solution (for EM). Brains and spinal cord were removed, postfixed in PFA and embedded in gelatin. Twenty‐micrometer coronal brain sections were cut at the fornix region of the CC and placed in 24‐well plates in PBS.
Histopathology and immunohistochemistry
Serial sections were examined by immunohistochemistry as previously described (48). Briefly, PFA‐fixed slices were washed, permeabilized (2% Triton X‐100 (Sigma, St. Louis, MO, USA) and 2% normal goat serum (NGS) for 30 minutes) and blocked (15%–20% NGS for 2 h). White matter immunostaining was enhanced by treating sections with 95% ethanol/5% acetic acid for 15 minutes prior to permeabilization and blocking. Various series of cell‐type‐specific antibodies were used. The following were used to detect: axons—anti‐NF200 (1:500, Chemicon, Temecula, CA, USA and 1:1000, Sigma, St. Louis, MO, USA); microglia/macrophage/monocyte—anti‐CD45 (1:1000; PharMingen, La Jolla, CA, USA); macrophages—Mac3 (1:500; BD Biosciences, San Diego, CA, USA); T cells—anti‐CD3; B cells—anti‐CD19 (1:1000, Abcam, Cambridge, MA, USA); astrocytes—anti‐GFAP (1:1000, Chemicon); OLs—PLP_EGFP fluorescence; myelin—anti‐MBP (1:1000, Chemicon); synaptic protein—anti‐synapsin (1:500, Chemicon); and cell death—anti‐caspase‐3 (1:500, Chemicon) and TUNEL assay (Boehringer Manheim, Indianapolis, IN, USA). Inflammatory lesions were defined as a cluster of at least 20 DAPI+/CD45+ cells. The sections were then labeled with secondary antibodies conjugated to Tetramethyl Rhodamine Iso‐Thiocyanate (TRTC) and Cyanine5 (CY5) (1:1000, Vector Laboratories, Burlingame, CA, USA and Chemicon). Immunoglobulin (IgG) control experiments were performed for all primary antibodies, and no staining was observed under these conditions. To assess the number of cells, a nuclear stain, DAPI (2 ng/mL; Molecular Probes, Carlsbad, CA, USA), was added for 15 minutes prior to final washes after secondary antibody addition. The sections were mounted on slides, dried and coverslipped in fluoromount G (Fisher Scientific, Pittsburgh, PA, USA).
EM
PFA and glutaraldehyde perfused brains were cut sagittally in half. The genu area of CC was identified under a dissecting scope, and 4‐mm2 blocks [from the mid‐CC up to 1/3 of the splenum, corresponding to plates 29–48 from the atlas of Franklin and Paxinos (24)] were carefully dissected. These blocks were further cut in 1‐mm sections for epon embedding.
Microscopy and quantification
Stained sections were examined and photographed using a spin disk confocal fluorescent microscope (BX62 DSU; Olympus, Tokyo, Japan) equipped with Plan Fluor objectives connected to a camera (Hamamatsu Orca, Bridgewater, NJ, USA). Digital images were collected and analyzed using Slide book (Denver, CO, USA) and ImageJ (U. S. National Institutes of Health, Bethesda, MD, USA). Image intensities were adjusted evenly for each set. Images were rotated, cropped and assembled using Adobe Photoshop (Adobe Systems, San Jose, CA, USA). When showing multiple staining, we routinely used the green pseudo‐color to represent TRITC‐labeled protein (without showing the PLP_EGFP‐green channel).
Images were captured under microscope (4×, 10× or 40×). Images from the same areas of CC and cortical layers using similar light exposure time were acquired separately from delineated regions. Eight to 10 optical sections were acquired for each section. Every third optical section image was used for analysis. For cortical demyelination, cortical neuron counts and cortical cell death, the region immediately above the cornu ammonis part 1 of hippocampus and/or the end of lateral ventricle was set. Cell death was assessed by co‐labeling OLP (or OLs or neurons) with either caspase‐3 or TUNEL. Myelin (MBP+) was analyzed by density measurement. All images were converted to gray scale and then analyzed by density measurement with ImageJ v1.41 (http://rsbweb.nih.gov/ij/). A fixed threshold range of 0–160 was chosen to highlight the staining signals in normal CC and cerebral cortex, and the total area within this range was measured, averaged, compared and presented per mm2, except where data was subsequently normalized (48).
For EM quantification, serial ultrathin sections embedded in epon were stained with uranyl acetate–lead citrate and analyzed similar to previously published studies(18). The ratio of axon diameter to total fiber diameter (g ratio) was measured by dividing the circumference of an axon without myelin by the circumference of the same axon including myelin (64). For most axons, two encounters were measured. At least 500 axons were analyzed in each treatment group.
Electrophysiological recording procedures
CAP recordings, conduction velocity measurements and axon refractoriness measurements were performed as previously described 17, 18.
Statistical analysis
Quantification of immunostaining results was similar to previous studies 18, 64. At least 8–10 sections were analyzed (n = 4–6 animals). To quantify electrophysiology results from each treatment group, recordings from two to three caudal slices (n = 4–8 animals) for a total of 8–16 recordings were analyzed. To quantify the “g ratio” of callosal axons, axon diameter and fiber diameter from more than 500 axons from 8 to 10 random fields/animal of EM images at ×4800 and ×14 000 were measured. Results from the same experimental protocols were pooled together and expressed as mean ± standard error of the mean or standard deviation, with n = number of animals. Statistical analysis of mean values was carried out using one‐way analysis of variance, and Friedman test (only for clinical scores) or Bonferroni's multiple comparison post‐test. Differences were considered significant at the P < 0.05 level. Statistics were performed using Microcal Origin (Northampton, MA, USA) or Prism 4 (GraphPad Prism Software Inc., La Jolla, CA, USA).
Supporting information
Figure S1. Representative sections of spinal cord, hippocampus and cerebellum from normal PLP_EGFP (green) C57Bl/6 mice stained with DAPI (red). Abbreviations: DC = dorsal column; GM = gray matter; LF = lateral funiculus; AF = anterior funiculus; CC = corpus callosum; CA2 = Cornu Ammonis part 2 of hippocampus; DG = dentate gyrus; fi = fimbrae; WM = white matter; ML = molecular layer; GCL = granule cell layer.
Figure S2. (A) Representative brain sections from PLP_EGFP group were immunostained with MBP (red) and imaged at 10× magnification. A decrease in PLP_EGFP cells and myelin intensity was seen in early and late EAE. (B) Quantification of myelin intensity as measured by MBP immunostaining showed a more significant decrease in late EAE as compared to early EAE (*P < 0.05; **P < 0.001 ANOVA, n = 5).
Figure S3. Representative sections of cortical layers from normal and late EAE mice stained with CD45 (red) and DAPI (blue). CD45+ microglia from EAE cortex were ramified with multiple processes as compared to microglia from normal cortex.
Figure S4. (A) Representative sections of cortical layers from late PLP_EGFP EAE mice stained with MBP (red) and DAPI (blue) and images at 10× magnification. Many intracortical and leukocortical lesions are visible. Most of the lesions are devoid of myelin staining and a few lesions are also devoid of infiltrating cells (DAPI‐; white arrows and white dashed squares). (B) Detailed view was obtained from the sections by imaging them at 40× magnification. There is a significant decrease in PLP_EGFP cell numbers in the lesioned area. (C) High magnification confocal images (40×) were taken to identify the presence of axon damage in and around EAE cortical lesions. Similar area from a normal brain section had mostly myelinated axons with more MBP staining (red) and very few visible NF200+ (green) axons. In cortical lesions of early EAE, many axons were demyelinated and increased NF200+ axons were visible. By late EAE, more of the axons were demyelinated, disrupted, incoherent, swollen and transected (white stars).
Supporting info item
Supporting info item
Supporting info item
Supporting info item
ACKNOWLEDGMENTS
This work was generously supported by LNE Training Award 5T32HD007228 and NMSS Center Grant CA1028. Our sincere thanks to Ms Thompson for EM help.
REFERENCES
- 1. Aguirre A, Dupree JL, Mangin JM, Gallo V (2007) A functional role for EGFR signaling in myelination and remyelination. Nat Neurosci 10:990–1002. [DOI] [PubMed] [Google Scholar]
- 2. Amato MP, Portaccio E, Goretti B, Zipoli V, Battaglini M, Bartolozzi ML et al (2007) Association of neocortical volume changes with cognitive deterioration in relapsing‐remitting multiple sclerosis. Arch Neurol 64:1157–1161. [DOI] [PubMed] [Google Scholar]
- 3. Bannerman PG, Hahn A (2007) Enhanced visualization of axonopathy in EAE using thy1‐YFP transgenic mice. J Neurol Sci 260:23–32. [DOI] [PubMed] [Google Scholar]
- 4. Bannerman PG, Hahn A, Ramirez S, Morley M, Bonnemann C, Yu S et al (2005) Motor neuron pathology in experimental autoimmune encephalomyelitis: studies in THY1‐YFP transgenic mice. Brain 128(Pt 8):1877–1886. [DOI] [PubMed] [Google Scholar]
- 5. Bendfeldt K, Egger H, Nichols TE, Loetscher P, Denier N, Kuster P et al (2010) Effect of immunomodulatory medication on regional gray matter loss in relapsing‐remitting multiple sclerosis—a longitudinal MRI study. Brain Res 1325:174–182. [DOI] [PubMed] [Google Scholar]
- 6. Bo L (2009) The histopathology of grey matter demyelination in multiple sclerosis. Acta Neurol Scand Suppl 189:51–57. [DOI] [PubMed] [Google Scholar]
- 7. Bo L, Geurts JJ, Mork SJ, van der Valk P (2006) Grey matter pathology in multiple sclerosis. Acta Neurol Scand Suppl 183:48–50. [DOI] [PubMed] [Google Scholar]
- 8. Bo L, Geurts JJ, van der Valk P, Polman C, Barkhof F (2007) Lack of correlation between cortical demyelination and white matter pathologic changes in multiple sclerosis. Arch Neurol 64:76–80. [DOI] [PubMed] [Google Scholar]
- 9. Bo L, Vedeler CA, Nyland H, Trapp BD, Mork SJ (2003) Intracortical multiple sclerosis lesions are not associated with increased lymphocyte infiltration. Mult Scler 9:323–331. [DOI] [PubMed] [Google Scholar]
- 10. Bo L, Vedeler CA, Nyland HI, Trapp BD, Mork SJ (2003) Subpial demyelination in the cerebral cortex of multiple sclerosis patients. J Neuropathol Exp Neurol 62:723–732. [DOI] [PubMed] [Google Scholar]
- 11. Bondy C, Werner H, Roberts CT Jr, LeRoith D (1992) Cellular pattern of type‐I insulin‐like growth factor receptor gene expression during maturation of the rat brain: comparison with insulin‐like growth factors I and II. Neuroscience 46:909–923. [DOI] [PubMed] [Google Scholar]
- 12. Bonzano L, Tacchino A, Roccatagliata L, Abbruzzese G, Mancardi GL, Bove M (2008) Callosal contributions to simultaneous bimanual finger movements. J Neurosci 28:3227–3233. [DOI] [PMC free article] [PubMed] [Google Scholar]
- 13. Boroojerdi B, Hungs M, Mull M, Topper R, Noth J (1998) Interhemispheric inhibition in patients with multiple sclerosis. Electroencephalogr Clin Neurophysiol 109:230–237. [DOI] [PubMed] [Google Scholar]
- 14. Brown DA, Sawchenko PE (2007) Time course and distribution of inflammatory and neurodegenerative events suggest structural bases for the pathogenesis of experimental autoimmune encephalomyelitis. J Comp Neurol 502:236–260. [DOI] [PubMed] [Google Scholar]
- 15. Brownell B, Hughes JT (1962) The distribution of plaques in the cerebrum in multiple sclerosis. J Neurol Neurosurg Psychiatry 25:315–320. [DOI] [PMC free article] [PubMed] [Google Scholar]
- 16. Cardona AE, Pioro EP, Sasse ME, Kostenko V, Cardona SM, Dijkstra IM et al (2006) Control of microglial neurotoxicity by the fractalkine receptor. Nat Neurosci 9:917–924. [DOI] [PubMed] [Google Scholar]
- 17. Crawford DK, Mangiardi M, Tiwari‐Woodruff SK (2009) Assaying the functional effects of demyelination and remyelination: revisiting field potential recordings. J Neurosci Methods 182:25–33. [DOI] [PubMed] [Google Scholar]
- 18. Crawford DK, Mangiardi M, Xia X, Lopez‐Valdes HE, Tiwari‐Woodruff SK (2009) Functional recovery of callosal axons following demyelination: a critical window. Neuroscience 164:1407–1421. [DOI] [PubMed] [Google Scholar]
- 19. Dal Bianco A, Bradl M, Frischer J, Kutzelnigg A, Jellinger K, Lassmann H (2008) Multiple sclerosis and Alzheimer's disease. Ann Neurol 63:174–183. [DOI] [PubMed] [Google Scholar]
- 20. Das A, Guyton MK, Butler JT, Ray SK, Banik NL (2008) Activation of calpain and caspase pathways in demyelination and neurodegeneration in animal model of multiple sclerosis. CNS Neurol Disord Drug Targets 7:313–320. [DOI] [PubMed] [Google Scholar]
- 21. Feng G, Mellor RH, Bernstein M, Keller‐Peck C, Nguyen QT, Wallace M et al (2000) Imaging neuronal subsets in transgenic mice expressing multiple spectral variants of GFP. Neuron 28:41–51. [DOI] [PubMed] [Google Scholar]
- 22. Filippi M, Rocca MA, Falini A, Caputo D, Ghezzi A, Colombo B et al (2002) Correlations between structural CNS damage and functional MRI changes in primary progressive MS. Neuroimage 15:537–546. [DOI] [PubMed] [Google Scholar]
- 23. Fox EJ (2004) Immunopathology of multiple sclerosis. Neurology 63(Suppl. 6):S3–S7. [DOI] [PubMed] [Google Scholar]
- 24. Franklin K, Paxinos G (2001) The Mouse Brain: In Stereotaxic Coordinates. Academic Press: San Diego, CA, USA. [Google Scholar]
- 25. Frischer JM, Bramow S, Dal‐Bianco A, Lucchinetti CF, Rauschka H, Schmidbauer M et al (2009) The relation between inflammation and neurodegeneration in multiple sclerosis brains. Brain 132(Pt 5):1175–1189. [DOI] [PMC free article] [PubMed] [Google Scholar]
- 26. Fuss B, Afshari FS, Colello RJ, Macklin WB (2001) Normal CNS myelination in transgenic mice overexpressing MHC class I H‐2L(d) in oligodendrocytes. Mol Cell Neurosci 18:221–234. [DOI] [PubMed] [Google Scholar]
- 27. Geurts JJ, Bo L, Pouwels PJ, Castelijns JA, Polman CH, Barkhof F (2005) Cortical lesions in multiple sclerosis: combined postmortem MR imaging and histopathology. AJNR Am J Neuroradiol 26:572–577. [PMC free article] [PubMed] [Google Scholar]
- 28. Geurts JJ, Pouwels PJ, Uitdehaag BM, Polman CH, Barkhof F, Castelijns JA (2005) Intracortical lesions in multiple sclerosis: improved detection with 3D double inversion‐recovery MR imaging. Radiology 236:254–260. [DOI] [PubMed] [Google Scholar]
- 29. Gray E, Thomas TL, Betmouni S, Scolding N, Love S (2008) Elevated activity and microglial expression of myeloperoxidase in demyelinated cerebral cortex in multiple sclerosis. Brain Pathol 18:86–95. [DOI] [PMC free article] [PubMed] [Google Scholar]
- 30. Hobom M, Storch MK, Weissert R, Maier K, Radhakrishnan A, Kramer B et al (2004) Mechanisms and time course of neuronal degeneration in experimental autoimmune encephalomyelitis. Brain Pathol 14:148–157. [DOI] [PMC free article] [PubMed] [Google Scholar]
- 31. Iihara K, Joo DT, Henderson J, Sattler R, Taverna FA, Lourensen S et al (2001) The influence of glutamate receptor 2 expression on excitotoxicity in Glur2 null mutant mice. J Neurosci 21:2224–2239. [DOI] [PMC free article] [PubMed] [Google Scholar]
- 32. Kornek B, Lassmann H (2003) Neuropathology of multiple sclerosis—new concepts. Brain Res Bull 61:321–326. [DOI] [PubMed] [Google Scholar]
- 33. Kutzelnigg A, Lassmann H (2005) Cortical lesions and brain atrophy in MS. J Neurol Sci 233:55–59. [DOI] [PubMed] [Google Scholar]
- 34. Kutzelnigg A, Lassmann H (2006) Cortical demyelination in multiple sclerosis: a substrate for cognitive deficits? J Neurol Sci 245:123–126. [DOI] [PubMed] [Google Scholar]
- 35. Kutzelnigg A, Lucchinetti CF, Stadelmann C, Bruck W, Rauschka H, Bergmann M et al (2005) Cortical demyelination and diffuse white matter injury in multiple sclerosis. Brain 128(Pt 11):2705–2712. [DOI] [PubMed] [Google Scholar]
- 36. Lassmann H (1998) Neuropathology in multiple sclerosis: new concepts. Mult Scler 4:93–98. [DOI] [PubMed] [Google Scholar]
- 37. Liu HB, Loo KK, Palaszynski K, Ashouri J, Lubahn DB, Voskuhl RR (2003) Estrogen receptor alpha mediates estrogen's immune protection in autoimmune disease. J Immunol 171:6936–6940. [DOI] [PubMed] [Google Scholar]
- 38. Lo AC, Saab CY, Black JA, Waxman SG (2003) Phenytoin protects spinal cord axons and preserves axonal conduction and neurological function in a model of neuroinflammation in vivo . J Neurophysiol 90:3566–3571. [DOI] [PubMed] [Google Scholar]
- 39. MacKenzie‐Graham A, Tiwari‐Woodruff SK, Sharma G, Aguilar C, Vo KT, Strickland LV et al (2009) Purkinje cell loss in experimental autoimmune encephalomyelitis. Neuroimage 48:637–651. [DOI] [PMC free article] [PubMed] [Google Scholar]
- 40. Mallon BS, Shick HE, Kidd GJ, Macklin WB (2002) Proteolipid promoter activity distinguishes two populations of NG2‐positive cells throughout neonatal cortical development. J Neurosci 22:876–885. [DOI] [PMC free article] [PubMed] [Google Scholar]
- 41. Manson SC, Palace J, Frank JA, Matthews PM (2006) Loss of interhemispheric inhibition in patients with multiple sclerosis is related to corpus callosum atrophy. Exp Brain Res 174:728–733. [DOI] [PubMed] [Google Scholar]
- 42. Manson SC, Wegner C, Filippi M, Barkhof F, Beckmann C, Ciccarelli O et al (2008) Impairment of movement‐associated brain deactivation in multiple sclerosis: further evidence for a functional pathology of interhemispheric neuronal inhibition. Exp Brain Res 187:25–31. [DOI] [PMC free article] [PubMed] [Google Scholar]
- 43. Marques KB, Santos LM, Oliveira AL (2006) Spinal motoneuron synaptic plasticity during the course of an animal model of multiple sclerosis. Eur J Neurosci 24:3053–3062. [DOI] [PubMed] [Google Scholar]
- 44. Martola J, Stawiarz L, Fredrikson S, Hillert J, Bergstrom J, Flodmark O, Kristoffersen Wiberg M (2007) Progression of non‐age‐related callosal brain atrophy in multiple sclerosis: a 9‐year longitudinal MRI study representing four decades of disease development. J Neurol Neurosurg Psychiatry 78:375–380. [DOI] [PMC free article] [PubMed] [Google Scholar]
- 45. Merkler D, Boscke R, Schmelting B, Czeh B, Fuchs E, Bruck W, Stadelmann C (2006) Differential macrophage/microglia activation in neocortical EAE lesions in the marmoset monkey. Brain Pathol 16:117–123. [DOI] [PMC free article] [PubMed] [Google Scholar]
- 46. Merkler D, Ernsting T, Kerschensteiner M, Bruck W, Stadelmann C (2006) A new focal EAE model of cortical demyelination: multiple sclerosis‐like lesions with rapid resolution of inflammation and extensive remyelination. Brain 129(Pt 8):1972–1983. [DOI] [PubMed] [Google Scholar]
- 47. Molyneux PD, Kappos L, Polman C, Pozzilli C, Barkhof F, Filippi M et al (2000) The effect of interferon beta‐1b treatment on MRI measures of cerebral atrophy in secondary progressive multiple sclerosis. European Study Group on Interferon beta‐1b in secondary progressive multiple sclerosis. Brain 123(Pt 11):2256–2263. [DOI] [PubMed] [Google Scholar]
- 48. Morales LB, Loo KK, Liu HB, Peterson C, Tiwari‐Woodruff S, Voskuhl RR (2006) Treatment with an estrogen receptor alpha ligand is neuroprotective in experimental autoimmune encephalomyelitis. J Neurosci 26:6823–6833. [DOI] [PMC free article] [PubMed] [Google Scholar]
- 49. Ozturk A, Smith SA, Gordon‐Lipkin EM, Harrison DM, Shiee N, Pham DL et al (2010) MRI of the corpus callosum in multiple sclerosis: association with disability. Mult Scler 16:166–177. [DOI] [PMC free article] [PubMed] [Google Scholar]
- 50. Peterson JW, Bo L, Mork S, Chang A, Trapp BD (2001) Transected neurites, apoptotic neurons, and reduced inflammation in cortical multiple sclerosis lesions. Ann Neurol 50:389–400. [DOI] [PubMed] [Google Scholar]
- 51. Pirko I, Lucchinetti CF, Sriram S, Bakshi R (2007) Gray matter involvement in multiple sclerosis. Neurology 68:634–642. [DOI] [PubMed] [Google Scholar]
- 52. Pittock SJ, Lucchinetti CF (2007) The pathology of MS: new insights and potential clinical applications. Neurologist 13:45–56. [DOI] [PubMed] [Google Scholar]
- 53. Pomeroy IM, Jordan EK, Frank JA, Matthews PM, Esiri MM (2008) Diffuse cortical atrophy in a marmoset model of multiple sclerosis. Neurosci Lett 437:121–124. [DOI] [PMC free article] [PubMed] [Google Scholar]
- 54. Rao SM, Reingold SC, Ron MA, Lyon‐Caen O, Comi G (1993) Workshop on neurobehavioral disorders in multiple sclerosis. Diagnosis, underlying disease, natural history, and therapeutic intervention, Bergamo, Italy, June 25–27, 1992. Arch Neurol 50:658–662. [DOI] [PubMed] [Google Scholar]
- 55. Rasmussen S, Wang Y, Kivisakk P, Bronson RT, Meyer M, Imitola J, Khoury SJ (2007) Persistent activation of microglia is associated with neuronal dysfunction of callosal projecting pathways and multiple sclerosis‐like lesions in relapsing‐remitting experimental autoimmune encephalomyelitis. Brain 130(Pt 11):2816–2829. [DOI] [PubMed] [Google Scholar]
- 56. Reeves TM, Phillips LL, Povlishock JT (2005) Myelinated and unmyelinated axons of the corpus callosum differ in vulnerability and functional recovery following traumatic brain injury. Exp Neurol 196:126–137. [DOI] [PubMed] [Google Scholar]
- 57. Reuss B, Hertel M, Werner S, Unsicker K (2000) Fibroblast growth factors‐5 and ‐9 distinctly regulate expression and function of the gap junction protein connexin43 in cultured astroglial cells from different brain regions. Glia 30:231–241. [PubMed] [Google Scholar]
- 58. Riva MA, Gale K, Mocchetti I (1992) Basic fibroblast growth factor mRNA increases in specific brain regions following convulsive seizures. Brain Res Mol Brain Res 15:311–318. [DOI] [PubMed] [Google Scholar]
- 59. Rocca MA, Absinta M, Valsasina P, Ciccarelli O, Marino S, Rovira A et al (2009) Abnormal connectivity of the sensorimotor network in patients with MS: a multicenter fMRI study. Hum Brain Mapp 30:2412–2425. [DOI] [PMC free article] [PubMed] [Google Scholar]
- 60. Skaper SD, Facci L, Culbert AA, Evans NA, Chessell I, Davis JB, Richardson JC (2006) P2X(7) receptors on microglial cells mediate injury to cortical neurons in vitro. Glia 54:234–242. [DOI] [PubMed] [Google Scholar]
- 61. Stadelmann C, Albert M, Wegner C, Bruck W (2008) Cortical pathology in multiple sclerosis. Curr Opin Neurol 21:229–234. [DOI] [PubMed] [Google Scholar]
- 62. Stadelmann C, Bruck W (2008) Interplay between mechanisms of damage and repair in multiple sclerosis. J Neurol 255(Suppl. 1):12–18. [DOI] [PubMed] [Google Scholar]
- 63. Storch MK, Bauer J, Linington C, Olsson T, Weissert R, Lassmann H (2006) Cortical demyelination can be modeled in specific rat models of autoimmune encephalomyelitis and is major histocompatability complex (MHC) haplotype‐related. J Neuropathol Exp Neurol 65:1137–1142. [DOI] [PubMed] [Google Scholar]
- 64. Tiwari‐Woodruff S, Morales LB, Lee R, Voskuhl RR (2007) Differential neuroprotective and antiinflammatory effects of estrogen receptor (ER)alpha and ERbeta ligand treatment. Proc Natl Acad Sci U S A 104:14813–14818. [DOI] [PMC free article] [PubMed] [Google Scholar]
- 65. van Horssen J, Brink BP, de Vries HE, van der Valk P, Bo L (2007) The blood‐brain barrier in cortical multiple sclerosis lesions. J Neuropathol Exp Neurol 66:321–328. [DOI] [PubMed] [Google Scholar]
- 66. Vercellino M, Merola A, Piacentino C, Votta B, Capello E, Mancardi GL et al (2007) Altered glutamate reuptake in relapsing‐remitting and secondary progressive multiple sclerosis cortex: correlation with microglia infiltration, demyelination, and neuronal and synaptic damage. J Neuropathol Exp Neurol 66:732–739. [DOI] [PubMed] [Google Scholar]
- 67. Vercellino M, Plano F, Votta B, Mutani R, Giordana MT, Cavalla P (2005) Grey matter pathology in multiple sclerosis. J Neuropathol Exp Neurol 64:1101–1107. [DOI] [PubMed] [Google Scholar]
- 68. Voskuhl RR, Peterson RS, Song B, Ao Y, Morales LB, Tiwari‐Woodruff S, Sofroniew MV (2009) Reactive astrocytes form scar‐like perivascular barriers to leukocytes during adaptive immune inflammation of the CNS. J Neurosci 29:11511–11522. [DOI] [PMC free article] [PubMed] [Google Scholar]
- 69. Warlop NP, Fieremans E, Achten E, Debruyne J, Vingerhoets G (2008) Callosal function in MS patients with mild and severe callosal damage as reflected by diffusion tensor imaging. Brain Res 1226:218–225. [DOI] [PubMed] [Google Scholar]
- 70. Wegner C, Esiri MM, Chance SA, Palace J, Matthews PM (2006) Neocortical neuronal, synaptic, and glial loss in multiple sclerosis. Neurology 67:960–967. [DOI] [PubMed] [Google Scholar]
- 71. Wensky AK, Furtado GC, Marcondes MC, Chen S, Manfra D, Lira SA et al (2005) IFN‐gamma determines distinct clinical outcomes in autoimmune encephalomyelitis. J Immunol 174:1416–1423. [DOI] [PubMed] [Google Scholar]
- 72. Whittemore SR, Ebendal T, Larkfors L, Olson L, Seiger A, Stromberg I, Persson H (1986) Development and regional expression of beta nerve growth factor messenger RNA and protein in the rat central nervous system. Proc Natl Acad Sci U S A 83:817–821. [DOI] [PMC free article] [PubMed] [Google Scholar]
- 73. Zhu B, Luo L, Moore GR, Paty DW, Cynader MS (2003) Dendritic and synaptic pathology in experimental autoimmune encephalomyelitis. Am J Pathol 162:1639–1650. [DOI] [PMC free article] [PubMed] [Google Scholar]
- 74. Ziehn MO, Avedisian AA, Tiwari‐Woodruff S, Voskuhl RR (2010) Hippocampal CA1 atrophy and synaptic loss during experimental autoimmune encephalomyelitis, EAE. Lab Invest 90:774–786. [DOI] [PMC free article] [PubMed] [Google Scholar]
Associated Data
This section collects any data citations, data availability statements, or supplementary materials included in this article.
Supplementary Materials
Figure S1. Representative sections of spinal cord, hippocampus and cerebellum from normal PLP_EGFP (green) C57Bl/6 mice stained with DAPI (red). Abbreviations: DC = dorsal column; GM = gray matter; LF = lateral funiculus; AF = anterior funiculus; CC = corpus callosum; CA2 = Cornu Ammonis part 2 of hippocampus; DG = dentate gyrus; fi = fimbrae; WM = white matter; ML = molecular layer; GCL = granule cell layer.
Figure S2. (A) Representative brain sections from PLP_EGFP group were immunostained with MBP (red) and imaged at 10× magnification. A decrease in PLP_EGFP cells and myelin intensity was seen in early and late EAE. (B) Quantification of myelin intensity as measured by MBP immunostaining showed a more significant decrease in late EAE as compared to early EAE (*P < 0.05; **P < 0.001 ANOVA, n = 5).
Figure S3. Representative sections of cortical layers from normal and late EAE mice stained with CD45 (red) and DAPI (blue). CD45+ microglia from EAE cortex were ramified with multiple processes as compared to microglia from normal cortex.
Figure S4. (A) Representative sections of cortical layers from late PLP_EGFP EAE mice stained with MBP (red) and DAPI (blue) and images at 10× magnification. Many intracortical and leukocortical lesions are visible. Most of the lesions are devoid of myelin staining and a few lesions are also devoid of infiltrating cells (DAPI‐; white arrows and white dashed squares). (B) Detailed view was obtained from the sections by imaging them at 40× magnification. There is a significant decrease in PLP_EGFP cell numbers in the lesioned area. (C) High magnification confocal images (40×) were taken to identify the presence of axon damage in and around EAE cortical lesions. Similar area from a normal brain section had mostly myelinated axons with more MBP staining (red) and very few visible NF200+ (green) axons. In cortical lesions of early EAE, many axons were demyelinated and increased NF200+ axons were visible. By late EAE, more of the axons were demyelinated, disrupted, incoherent, swollen and transected (white stars).
Supporting info item
Supporting info item
Supporting info item
Supporting info item