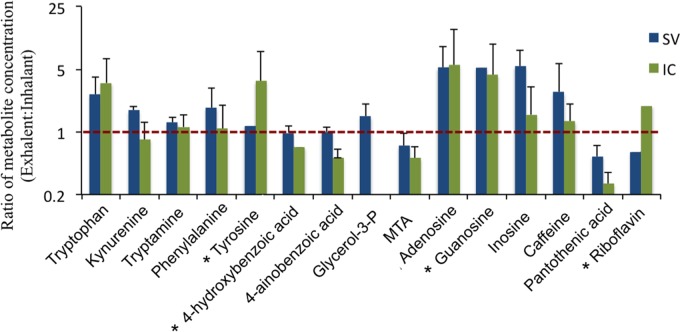
Figure 4. Average (±SD) ratio of metabolite concentration of exhalent and inhalant seawater samples (exhalent/inhalant) for each sponge species (IC, Ircinia campana; SV, Spheciospongia vesparium).
Note that the y-axis is presented as a log2 scale to highlight equivalent concentrations (ratio = 1; red dashed line). No significant differences were observed between the concentrations of metabolites in the inhalant and exhalent seawater samples. Asterisks indicate metabolites that were detected in only one or two replicates of the inhalant samples resulting in no standard deviation for that metabolite ratio. MTA, 5′-methylthioadenosine. n = 3.

