

Abstract
Objective
The objective of this study was to evaluate whether increased serum 25OHD3 concentrations, in response to calcium plus vitamin D (CaD) supplementation, are associated with improved lipids in postmenopausal women.
Methods
The parent trial was a double-blinded, randomized, placebo-controlled, parallel group trial designed to test the effects of CaD supplementation (1,000 mg of elemental calcium plus 400 IU of vitamin D3 daily) versus placebo in postmenopausal women. Women were enrolled between 1993 and 1998 from the general community including multiple sites in the U.S. This cohort included 300 White, 200 African American, and 100 Hispanic participants randomly selected from the WHI CaD trial. Serum 25OHD3 and lipids (fasting plasma triglycerides [TG], high density lipoprotein cholesterol [HDL-C], and calculated low density lipoprotein cholesterol [LDL-C]) were assessed prior to CaD randomization and again post-randomization.
Results
There was a 38% increase in mean serum 25OHD3 concentrations after two years (95% CI 1.29–1.47, p< 0.001) for women randomized to CaD (24.3ng/mL post randomization mean) compared with placebo (18.2 ng/mL). Women randomized to CaD had a 4.46 mg/dL mean decrease in LDL-C (p=0.03). Higher concentrations of 25OHD3, were associated with higher HDL-C (p=0.003) along with lower LDL-C and TG levels (p=0.02 and p<0.001, respectively).
Conclusions
Supplemental CaD significantly increased concentrations of 25OHD3 and decreased LDL-C. Women with higher 25OHD3 had more favorable lipid profiles, including increased HDL-C as well as lower LDL-C and TG. These results support the hypothesis that higher concentrations of 25OHD3, in response to CaD supplementation, are associated with improved LDL-C.
Keywords: Vitamin D, Cholesterol, Coronary Artery Disease, Menopause, Low Density Lipoprotein Cholesterol
INTRODUCTION
Since the association between dyslipidemia and cardiovascular disease (CVD) in women has been established [1], there have been an increasing number of studies investigating calcium and vitamin D (CaD) and their effect on lipid concentrations [2–4]. Nearly a dozen randomized controlled trails (RCTs) have evaluated the association between supplemental calcium and the concentration of circulating cholesterol, generating inconsistent results. While the results of one study from New Zealand [5] revealed a beneficial effect of calcium citrate on the lipid profile, 4 studies showed no significant effect of calcium carbonate on cholesterol concentrations [6–9].
Reports evaluating the effects of vitamin D supplementation on plasma 25OHD3 concentrations, CHD, and CHD risk factors (such as lipid parameters) from RCTs are clearly lacking. The results of a few early studies, analyzing the effects of vitamin D3 compared with placebo, found no significant changes in lipid concentrations in the intervention arm [10,11]. One RCT of 464 postmenopausal women (PM) even reported that daily supplementation of 300 IU of vitamin D3 was associated with a significant increase in LDL-C and triglyceride (TG) along with a significant decrease in HDL-C and HDL:LDL-C ratio after 3 years of follow-up [12]. The results of another recent study also suggested that vitamin D may not improve lipid levels [13].
To evaluate whether calcium and vitamin D oral supplementation and the subsequent achievement of higher plasma 25OHD concentrations affect lipid parameters, data from this randomized, double-blinded, placebo controlled (PC) CaD cohort of the WHI and the subsample with measured 25OHD3 concentrations were evaluated pre and post-randomization. The objectives of this study were to evaluate the relationship between supplemental CaD, serum 25OHD3, and plasma cholesterol within the context of a RCT.
METHODS
Participant selection and randomization
The WHI CaD trial was a double-blinded, randomized, PC, parallel group study designed to test the effects of CaD supplementation on hip fracture risk as the primary outcome along with total fractures and colorectal cancer in PM. Participants enrolled in the WHI Dietary Modification trial, WHI Hormone Therapy (HT) trials, or both were invited to join the CaD trial at their first or second annual follow-up visit. PM 50 to 79 years of age who met the eligibility criteria joined the WHI HT and/or dietary modification trials between 1993 and 1998. They were invited to join the double-blinded CaD trial a year later. Of those enrolling, 91% joined the CaD trial at the first annual visit and 9% the following year. Women were recruited from the general community from multiple sites in the U.S.
Details of the design, recruitment, randomization, data collection, intervention, and outcomes ascertainment procedures in the WHI CaD trial have been published previously [14,15]. The eligibility criteria to be enrolled in CaD included many safety parameters (e.g., no previous hypercalcemia or renal calculi) and no competing risk indicators (e.g., no medical condition associated with survival of less than three years). Women were able to participate in CaD even if they were taking their own supplemental calcium and/or vitamin D, provided their personal vitamin D supplementation did not exceed 600 IU/d (later changed to 1000 IU/d). Study participants were randomized to calcium carbonate (with 1,000 mg of elemental calcium) combined with 400 IU of vitamin D3 per day, taken in two divided doses daily. The remaining women were randomized to receive one oral placebo pill twice per day.
Biomarker subsample
Eligible participants included all White (n=1048; 509 active and 539 placebo), African-American (n=458; 227 active and 231 placebo), and Hispanic women (n=247; 128 active and 119 placebo) in the 6% sub-sample of the CaD trial who have available serum for 25OHD3 testing at both the Year 1 (prior to CaD randomization) and Year 3 (after randomization) visits (see figure 1). The subsample was selected randomly from these totals to arrive at the final sample size of 600, which included 300 White participants, 200 African-American participants, and 100 Hispanic participants. Equal numbers for each group were selected from the intervention and placebo arms.
Figure 1.
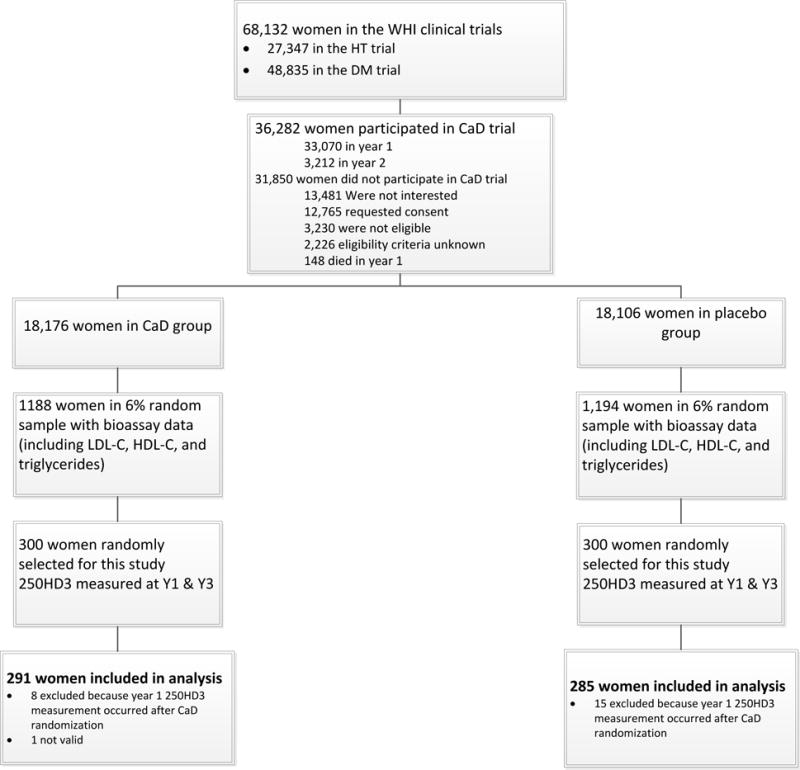
This figure outlines the eligibility and selection process, along with the inclusion and exclusion determination, for the women in the CaD trial.
Biomarker Analysis
Data on blood lipids were assessed prior to CaD randomization (pre-randomization, both at baseline [B] and at year 1 [Y1]) and after randomization (post-randomization, both at year 3 [Y3] and at year 6 [Y6]), see figure 2 [16]. Blood samples were obtained from frozen stored samples (at −70°C) and assayed at Medical Research Laboratories Inc (Highland Heights, KY). Valid 25OHD3 measurements were obtained on 576 participants at year 1 (prior to CaD randomization) and year 3 (after CaD randomization), see figure 2. The 25OHD3 assay was performed on frozen stored serum samples using the DiaSorin LIASON chemiluminescence (DiaSorin, Stillwater, MN) method. In this study, the intra-class correlation of 25OHD3 for 60 blind duplicates pairs was 0.99.
Figure 2.
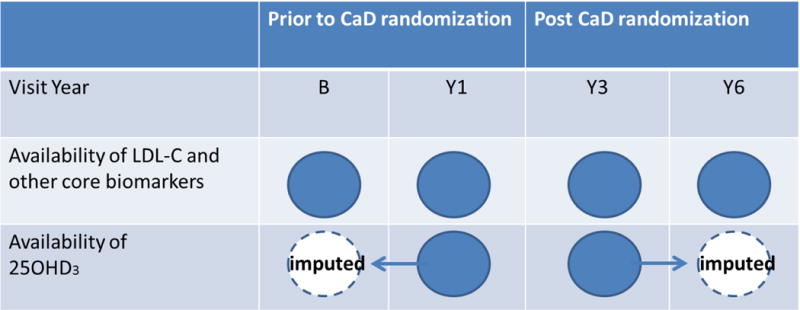
This figure illustrates the availability of core biomarkers and 25OHD3 for the analytic sample (n=576) by visit year. 25OHD3 was not measured at baseline and Y6, so are 100% missing by design. Baseline and Y6 values of 25OHD3 were imputed by carrying the post (pre)-randomization measures forward (backwards) and by multiple imputation. The mediation analysis included 25OHD3 as a time-dependent variable and used both measured and imputed values of 25OHD3.
Statistical Methods
To determine if CaD had a significant effect (see figure 3A) on low-density lipoprotein cholesterol (LDL-C) and determine whether the effect of CaD was mediated through higher concentrations of 25OHD3 (see figure 3B), we evaluated whether: (1) CaD significantly increased 25OHD3 (figure 3, path a): (2) CaD had a significant effect on LDL-C (figure 3, path c): (3) the effect of CaD on LDL-C was attenuated after adjustment for 25OHD3 (figure 3, path c′). (4) 25OHD3 was significantly associated with LDL-C (figure 3, path b).
Figure 3.
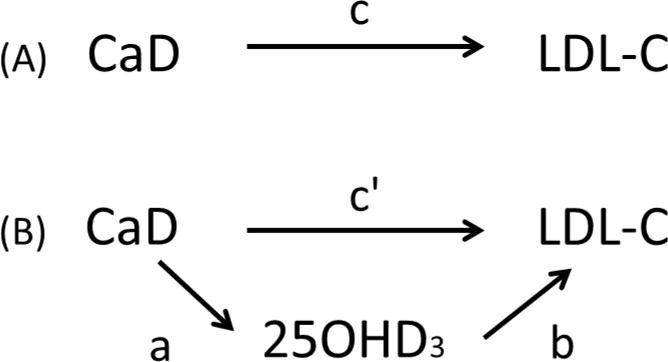
(A) Total effect of CaD on LDL-C; path c. (B) CaD is hypothesized to lower LDL-C through 25OHD3. It is believed that randomization to CaD will increase circulating levels of 25OHD3; path a. Consequently, higher levels of 25OHD3, the mediating variable, will be associated with lower levels of LDL-C; path b. CaD will also exert a direct effect on LDL-C after adjustment for paths a and b; path c′.
Step (2) establishes that there is an effect to be mediated. To increase power and confirm that CaD lowers LDL-C [14], lipid measures at baseline and years 1, 3 and 6, were fit in a repeated measures model with an unstructured covariance matrix. Hsia [14] did not find a significant CaD effect for HDL-C or TG when using the complete 6% subsample. While we also statistically tested these models on our data (a subsample of Hsia’s data), we did not expect to find a significant effect prospectively, but were interested to see if these lipids were associated with 25OHD3. The distribution of TG was skewed so TG was log- transformed for our analyses. Step (1) was addressed by fitting a second set of models, with 25OHD3 as the response (log-transformed because of skewness). Ratios of mean 25OHD3 (active divided by placebo) for the main effect of CaD and by subgroup are reported. Statistical significance of subgroups was based on tests of interactions. Steps (3) and (4) were addressed by adding 25OHD3, as a time-dependent variable, to the model in Step (2). Since 25OHD3 was not measured at baseline or Y6, and are 100% missing by design (see figure 2), missing 25OHD3 values were imputed by carrying the post (pre)-randomization measures forward (backwards), respectively. As a secondary analysis, multiple imputation (n=10) was performed by constructing a multivariate (25OHD3 and LDL-C) longitudinal model (B, Y1, Y3 and Y6) with time-dependent fixed effects for CaD randomization, vitamin D supplementation, race/ethnicity, and random effects (random intercepts for CaD randomization period: pre or post). To mitigate potential confounding between 25OHD3 and lipids; age, race/ethnicity, body mass index, smoking status, history of high blood cholesterol, diabetes mellitus, prior HT use, physical activity, total calcium intake, the HT trial randomization arm, and the dietary modification trial randomization arm were included as covariates. The covariates were included in all steps (1 to 4) to allow for meaningful comparisons between models.
To ensure that 25OHD3 and lipids were fit on the appropriate scale for step (4), multivariable adjusted Generalized Additive Mixed Model (GAMM) estimates of the mean LDL-C, HDL-C, and TG as a smoothed function of 25OHD3 were fit using lipids and 25OHD3 measurements at Year 1 and Year 3. Significance tests for the interaction between 25OHD3 × visit year, and 25OHD3 × CaD, were conducted to determine whether the relationships between 25OHD3 and lipids remained unchanged regardless of visit year or treatment assignment. The smoothness of each spline fit was chosen objectively by generalized cross-validation.
The threshold for nominal significance was two-sided (p<0.05) without adjustment for multiple testing. Statistical analyses were performed using SAS statistical software (version 9; SAS Institute, Cary, North Carolina), generalized additive models and corresponding figures were computed with R (version 2.11; R Development Core Team (2010) – http://www.R-project.org).
RESULTS
Baseline Characteristics
Of the 600 women in the CaD trial subsample, 24 were excluded from the analyses as 1 participant did not have valid 25OHD3 data and the remaining 23 had their visit 1 blood drawn after CaD randomization (see figure 1). Among the 576 women with valid data, 291 (50.5%) were receiving CaD and 285 (49.5%) were receiving placebo. The mean age (± standard deviation [SD]) at baseline was 61.8 (±6.7) years. The women on average were 14.6 (±9.7) years from menopause. The mean body mass index (BMI) and waist circumference were 30.5 (±6.6) kg/m2 and 90.7 (±13.9) cm, respectively. The mean systolic blood pressure was 130.1 (±16.5) mmHg and mean lipids were 124.5 (±33.1) mg/dL, 58.6 (±15.0) dL and 149.2 (±71.2) mg/dL for LDL-C, HDL-C and triglycerides, respectively. Further demographics and comparisons between treatment and placebo groups can be seen in table 1. No significant differences were seen in baseline characteristics between those on CaD versus placebo.
Table 1.
Baseline Characteristics of Women in the CaD Trial Subsample (n= 576) by Randomization Group.
| Active (N=291) |
Placebo (N=285) |
P-Value1 | |||
|---|---|---|---|---|---|
| N | % | N | % | ||
| Race/ethnicity | 0.98 | ||||
| White | 145 | 49.8 | 143 | 50.2 | |
| Black | 96 | 33.0 | 95 | 33.3 | |
| Hispanic | 50 | 17.2 | 47 | 16.5 | |
| Smoking status | 0.92 | ||||
| Never | 153 | 52.9 | 142 | 51.3 | |
| Past | 115 | 39.8 | 114 | 41.2 | |
| Current | 21 | 7.3 | 21 | 7.6 | |
| Alcohol consumption | >0.99 | ||||
| Non drinker | 146 | 50.3 | 143 | 50.5 | |
| ≤ 1 drink/day | 125 | 43.1 | 122 | 43.1 | |
| >1 drink/day | 19 | 6.6 | 18 | 6.4 | |
| History of high cholesterol requiring pills | 40 | 13.7 | 26 | 9.1 | 0.08 |
| Treated diabetes (pills or shots) | 23 | 7.9 | 22 | 7.7 | 0.94 |
| Antihypertensive medication use at Baseline | 99 | 34.0 | 84 | 29.5 | 0.24 |
| HT use status | 0.64 | ||||
| Never used | 172 | 59.1 | 166 | 58.2 | |
| Past user | 51 | 17.5 | 44 | 15.4 | |
| Current user | 68 | 23.4 | 75 | 26.3 | |
| Supplemental Vitamin D | 117 | 40.2 | 117 | 41.1 | 0.84 |
| Season | 0.48 | ||||
| Winter | 47 | 16.4 | 57 | 20.5 | |
| Spring | 98 | 34.3 | 81 | 29.1 | |
| Summer | 71 | 24.8 | 70 | 25.2 | |
| Fall | 70 | 24.5 | 70 | 25.2 | |
| HT Arm | 0.88 | ||||
| Not randomized | 105 | 36.1 | 111 | 38.9 | |
| CEE | 38 | 13.1 | 31 | 10.9 | |
| CEE Placebo | 36 | 12.4 | 36 | 12.6 | |
| CEE+MPA | 58 | 19.9 | 59 | 20.7 | |
| CEE+MPA Placebo | 54 | 18.6 | 48 | 16.8 | |
| DM treatment assignment | 0.90 | ||||
| Not randomized | 116 | 39.9 | 110 | 38.6 | |
| Comparison | 113 | 38.8 | 110 | 38.6 | |
| Intervention | 62 | 21.3 | 65 | 22.8 | |
| Mean | (SD) | Mean | (SD) | P-Value | |
|
| |||||
| Age at screening | 62.0 | (6.6) | 61.7 | (6.8) | 0.60 |
| Years since menopause | 14.8 | (9.6) | 14.3 | (9.7) | 0.57 |
| Body-mass index (kg/m2), baseline | 30.4 | (6.7) | 30.6 | (6.6) | 0.72 |
| Waist circumference (cm), baseline | 90.7 | (13.8) | 90.8 | (14.0) | 0.87 |
| Systolic BP (mm Hg), baseline | 130.8 | (16.3) | 129.5 | (16.7) | 0.32 |
| Physical activity2 (total MET hours/week) | 9.9 | (12.4) | 9.6 | (11.5) | 0.75 |
| Sun exposure (Langley) | 376.2 | (56.0) | 380.3 | (53.2) | 0.38 |
| Total Calcium (mg) | 1020.9 | (618.5) | 1090.8 | (696.9) | 0.21 |
| Supplemental Vitamin D(IU) | 153.5 | (205.8) | 160.8 | (214.1) | 0.68 |
| Dietary Vitamin D(IU) | 174.4 | (131.6) | 171.9 | (118.9) | 0.82 |
| Total Vitamin D (IU) | 327.3 | (244.7) | 334.2 | (250.2) | 0.74 |
| Total Vitamin D (IU) at Year 1 | 304.3 | (229.0) | 341.7 | (268.3) | 0.17 |
| 25OHD(ng/mL) at Year 1 | 20.1 | (10.6) | 20.8 | (10.9) | 0.44 |
| LDL-C (mg/dL) at Year 1 | 123.9 | (32.2) | 125.0 | (34.0) | 0.68 |
| HDL-C(mg/dL) | 58.5 | (15.1) | 58.8 | (14.9) | 0.77 |
| Triglycerides at Year 1 | 150.4 | (70.5) | 147.9 | (72.1) | 0.67 |
Test of association based Chi-squared test (categorical variables) or t-test (continuous variables).
Expenditure of energy from recreational physical activity (includes walking, mild, moderate and strenuous physical activity).
As 25OHD3 is the exposure variable of interest, we provide table 2, to show what variables 25OHD3 is associated. When analyzing the baseline characteristics by LDL-C concentrations prior to randomization, broken into quartiles, several findings were identified across the range of 25OHD3 concentrations. For example, 25OHD3 concentration was inversely associated with being a current smoker (p < 0.001). African-American race was a risk factor for decreased 25OHD3, White race for increased 25OHD3, and Hispanic ethnicity had no influence. Concentrations of 25OHD3 were negatively associated with BMI (p < 0.001) while being positively associated with the expenditure of energy from recreational physical activity (p < 0.001). Also see table 3, for the baseline characteristics of women in the CaD trial subsample by quartiles of LDL-C (mg/dL) at Year 1.
Table 2.
Baseline Characteristics of Women in the CaD Trial Subsample (n= 576) by Quartiles of 25OHD (ng/mL) at Year 1 (prior to CaD randomization).
| ≥26 | 19.2–<26 | 12.6–<19.2 | < 12.6 | P-Value1 | |||||
|---|---|---|---|---|---|---|---|---|---|
| N | % | N | % | N | % | N | % | ||
| Race/ethnicity | <0.001 | ||||||||
| White | 106 | 71.6 | 83 | 58.0 | 60 | 42.3 | 39 | 27.3 | |
| Black | 25 | 16.9 | 30 | 21.0 | 57 | 40.1 | 79 | 55.2 | |
| Hispanic | 17 | 11.5 | 30 | 21.0 | 25 | 17.6 | 25 | 17.5 | |
| Smoking status | <0.001 | ||||||||
| Never | 70 | 47.6 | 80 | 56.7 | 77 | 56.2 | 68 | 48.2 | |
| Past | 73 | 49.7 | 57 | 40.4 | 47 | 34.3 | 52 | 36.9 | |
| Current | 4 | 2.7 | 4 | 2.8 | 13 | 9.5 | 21 | 14.9 | |
| Alcohol consumption | 0.82 | ||||||||
| Non drinker | 75 | 50.7 | 66 | 46.2 | 66 | 47.1 | 82 | 57.7 | |
| ≤ 1 drink/day | 63 | 42.6 | 66 | 46.2 | 61 | 43.6 | 57 | 40.1 | |
| >1 drink/day | 10 | 6.8 | 11 | 7.7 | 13 | 9.3 | 3 | 2.1 | |
| History of high cholesterol requiring pills | 12 | 8.1 | 15 | 10.5 | 18 | 12.7 | 21 | 14.7 | 0.12 |
| Treated diabetes (pills or shots) | 8 | 5.4 | 6 | 4.2 | 14 | 9.9 | 17 | 11.9 | 0.21 |
| Antihypertensive medication use at Baseline | 36 | 24.3 | 43 | 30.1 | 51 | 35.9 | 53 | 37.1 | 0.31 |
| HT Use Status | 0.03 | ||||||||
| Never used | 79 | 53.4 | 72 | 50.3 | 87 | 61.3 | 100 | 69.9 | |
| Past user | 26 | 17.6 | 23 | 16.1 | 29 | 20.4 | 17 | 11.9 | |
| Current user | 43 | 29.1 | 48 | 33.6 | 26 | 18.3 | 26 | 18.2 | |
| Supplemental Vitamin D | 87 | 58.8 | 64 | 44.8 | 52 | 36.6 | 31 | 21.7 | <0.001 |
| Season | <0.001 | ||||||||
| Winter | 21 | 14.2 | 37 | 25.9 | 37 | 26.1 | 41 | 28.7 | |
| Spring | 35 | 23.6 | 34 | 23.8 | 33 | 23.2 | 41 | 28.7 | |
| Summer | 54 | 36.5 | 44 | 30.8 | 35 | 24.6 | 34 | 23.8 | |
| Fall | 38 | 25.7 | 28 | 19.6 | 37 | 26.1 | 27 | 18.9 | |
| HT arm2 | 0.06 | ||||||||
| Not randomized | 60 | 40.5 | 55 | 38.5 | 51 | 35.9 | 50 | 35.0 | |
| CEE | 14 | 9.5 | 13 | 9.1 | 24 | 16.9 | 18 | 12.6 | |
| CEE Placebo | 13 | 8.8 | 18 | 12.6 | 20 | 14.1 | 21 | 14.7 | |
| CEE+MPA | 37 | 25.0 | 32 | 22.4 | 27 | 19.0 | 21 | 14.7 | |
| CEE+MPA Placebo | 24 | 16.2 | 25 | 17.5 | 20 | 14.1 | 33 | 23.1 | |
| DM treatment assignment3 | |||||||||
| Not randomized | 56 | 37.8 | 59 | 41.3 | 54 | 38.0 | 57 | 39.9 | 0.45 |
| Comparison | 61 | 41.2 | 52 | 36.4 | 57 | 40.1 | 53 | 37.1 | |
| Intervention | 31 | 20.9 | 32 | 22.4 | 31 | 21.8 | 33 | 23.1 | |
| Mean | (SD) | Mean | (SD) | Mean | (SD) | Mean | (SD) | P-Value | |
|
| |||||||||
| Age at screening | 62.6 | (6.5) | 62.2 | (6.6) | 61.9 | (6.8) | 60.7 | (6.7) | 0.20 |
| Years since menopause | 14.5 | (9.5) | 14.1 | (8.9) | 15.0 | (10.5) | 14.6 | (9.7) | 0.45 |
| Body-mass index (kg/m2), baseline | 28.7 | (6.5) | 29.8 | (5.8) | 31.4 | (6.3) | 32.1 | (7.4) | <0.001 |
| Waist circumference (cm), baseline | 87.3 | (12.5) | 90.2 | (14.1) | 92.6 | (13.1) | 93.0 | (15.0) | 0.55 |
| Systolic BP (mm Hg), baseline | 126.0 | (17.0) | 129.9 | (15.2) | 132.0 | (15.9) | 132.8 | (17.2) | 0.03 |
| Physical activity4 (total MET hours/week) | 15.7 | (16.0) | 8.1 | (8.4) | 8.1 | (11.2) | 7.1 | (8.8) | <0.001 |
| Sunlight exposure (Langley) | 370.2 | (58.4) | 388.6 | (58.7) | 376.3 | (53.0) | 376.8 | (45.4) | 0.42 |
| Total Calcium (mg) | 1236.1 | (698.5) | 1105.2 | (548.9) | 1058.8 | (736.8) | 802.7 | (554.8) | <0.001 |
| Total Vitamin D (IU) | 419.5 | (265.2) | 361.3 | (244.4) | 311.8 | (219.6) | 221.3 | (212.6) | <0.001 |
| Supplemental Vitamin D(IU) | 235.9 | (227.7 | 184.7 | (228.9) | 129.8 | (180.8) | 75.0 | (157.6) | <0.001 |
| Dietary Vitamin D(IU) | 183.1 | (120.0) | 182.6 | (121.6) | 181.1 | (125.3) | 144.3 | (131.9) | 0.02 |
P-value adjusted for age, race/ethnicity, BMI, smoking, HT trial arm, and DM trial arm.
P-value from a 3-df test of whether there is an association between HT arms and 25OHD.
P-value from a 1-df test of whether there is an association between DM arms and 25OHD.
Expenditure of energy from recreational physical activity (includes walking, mild, moderate and strenuous physical activity).
Table 3.
Baseline Characteristics of Women in the CaD Trial Subsample (n= 576) by Quartiles of LDL-C(mg/dL) at Year 1 (prior to CaD randomization).
| ≥146 | 125–<146 | 101–<125 | < 101 | P-Value1 | |||||
|---|---|---|---|---|---|---|---|---|---|
| N | % | N | % | N | % | N | % | ||
| Race/ethnicity | 0.03 | ||||||||
| White | 76 | 50.7 | 61 | 43.9 | 75 | 53.2 | 71 | 51.4 | |
| Black | 61 | 40.7 | 48 | 34.5 | 36 | 25.5 | 43 | 31.2 | |
| Hispanic | 13 | 8.7 | 30 | 21.6 | 30 | 21.3 | 24 | 17.4 | |
| Smoking status | 0.41 | ||||||||
| Never | 72 | 49.3 | 77 | 56.2 | 87 | 63.0 | 56 | 40.9 | |
| Past | 62 | 42.5 | 48 | 35.0 | 42 | 30.4 | 72 | 52.6 | |
| Current | 12 | 8.2 | 12 | 8.8 | 9 | 6.5 | 9 | 6.6 | |
| Alcohol consumption | 0.77 | ||||||||
| Non drinker | 74 | 49.7 | 80 | 58.0 | 68 | 48.2 | 62 | 45.3 | |
| ≤ 1 drink/day | 66 | 44.3 | 55 | 39.9 | 60 | 42.6 | 65 | 47.4 | |
| >1 drink/day | 9 | 6.0 | 3 | 2.2 | 13 | 9.2 | 10 | 7.3 | |
| History of high cholesterol requiring pills | 26 | 17.3 | 17 | 12.2 | 7 | 5.0 | 15 | 10.9 | 0.07 |
| Treated diabetes (pills or shots) | 10 | 6.7 | 13 | 9.4 | 7 | 5.0 | 14 | 10.1 | 0.17 |
| Antihypertensive medication use at Baseline | 52 | 34.7 | 41 | 29.5 | 35 | 24.8 | 51 | 37.0 | 0.22 |
| HT Use Status | 0.04 | ||||||||
| Never used | 99 | 66.0 | 82 | 59.0 | 82 | 58.2 | 70 | 50.7 | |
| Past user | 24 | 16.0 | 20 | 14.4 | 25 | 17.7 | 24 | 17.4 | |
| Current user | 27 | 18.0 | 37 | 26.6 | 34 | 24.1 | 44 | 31.9 | |
| Supplemental Vitamin D | 57 | 38.0 | 47 | 33.8 | 62 | 44.0 | 66 | 47.8 | 0.11 |
| Season | 0.67 | ||||||||
| Winter | 39 | 26.0 | 32 | 23.0 | 31 | 22.0 | 31 | 22.5 | |
| Spring | 37 | 24.7 | 27 | 19.4 | 40 | 28.4 | 38 | 27.5 | |
| Summer | 40 | 26.7 | 42 | 30.2 | 38 | 27.0 | 44 | 31.9 | |
| Fall | 34 | 22.7 | 38 | 27.3 | 32 | 22.7 | 25 | 18.1 | |
| HT arm2 | |||||||||
| Not randomized | 50 | 33.3 | 61 | 43.9 | 49 | 34.8 | 52 | 37.7 | <0.001 |
| CEE | 17 | 11.3 | 16 | 11.5 | 16 | 11.3 | 19 | 13.8 | |
| CEE Placebo | 29 | 19.3 | 17 | 12.2 | 12 | 8.5 | 14 | 10.1 | |
| CEE+MPA | 20 | 13.3 | 21 | 15.1 | 36 | 25.5 | 39 | 28.3 | |
| CEE+MPA Placebo | 34 | 22.7 | 24 | 17.3 | 28 | 19.9 | 14 | 10.1 | |
| DM treatment assignment3 | |||||||||
| Not randomized | 70 | 46.7 | 47 | 33.8 | 60 | 42.6 | 45 | 32.6 | 0.98 |
| Comparison | 55 | 36.7 | 56 | 40.3 | 49 | 34.8 | 60 | 43.5 | |
| Intervention | 25 | 16.7 | 36 | 25.9 | 32 | 22.7 | 33 | 23.9 | |
| Mean | (SD) | Mean | (SD) | Mean | (SD) | Mean | (SD) | P-Value | |
|
| |||||||||
| Age at screening | 62.4 | (7.2) | 61.8 | (6.5) | 61.5 | (6.2) | 61.6 | (6.8) | 0.23 |
| Years since menopause | 15.7 | (10.7) | 14.1 | (9.4) | 13.5 | (9.1) | 15.1 | (9.1) | 0.25 |
| Body-mass index (kg/m2), baseline | 30.8 | (6.3) | 30.1 | (6.1) | 30.5 | (6.8) | 30.7 | (7.4) | 0.97 |
| Waist circumference (cm), baseline | 91.3 | (12.1) | 90.6 | (13.8) | 90.0 | (13.6) | 90.9 | (16.2) | 0.49 |
| Systolic BP (mm Hg), baseline | 131.0 | (16.9) | 130.1 | (16.4) | 128.2 | (16.2) | 131.0 | (16.5) | 0.84 |
| Physical activity4 (total MET hours/week) | 8.4 | (8.9) | 8.4 | (11.1) | 13.1 | (15.9) | 9.4 | (10.9) | 0.18 |
| Sunlight exposure (Langley) | 370.9 | (49.5) | 378.0 | (57.9) | 376.4 | (53.6) | 386.7 | (56.8) | 0.03 |
| Total Calcium (mg) | 968.7 | (512.2) | 976.0 | (641.6) | 1113.2 | (685.4) | 1148.5 | (764.2) | 0.18 |
| Total Vitamin D (IU) | 306.9 | (216.0) | 285.6 | (224.8) | 354.0 | (271.5) | 378.5 | (267.5) | 0.16 |
| Supplemental Vitamin D(IU) | 134.1 | (189.2) | 128.1 | (195.0) | 167.5 | (210.0) | 204.0 | (238.2) | 0.06 |
| Dietary Vitamin D(IU) | 176.5 | (111.3) | 154.7 | (104.8) | 185.3 | (145.9) | 171.4 | (135.3) | 0.59 |
P-value adjusted for age, race/ethnicity, BMI, smoking, HT trial arm, and DM trial arm.
P-value from a 3-df test of whether there is an association between HT arms and 25OHD.
P-value from a 1-df test of whether there is an association between DM arms and 25OHD.
Expenditure of energy from recreational physical activity (includes walking, mild, moderate and strenuous physical activity).
Effects of CaD on 25OHD3 Concentrations
Women on CaD had significantly increased mean post-intervention 25OHD3 concentrations compared to placebo (24.3 [95% CI: 22.9 – 25.7] versus 18.2 [17.1 – 19.3] ng/mL, respectively) (p < 0.001, see table 4). On average, the mean post-intervention 25OHD3 concentration of women on CaD was 1.38 (95% CI: 1.29–1.47) times higher than women on placebo after covariate adjustment. Women taking CaD supplementation were more than twice as likely (RR = 2.35, 95% CI: 1.71–3.22, p<0.001) to have 25OHD3 concentrations of 30 ng/mL or higher; 35.4% in the intervention arm vs. 15.1% in the control arm. Similarly, women taking CaD supplementation were 1.58 times more likely (1.38–1.82, p<0.001) to have concentrations of 20 ng/mL or higher; 75.6% in the intervention arm vs. 47.7% in the control arm. The effect of CaD on 25OHD3 concentration was not modified by covariates such as age, race/ethnicity, BMI, smoking, alcohol consumption, physical activity, HT use, or seasonal temporality (table 4).
Table 4.
25OHD levels and multivariable adjusted1 25OHD ratios2 (active/placebo) two years after randomization into the CaD Trial.
| Subgroup | Active | Placebo | Ratio (Active/Placebo) | 95% CI | P-value3 | ||
|---|---|---|---|---|---|---|---|
| N | Mean (ng/mL)4 |
N | Mean (ng/mL) |
||||
| Overall | 291 | 24.25 | 285 | 18.21 | 1.38 | (1.29, 1.47) | <0.001 |
|
| |||||||
| Age | 0.16 | ||||||
| 50–59 | 113 | 21.97 | 118 | 15.88 | 1.36 | (1.22, 1.51) | |
| 60–69 | 133 | 25.23 | 130 | 20.39 | 1.31 | (1.19, 1.45) | |
| 70–79 | 45 | 27.67 | 37 | 18.93 | 1.67 | (1.40, 1.98) | |
| Race/ethnicity | 0.41 | ||||||
| White | 145 | 28.37 | 143 | 21.19 | 1.34 | (1.22, 1.48) | |
| Black | 96 | 20.35 | 95 | 14.09 | 1.47 | (1.31, 1.64) | |
| Hispanic | 50 | 21.54 | 47 | 19.27 | 1.32 | (1.12, 1.55) | |
| BMI | 0.82 | ||||||
| <25 | 57 | 30.08 | 57 | 21.34 | 1.35 | (1.16, 1.57) | |
| 25–<30 | 107 | 25.75 | 88 | 19.32 | 1.43 | (1.28, 1.60) | |
| ≥30 | 125 | 20.87 | 136 | 16.50 | 1.35 | (1.22, 1.49) | |
| Smoking | 0.66 | ||||||
| Never | 153 | 23.50 | 142 | 17.98 | 1.40 | (1.28, 1.53) | |
| Past | 115 | 25.98 | 114 | 19.39 | 1.38 | (1.24, 1.53) | |
| Current | 21 | 20.64 | 21 | 14.69 | 1.23 | (0.96, 1.59) | |
| Alcohol | |||||||
| Non drinker | 146 | 22.90 | 143 | 16.91 | 1.41 | (1.28, 1.55) | 0.38 |
| ≤ 1 drink/day | 125 | 25.29 | 122 | 19.13 | 1.38 | (1.25, 1.52) | |
| >1 drink/day | 19 | 28.29 | 18 | 24.51 | 1.19 | (0.91, 1.56) | |
| Physical activity5 | 0.32 | ||||||
| < 2.5 | 90 | 22.06 | 80 | 15.59 | 1.43 | (1.27, 1.60) | |
| 2.5 –<10.75 | 84 | 24.93 | 96 | 17.80 | 1.41 | (1.26, 1.58) | |
| >= 10.75 | 90 | 24.90 | 86 | 21.01 | 1.31 | (1.17, 1.47) | |
| HT randomization | 0.89 | ||||||
| Not Randomized | 105 | 24.62 | 111 | 18.32 | 1.38 | (1.23, 1.54) | |
| CEE | 38 | 22.55 | 31 | 17.47 | 1.39 | (1.15, 1.68) | |
| CEE Placebo | 36 | 23.00 | 36 | 17.79 | 1.46 | (1.21, 1.76) | |
| CEE+MPA | 58 | 25.60 | 59 | 19.12 | 1.41 | (1.21, 1.64) | |
| CEE+MPA placebo | 54 | 24.22 | 48 | 17.67 | 1.29 | (1.10, 1.51) | |
| Season | 0.18 | ||||||
| Winter | 60 | 22.68 | 62 | 15.63 | 1.52 | (1.32, 1.74) | |
| Spring | 74 | 24.29 | 76 | 16.55 | 1.45 | (1.28, 1.65) | |
| Summer | 87 | 24.23 | 77 | 19.89 | 1.27 | (1.12, 1.45) | |
| Fall | 70 | 25.67 | 70 | 20.96 | 1.29 | (1.12, 1.48) | |
| Total vitamin D intake at Baseline | 0.18 | ||||||
| <100 | 49 | 21.73 | 55 | 14.01 | 1.55 | (1.33, 1.82) | |
| 100–<200 | 75 | 22.17 | 60 | 17.84 | 1.33 | (1.16, 1.52) | |
| 200–<400 | 55 | 26.24 | 55 | 17.68 | 1.41 | (1.21, 1.64) | |
| 400–<600 | 68 | 25.86 | 62 | 20.34 | 1.35 | (1.17, 1.55) | |
| ≥ 600 | 36 | 28.63 | 43 | 24.31 | 1.28 | (1.08, 1.53) | |
Adjusted for age, race/ethnicity, body mass index, smoking status, history of high blood cholesterol, diabetes mellitus, prior HT use, physical activity, total calcium intake, HT randomization arm, and DM randomization arm.
From a multivariable adjusted repeated measures regression model of 25OHD, measured at Year 1 (just prior to CaD randomization) and Year 3 (two years post-randomization), regressed on CaD randomization group and covariates. 25OHD was fit on the log transformed scale and ratios (95% CIs) were back-transformed and presented on the original scale.
P-values for subgroup analysis correspond to a 1 degree-of-freedom test for trend for age, BMI and total vitamin D intake, or a k-1 degree of freedom test of interaction for the remaining subgroups; k= the number of categories within a subgroup.
Geometric mean two years after CaD randomization.
Tertiles of expenditure of energy from recreational physical activity (includes walking, mild, moderate and strenuous physical activity).
Effects of CaD on Lipids
Those women randomized to CaD had a 4.46 mg/dL decrease in LDL-C (95% CI: 0.41–8.51) compared to placebo, (p = 0.03; figure 3A path c), see table 5. Of note, there was a non-significant increase in HDL-C (p=0.82) and a non-significant decrease in TG (p=0.21). When 25OHD3 concentration was included in the model, the effect of CaD on LDL-C was attenuated to a 3.24 mg/dL decrease and was no longer significant (p=0.13). Instead, 25OHD3 concentration was a significant predictor of LDL-C (p=0.04), where a 38% increase in 25OHD3 was associated with a 1.28 mg/dL decrease in LDL-C, p = 0.04. The multiple imputation analysis yielded similar results where the effect of CaD was attenuated and no longer significant (p=0.17), while 25OHD3 was significantly associated with LDL-C (p=0.01).
Table 5.
Multivariable adjusted1 effect of CaD2 on LDL-C, with and without 25OHD in the regression model, after randomization into WHI CaD trial.
| Subgroup | Effect of CaD3 | 95%CI | P-value | Effect of 25OHD4 | 95%CI | P-Value |
|---|---|---|---|---|---|---|
| Model 1: Effect of CaD on LDL-C | −4.46 | (−8.51, −0.41) | 0.03 | NA | ||
| Model 2: Effects of CaD and 25OHD5 on LDL-C | −3.24 | (−7.47, 0.98) | 0.13 | −1.28 | (−2.49, −0.07) | 0.04 |
Adjusted for age, race/ethnicity, body mass index, smoking status, history of high blood cholesterol, diabetes mellitus, prior HT use, physical activity, total calcium intake, HT randomization arm, and DM randomization arm.
From a multivariable adjusted repeated measures regression model of LDL-C, measured at Years 0 and 1 (prior to CaD randomization) and Years 3 and 6 (two and five years post-randomization), regressed on CaD randomization group and covariates.
Average post-randomization (Years 3 and 6) effect of CaD on LDL-C (active minus placebo; mg/dL).
Average effect of 25OHD, per 38% increase, on HDL-C (active minus placebo; mg/dL); 25OHD fit on log (base = 1.38) transformed scale.
Model 2 = model 1 covariates + 25OHD. 25OHD was measured at Year 1(just prior to CaD randomization) and Year 3 (two years post-randomization) and included as a time-dependent linear continuous variable in the regression model. The Year 1 measure of 25OHD was used for both pre-randomization values in the regression model. Likewise, the Year 3 measure was used for both post-randomization values.
Association between 25OHD3 and Lipids
Modeling associations at both pre and post randomization visits, serum 25OHD3 concentrations were significantly associated with all 3 cholesterol parameters, see figure 2. More specifically, higher 25OHD3 concentrations were associated with higher HDL-C levels, (p = 0.003). Lower TG was also associated with higher 25OHD3 (p<0.001), but it appeared that a certain threshold value of 25OHD3 was needed (approximately 15ng/ml), before this association was evident. Similarly, higher 25OHD3 was associated with lower LDL-C levels, (p = 0.02). The associations between 25OHD3 and lipids were not modified by visit year (p-interaction > 0.10) or treatment assignment (p-interaction > 0.10).
DISCUSSION
In the current study, women on CaD had a significantly increased mean post-intervention 25OHD3 concentration (by 38%) compared to placebo (24.3 ng/ml versus 18.2 ng/mL, respectively), and those women randomized to CaD had a significant 4.46 mg/dL decrease in LDL-C. The effect of CaD on 25OHD3 was relatively constant across subgroups and no statistically significant interactions were found, although older women, participants with low intake of vitamin D at baseline, and participants whose measurements of 25OHD3 were obtained during winter had the largest absolute increase of 25OHD3 concentrations (table 4). This makes sense, as these populations tend to have lower baseline 25OHD3 concentrations, and would be more likely to respond to supplementation. Non-smokers and women who drink less alcohol also had larger absolute increases in 25OHD3. Furthermore, as the serum concentration of 25OHD3 increased, significant associations were identified with all 3 lipid parameters studied. Serum concentrations of 25OHD3 mediated the effect of CaD on plasma LDL-C, as higher serum 25OHD3 resulted in significantly lower LDL-C concentrations.
Our study is consistent with previous data which suggests vitamin D supplementation is beneficial for lipids, especially LDL, with questionable, little, or no effect on total cholesterol, HDL, and triglycerides [16]. Our study is also consistent with a previous WHI report that detected significant effects of CaD on LDL-C when using the complete 6% subsample of approximately 2400 women [14]. However, restriction to a subgroup (n=1219) [17] may have been underpowered to detect differences. Considering the conflicting results related to calcium and vitamin D in relationship to lipid parameters, and their role as cardiovascular risk factors, little has been done to separate the two and evaluate the individual contributions. It is important to acknowledge that in these studies, calcium and vitamin D could have opposite effects on lipid parameters, along with the presence of other potential confounding factors such as the dosage of supplementation, compliance, type of calcium, and the duration of treatment or follow up. While we do not know definitively how much of a factor the oral calcium played in the lipid findings, the results of previous studies question whether calcium carbonate, used in this trial, has a significant effect on plasma lipids [6–9] compared to calcium citrate [5]. Assessing the effect of combined supplementation on lipid concentrations, therefore, without measuring serum 25OHD3 or calcium concentrations, may not be able to discern a true association between vitamin D supplementation and changes in lipid parameters. Hence, our study measured serum 25OHD3 concentrations and explored the association between 25OHD3, as a mediator, and vitamin D supplementation as well as circulating lipid concentrations.
We were able to control for potential confounding variables and included a direct measurement of serum 25OHD3 both pre and post randomization, allowing for a better assessment of vitamin D’s contribution to the lipid findings, examining concentrations, and by assessing multiple confounders. Therefore, our findings indicate that CaD may have favorable effects on lipids through increasing levels of serum 25OHD3. In addition to a beneficial and significant lowering of LDL-C associated with higher post treatment 25OHD3, we observed that all three lipid parameters were favorably associated with higher 25OHD3 concentrations. Higher concentrations of 25OHD3 were associated with higher concentrations of HDL-C and lower concentrations of LDL-C and TG (after reaching the threshold of approximately 15ng/ml). We did not, however, find that CaD increased HDL-C or lowered TG, which is consistent with previous WHI studies [14]. It is possible that we did not show that CaD raises HDL-C or lowers TG because the associations between 25OHD3 and these 2 lipids are more modest compared to 25OHD3 and LDL-C, as indicated in Figure 2.
Why the results of some studies suggest vitamin D supplementation and/or higher serum concentrations of 25OHD are associated with improved lipid parameters [2,18,19] and some do not [12,20] needs further exploration. The results of a recent study suggest an observational association between higher concentrations of 25OHD3 and more favorable lipid parameters, yet those women who raised their 25OHD3 had an overall worsening cholesterol profile [13]. This could suggest the observational association is due to confounding variables with no prospective benefit to supplementation. The observational results could also be related to the lack of methodological control and range of doses compared to RCTs. Our results suggest a prospective improvement of LDL-C in response to CaD supplementation, which was mediated by increased serum concentrations of 25OHD3. How do we reconcile this result with other studies showing worsening lipid parameters after vitamin D supplementation [12]? One possibility is that women with the greatest increase in 25OHD3 may have been the women most compliant with the CaD study pills and also the women most compliant with HT, for those in the HT arm of the WHI. Since HT significantly lowers LDL and raises HDL, this could be an important factor. The women most compliant with study pills may also have been the women most compliant with lifestyle modifications during follow up, such as increasing physical activity and weight loss, which could have contributed to the greater increase in 25OHD. Another possibility is that because many of our women were on HT, a hypothesized synergistic relationship between vitamin D and estrogen therapy (ET)/HT [21] may be allowing our population, compared to the other prospective studies [12,20], to be seeing a lipid benefit with vitamin D. Clearly this potential synergy between vitamin D and ET/HT needs to be further investigated. The potential synergistic role of CaD also needs to be considered [22].
The Institute of Medicine (IOM) reviewed more than 1,000 studies regarding vitamin D and a range of health outcomes including but not limited to cancer, cardiovascular disease, hypertension, diabetes, the immune system, and reproductive outcomes. The IOM determined that in regard to the non-skeletal health outcomes reviewed, including studies on cardiovascular health, results often were mixed and inconclusive [23,24]. It is also important to interpret with caution the 25OHD and CaD observational literature as confounding variables can easily influence the results and can be difficult to control for. These studies often have risk factors closely connected to the study population which can lead to lower vitamin D as well as CHD, hypercholesterolemia, or other CHD risk factors. In accord with these cautions, the results of a recent study showed an association with baseline 25OHD concentrations and more favorable lipid parameters was not subsequently seen with raising vitamin D levels from < 20 to > 30 ng/ml [13]. Our study, therefore, is unique in that associations between 25OHD3 and LDL-C were consistent with the prospective result of a significant improvement in LDL-C secondary to a post treatment increase in 25OHD3 concentrations. The results of previous studies have suggested that between 18% and 53% of individuals receiving oral vitamin D supplementation (between 2,000 IU/day and 8,000 IU/day) do not raise their serum concentration of 25OHD3 into a normal range [25,26]. For all subgroups of total vitamin D intake at baseline, even those consuming < 100 IU/day, the mean 25OHD3 for women randomized to CaD exceeded 20ng/mL, table 4 (a concentration deemed adequate in the IOM report [23,24]). While previous studies have suggested that vitamin D supplementation is beneficial in regard to improving lipid parameters [2], the current study is helpful in confirming these findings. This population of women who ingested 400 IU/day of vitamin D and 1,000 mg of calcium carbonate had a 6 ng/mL significantly higher 25OHD3 concentration than those on placebo.
Among the women eligible, we selected 600 participants to have 25OHD3 measurements at year 1 and year 3, hence the study was somewhat limited by sample size. While complete data were available to assess the RCT effects of CaD on LDL-C and 25OHD3, imputation was used in the mediation analysis to extrapolate data from year 1 and year 3 to baseline and year 6, respectively. Women were also allowed to take their own vitamin D supplementation, which obviously varied. While these may be viewed as limitations, we followed 25OHD3 concentrations and confirmed through statistical testing the validity of these approaches and methods. There is also a potential for confounding, especially in the observational portion of the study, by variables such as BMI, outdoor physical activity, diet, poor health, and other lifestyle choices such as smoking. In addition to being a prospective, double-blinded, randomized, PC study, a strength included the adjustment for covariates such as age, BMI, season, etc. The inclusion of 25OHD3 measurements, to help explain the prospective association between exposure (CaD supplementation) and outcome parameters (change in lipids), was another major advantage. Given the limitations, it would clearly be advantageous to confirm these findings with additional high quality prospective studies and randomized clinical trials.
Conclusion
We have confirmed that oral CaD (1,000 mg of elemental calcium combined with 400 IU of vitamin D3 per day) results in a significantly increased concentration of 25OHD3 and decreased LDL-C. We also demonstrated that higher serum concentrations of 25OHD3 are significantly associated with improvement in all 3 lipid parameters tested (HDL-C, LDL-C, and TG). These results support the hypothesis that higher concentrations of 25OHD3, in response to CaD supplementation, are associated with improved LDL-C. While further studies are needed to determine whether these findings translate into clinically meaningful results, this should be viewed as a reminder that women at higher risk for 25OHD3 deficiency, should consider supplementation with CaD.
Figure 4.
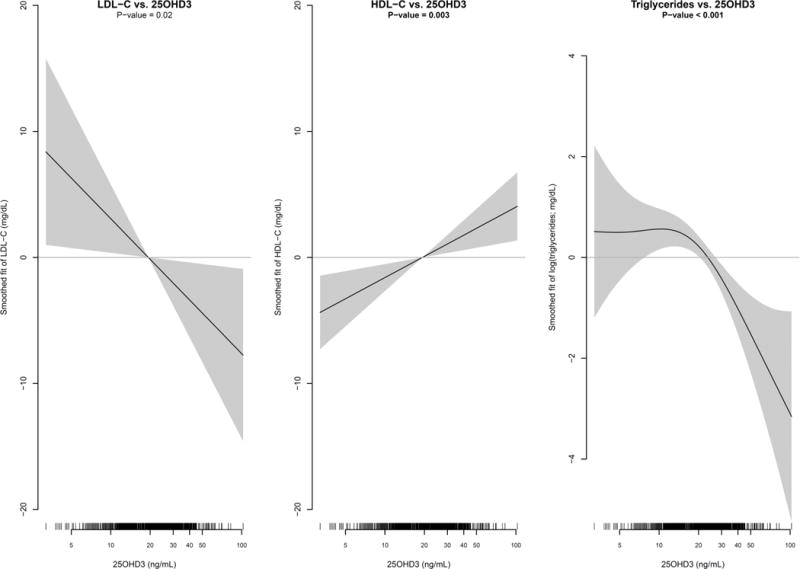
Multivariable adjusted Generalized Additive Mixed Model (GAMM) estimates of the mean LDL-C, HDL-C, and Triglycerides (95% confidence interval in shaded region) as a smoothed function of 25OHD3. Lipids and 25OHD3 measurements at both Year 1 and Year 3 were included in the GAMMs to incorporate both cross-sectional and longitudinal information. GAMMs included an indicator variable for pre/post-CaD randomization visit and were adjusted for age, race/ethnicity, body mass index, smoking status, history of high blood cholesterol, diabetes mellitus, prior HT use, physical activity, total calcium intake, HT randomization arm, DM randomization arm, CaD randomization arm, and CaD randomization × visit interaction. To account for within participant correlation a random intercept was also included. The smoothness of each spline fit was chosen objectively by generalized cross-validation.
Précis.
Oral calcium combined with vitamin D3 significantly increases serum concentration of 25OHD3 and results in an improved lipid profile.
Acknowledgments
The research on which this publication is based was supported by R01 HL083326 (to Dr. Mackey) from the National Heart, Lung, & Blood Institute. The Women’s Health Initiative (WHI) program is funded by the National Heart, Lung, and Blood Institute, National Institutes of Health, U.S. Department of Health and Human Services through contracts HHSN268201100046C, HHSN268201100001C, HHSN268201100002C, HHSN268201100003C, HHSN268201100004C, and HHSN271201100004C. Information about the WHI investigators, their academic centers, the program office, and the clinical coordinating center can be found online at: https://cleo.whi.org/researchers/Documents%20%20Write%20a%20Paper/WHI%20Investigator%20Short%20List.pdf
The ClinicalTrials.gov number for the trial is NCT00000611 (see: http://clinicaltrials.gov/ct2/show/NCT00000611?term=women%27s+health+initiative&rank=5).
Program Office: (National Heart, Lung, and Blood Institute, Bethesda, Maryland) Jacques Rossouw, Shari Ludlam, Dale Burwen, Joan McGowan, Leslie Ford, and Nancy Geller.
Clinical Coordinating Center: (Fred Hutchinson Cancer Research Center, Seattle, WA) Garnet Anderson, Ross Prentice, Andrea LaCroix, and Charles Kooperberg.
Investigators and Academic Centers: (Brigham and Women’s Hospital, Harvard Medical School, Boston, MA) JoAnn E. Manson; (MedStar Health Research Institute/Howard University, Washington, DC) Barbara V. Howard; (Stanford Prevention Research Center, Stanford, CA) Marcia L. Stefanick; (The Ohio State University, Columbus, OH) Rebecca Jackson; (University of Arizona, Tucson/Phoenix, AZ) Cynthia A. Thomson; (University at Buffalo, Buffalo, NY) Jean Wactawski-Wende; (University of Florida, Gainesville/Jacksonville, FL) Marian Limacher; (University of Iowa, Iowa City/Davenport, IA) Robert Wallace; (University of Pittsburgh, Pittsburgh, PA) Lewis Kuller; (Wake Forest University School of Medicine, Winston-Salem, NC) Sally Shumaker.
Women’s Health Initiative Memory Study: (Wake Forest University School of Medicine, Winston-Salem, NC) Sally Shumaker.
Sponsor’s Role: The research reported in this article was supported by the research budget of the Reading Health System. This manuscript has been reviewed by WHI and by NHLBI for scientific content and consistency of data interpretation with previous WHI publications; significant comments have been incorporated prior to submission for publication. The study sponsors had no role in the design of the study; the collection, analysis, and interpretation of the data; the writing of the manuscript; or the decision to submit the manuscript for publication. The content is solely the responsibility of the authors and does not necessarily represent the official views of the NHLBI or the National Institutes of Health.
Footnotes
These data have been presented in oral abstract format at the 2012 23rd Annual Scientific Meeting of the North American Menopause Society in Orlando, Florida. These data and results, however, have not been previously published in manuscript format.
Financial disclosures: The authors have no conflicts of interest.
Trial Registration: The ClinicalTrials.gov number for the trial is NCT00000611 (see: http://clinicaltrials.gov/ct2/show/NCT00000611?term=women%27s+health+initiative&rank=5).
Data Integrity: Dr. Schnatz and Mr. Aragaki have had full access to all of the data in the study and take responsibility for the integrity of the data and the accuracy of the data analysis.
References
- 1.Rose G, Shipley M. Plasma cholesterol concentration and death from coronary heart disease: 10 year results of the Whitehall study. Br Med J. 1986;293:306–7. doi: 10.1136/bmj.293.6542.306. [DOI] [PMC free article] [PubMed] [Google Scholar]
- 2.Schnatz PF, Nudy M, O’Sullivan DM, et al. Identification of a mechanism for increased cardiovascular risk among individuals with low vitamin D concentrations. Menopause. 2011;18(9):994–1000. doi: 10.1097/gme.0b013e318212539d. [DOI] [PMC free article] [PubMed] [Google Scholar]
- 3.Maki KC, Rubin MR, Wong LG, McManus JF, Jensen CD, Marshall JW, Lawless A. Serum 25-Hydroxyvitamin D is Independently Associated with High Density Lipoprotein Cholesterol and the Metabolic Syndrome in Men and Women. Journal of Clinical Lipidology. 2009;3:289–96. doi: 10.1016/j.jacl.2009.07.003. [DOI] [PubMed] [Google Scholar]
- 4.Kazlauskaite R, Powell LH, Mandapakala C, Cursio JF, Avery EF, Calvin J. Vitamin D is associated with atheroprotective high-density lipoprotein profile in postmenopausal women. Journal of Clinical Lipidology. 2010;4(2):113–119. doi: 10.1016/j.jacl.2010.01.006. [DOI] [PMC free article] [PubMed] [Google Scholar]
- 5.Reid IR, Mason B, Horne A, et al. Effects of calcium supplementation on serum lipid concentrations in normal older women: a randomized controlled trial. Am J Med. 2002;112:343–7. doi: 10.1016/s0002-9343(01)01138-x. [DOI] [PubMed] [Google Scholar]
- 6.Bostick RM, Fosdick L, Grandits GA, Grambsch P, Gross M, Louis TA. Effect of calcium supplementation on serum cholesterol and blood pressure. A randomized, double-blind, placebo-controlled, clinical trial. Arch Fam Med. 2000;9:31–8. doi: 10.1001/archfami.9.1.31. discussion 39. [DOI] [PubMed] [Google Scholar]
- 7.Karandish M, Shockravi S, Jalali MT, Haghighizadeh MH. Effect of calcium supplementation on lipid profile in overweight or obese Iranian women: a double-blind randomized clinical trial. Eur J Clin Nutr. 2007;63:268–72. doi: 10.1038/sj.ejcn.1602921. [DOI] [PubMed] [Google Scholar]
- 8.Karanja N, Morris CD, Illingworth DR, McCarron DA. Plasma lipids and hypertension: response to calcium supplementation. Am J Clin Nutr. 1987;45:60–5. doi: 10.1093/ajcn/45.1.60. [DOI] [PubMed] [Google Scholar]
- 9.Karanja N, Morris CD, Rufolo P, Snyder G, Illingworth DR, McCarron DA. Impact of increasing calcium in the diet on nutrient consumption, plasma lipids, and lipoproteins in humans. Am J Clin Nutr. 1994;59:900–7. doi: 10.1093/ajcn/59.4.900. [DOI] [PubMed] [Google Scholar]
- 10.Carlson LA, Derblom H, Lanner A. Effect of different doses of vitamin D on serum cholesterol and triglyceride levels in healthy men. Atherosclerosis. 1970;12:313–7. doi: 10.1016/0021-9150(70)90111-5. [DOI] [PubMed] [Google Scholar]
- 11.Lips P, Wiersinga A, van Ginkel FC, et al. The effect of vitamin D supplementation on vitamin D status and parathyroid function in elderly subjects. J Clin Endocrinol Metab. 1988;67:644–50. doi: 10.1210/jcem-67-4-644. [DOI] [PubMed] [Google Scholar]
- 12.Heikkinen AM, Tuppurainen MT, Niskanen L, Komulainen M, Penttila I, Saarikoski S. Long-term vitamin D3 supplementation may have adverse effects on serum lipids during postmenopausal hormone replacement therapy. Eur J Endocrinol. 1997;137:495–502. doi: 10.1530/eje.0.1370495. [DOI] [PubMed] [Google Scholar]
- 13.Ponda MP, Huang X, Odeh MA, Breslow JL, Kaufman HW. Vitamin D May Not Improve Lipid Levels: A Serial Clinical Laboratory Data Study. Circulation. 2012;126:270–277. doi: 10.1161/CIRCULATIONAHA.111.077875. [DOI] [PMC free article] [PubMed] [Google Scholar]
- 14.Hsia J, Heiss G, Hong Ren H, et al. Calcium/Vitamin D Supplementation and Cardiovascular Events. Circulation. 2007;115:846–854. doi: 10.1161/CIRCULATIONAHA.106.673491. [DOI] [PubMed] [Google Scholar]
- 15.Jackson RD, LaCroix AZ, Gass M, et al. Calcium plus vitamin D supplementation and the risk of fractures. NEJM. 2006;354:669–83. doi: 10.1056/NEJMoa055218. [DOI] [PubMed] [Google Scholar]
- 16.Wang H, Xia N, Yang Y, Peng D. Influence of vitamin D supplementation on plasma lipid profiles: A meta-analysis of randomized controlled trials. Lipids in Health and Disease. 2012;11:42. doi: 10.1186/1476-511X-11-42. [DOI] [PMC free article] [PubMed] [Google Scholar]
- 17.Rajpathak SN, Xue X, Wassertheil-Smoller X, Van Horn L, Robinson JG, Liu S, Allison M, Martin LW, Ho GYF, Rohan TE. Effect of 5 y of calcium plus vitamin D supplementation on change in circulating lipids: results from the Women’s Health Initiative. Am J Clin Nutr. 2010;91:894–9. doi: 10.3945/ajcn.2009.28579. [DOI] [PMC free article] [PubMed] [Google Scholar]
- 18.Wang TJ, Pencina MJ, Booth SL, Jacques PF, Ingelsson E, Lanier K, Benjamin EJ, D’Agostino RB, Wolf M, Vasan RS. Vitamin D deficiency and risk of cardiovascular disease. Circulation. 2008;117:503–11. doi: 10.1161/CIRCULATIONAHA.107.706127. [DOI] [PMC free article] [PubMed] [Google Scholar]
- 19.Martins D, Wolf M, Pan D, Zadshir A, Tareen N, Thadhani R, Felsenfeld A, Levine B, Mehrotra R, Norris K. Prevalence of Cardiovascular Risk Factors and the Serum Levels of 25-Hydroxyvitamin D in the United States. Arch Intern Med. 2007;167:1159–1165. doi: 10.1001/archinte.167.11.1159. [DOI] [PubMed] [Google Scholar]
- 20.Ponda MP, Dowd K, Finkielstein D, Holt PR, Breslow JL. The Short-Term Effects of Vitamin D Repletion on Cholesterol: A Randomized, Placebo-Controlled Trial. Arterioscler Thromb Vasc Biol. 2012;32:2510–5. doi: 10.1161/ATVBAHA.112.254110. [DOI] [PMC free article] [PubMed] [Google Scholar]
- 21.Schnatz PF, Marakovits KA, O’Sullivan DM, Ethun K, Clarkson TB, Appt SE. Response to an Adequate Dietary Intake of Vitamin D3 Modulates the Effect of Estrogen Therapy on Bone Density. Journal of Women’s Health. 2012;12(8):858–64. doi: 10.1089/jwh.2011.3244. [DOI] [PMC free article] [PubMed] [Google Scholar]
- 22.Rejnmark L, Avenell A, Masud T, Anderson F, Meyer HE, Sanders KM, Salovaara K, Cooper C, Smith HE, Jacobs ET, Torgerson D, Jackson RD, Manson JE, Brixen K, Mosekilde L, Robbins JA, Francis RM, Abrahamsen B. Vitamin D with Calcium Reduces Mortality: Patient Level Pooled Analysis of 70,528 Patients from Eight Major Vitamin D Trials. J Clin Endo Metab. 2012;97:2670–81. doi: 10.1210/jc.2011-3328. [DOI] [PMC free article] [PubMed] [Google Scholar]
- 23.Ross AC, Taylor CL, Yaktine AL, Del Valle HB, Committee to Review Dietary Reference Intakes for Vitamin D and Calcium; Institute of Medicine, editors. Dietary Reference Intakes for Calcium and Vitamin D. Available at: http://books.nap.edu/openbook.php?record_id=13050&page=R1 accessed October 1, 2013.
- 24.Institute of Medicine, Committee to Review Dietary Reference Intakes for Vitamin D and Calcium. Brief Report, November 2010. Dietary Reference Intakes for Calcium and Vitamin D. Available at: http://www.iom.edu/~/media/Files/Report%20Files/2010/Dietary-Reference-Intakes-for-Calcium-and-Vitamin-D/Vitamin%20D%20and%20Calcium%202010%20Report%20Brief.pdf accessed October 1, 2013.
- 25.Cherniack EP, Florez HJ, Hollis BW, Roos BA, Troen BR, Levis S. The response of elderly veterans to daily vitamin D3 supplementation of 2,000 IU: a pilot efficacy study. J Am Geriatr Soc. 2011;59:286–290. doi: 10.1111/j.1532-5415.2010.03242.x. [DOI] [PubMed] [Google Scholar]
- 26.Vashi PG, Trukova K, Lammersfeld CA, Braun DP, Gupta D. Impact of oral vitamin D supplementation on serum 25-hydroxyvitamin D levels in oncology. Nutritional Journal. 2010;9:60. doi: 10.1186/1475-2891-9-60. [DOI] [PMC free article] [PubMed] [Google Scholar]