

Abstract
We demonstrate a robust, all-fiber, two-wavelength time-lens source for background-free coherent anti-Stokes Raman scattering imaging. The time-lens source generates two picosecond pulse trains simultaneously: one at 1064 nm and the other tunable between 1040 nm and 1075 nm (~400 mW for each wavelength). When synchronized to a mode-locked Ti:Sapphire laser, the two wavelengths are used to obtain on- and off-resonance coherent anti-Stokes Raman scattering images. Real-time subtraction of the nonresonant background in the coherent anti-Stokes Raman scattering image is achieved by the synchronization of the pixel clock and the time-lens source. Background-free coherent anti-Stokes Raman scattering imaging of sebaceous glands in ex vivo mouse tissue is demonstrated.
OCIS codes: (320.7090) Ultrafast lasers, (060.2380) Fiber optics sources and detectors, (180.5655) Raman microscopy
1. Introduction
Coherent Raman scattering (CRS) microscopy, with contrast from coherent anti-Stokes Raman scattering (CARS) or stimulated Raman scattering (SRS) [1–4], provides label-free and chemically specific imaging of biological samples. The endogenous image contrast is provided by exciting vibrational modes of the molecules of interest. A major drawback of CARS is the existence of nonresonant background from the sample and surrounding medium, which reduces the contrast of the resonant CARS image. Although SRS imaging does not exhibit a nonresonant background, there are applications where CARS imaging is preferable due to its simpler detection and its unique applications in polarization-resolved and in vivo imaging. Several strategies have been used to reduce or eliminate the nonresonant contribution to the signal [5–16], such as epi-detection [6, 11], polarization-sensitive detection [5, 7], time-resolved detection [8], nonlinear interferometric CARS [9], and multiplex CARS [10]. These techniques are limited by either severe resonant signal attenuation or complicated implementation. Digitally subtracting the off-resonance CARS image from the on-resonance one has been recognized as the simplest and most robust method for background removal, although it doesn’t remove the CARS signal intensity term given by the mixing between the nonresonant term and the real part of the resonant term of the third-order susceptibility [17–24]. However, the on- and off-resonance images are typically acquired by tuning the wavelength of the pump or Stokes laser, and the slow tuning speed often introduces artifacts due to sample motion in live cell or tissue imaging. This problem can be solved by using three synchronized lasers, which allow the simultaneous recording of on- and off-resonance images [25, 26].
CRS microscopy uses two temporally synchronized, and spatially overlapped, picosecond excitation sources with different center wavelengths. The wavelengths of the lasers are selected so that their beating frequency matches a molecular vibration frequency. Various schemes for achieving the aforementioned requirements for CRS imaging include: two mode-locked lasers with synchronization of the pulses realized by phase-lock loops (PLLs) and fine adjustments of the cavity [27, 28], optical parametric oscillators (OPOs) synchronously pumped by a mode-locked laser [3, 29], fiber sources based on continuum generation [30] or soliton self-frequency shift [31], or actively mode-locked lasers [32]. Approaches based on mode-locked lasers and OPOs are costly, bulky, and environmentally sensitive [3, 25–29], whereas previous fiber based systems have the disadvantages of large spectral width [30] or low peak power [31].
Recently, we demonstrated synchronized picosecond light sources for CRS imaging based on the time-lens concept [33, 34]. The space-time duality arises from the mathematical equivalence between paraxial diffraction in the spatial domain and dispersive propagation in the time domain [35–37]. Based on this concept, a time lens is the temporal equivalent of a conventional lens and can be implemented by temporal phase modulation. Similar to beam focusing performed by a lens and diffraction in the spatial domain, pulse compression can be realized by a time lens and dispersion in the temporal domain. This technique benefits from a robust all-fiber configuration, picosecond pulse width, high peak power and electronic tuning of the pulse delay to achieve temporal overlap between the two pulse trains. Use of a time lens makes it possible to synchronize this system to any mode-locked laser. The intrinsic similarity of the time-lens source to a transmitter with phase and amplitude modulation in fiber-optic communications makes the time-lens source highly robust and scalable for multi-color implementation.
In this paper, we demonstrate a robust, cost-effective, all-fiber, two-wavelength time-lens source for background-free CARS imaging. The time-lens source generates two picosecond pulse trains simultaneously: one fixed at 1064 nm and the other tunable between 1040 nm and 1075 nm. The average power and pulse width for each wavelength are approximately 400 mW and 1.9 ps, respectively. When synchronized to a mode-locked Ti:Sapphire (Ti:Sa) laser, the two wavelengths are used to obtain on- and off-resonance CARS images. Real-time (pixel by pixel with pixel dwell time of ~2 μs) subtraction of the nonresonant background in the CARS image is achieved by the synchronization of the microscope pixel clock and the time-lens source so that for each pixel in the acquired image the signal is excited by the pump and only one of the Stokes beams. Background-free CARS imaging of sebaceous glands in ex vivo mouse tissue is demonstrated. The demonstrated technique enables convenient synchronization to both the microscope pixel clock and the mode-locked laser in a robust, cost-effective, all-fiber configuration, and is scalable to include more wavelengths. The multi-wavelength time-lens source may provide an all-fiber, user-friendly alternative for background-free CARS imaging.
2. Experimental results
The experimental setup is shown in Fig. 1. The picosecond pump pulses for CARS imaging are obtained by spectral filtering of the pulses (100 fs pulse width at 80 MHz repetition rate) from a mode-locked Ti:Sa laser (Mai Tai, Spectra-Physics) [34].
Fig. 1.
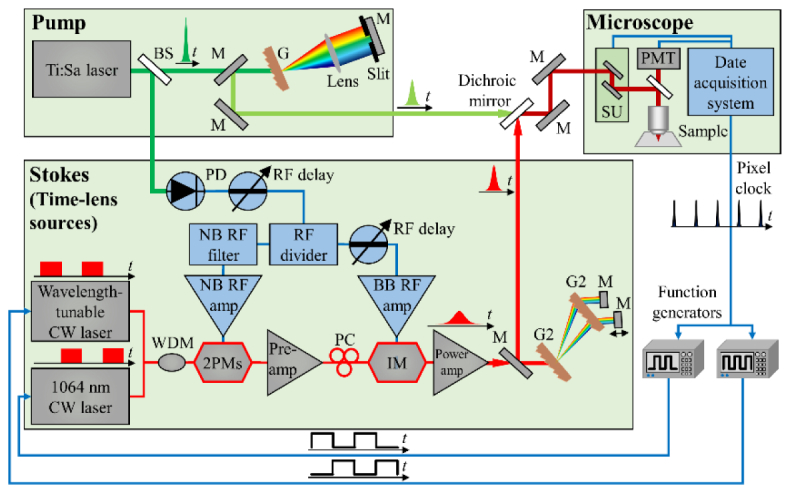
Experimental setup of the two-wavelength time-lens source (Stokes) synchronized to a mode-locked Ti:Sa laser (pump). BS, beam sampler; M, mirror; G, grating (T-1400-800s-2415-94, 1400 line/mm, Lightsmyth); SU, scanning unit; PMT, photomultiplier tube; NB, narrowband; BB, broadband; WDM, Wavelength-division multiplexer; PM, phase modulator; IM, intensity modulator; G2, grating (T-1600-1060s, 1600 line/mm, Lightsmyth).
The Stokes beams are generated from a two-wavelength time-lens source synchronized to the pump. A GaAs photodetector (ET-4000, EOT) detects a small portion of the output of the Ti:Sa mode-locked laser and generates a RF pulse train. The RF pulse train is then divided into two branches. One branch is filtered with a narrowband (NB) filter (with a 3dB bandwidth of 50 MHz) centered at the 125th harmonic of the 80 MHz repetition rate (i.e., 10 GHz). The resulting 10 GHz sinusoid is amplified to drive two electro-optic phase modulators (2PMs, EOSPACE) with an amplitude of ~14 Vpp (Vpp is the peak-to-peak drive voltage) for each phase modulators. The other branch is amplified and is used to drive the Mach-Zehnder intensity modulator (IM, EOSPACE). The intensity modulator carves synchronized pulses onto the two CW sources, which consist a 1064 nm CW laser (QFBGLD-1060-30P, QPhotonics) and a wavelength-tunable CW laser (TEC-520-1060-100, Sacher Lasertechnik). The output pulses from the IM have temporal width of 80 ps due to the limited bandwidth of the components. A pair of transmission gratings (T-1600-1060s, LightSmyth) is used for dispersion compensation and pulse compression. The dispersion caused by the length of the fiber introduces a small, fixed walk-off between the pulses of the two wavelengths, which is compensated by using two separate mirrors in the compressor. We used Yb3+ doped fiber amplifiers (pre-amp) to compensate for the loss caused by the pulse carving and the phase modulators, and another Yb3+ doped fiber amplifiers (power amp) to increase the output power up to 800 mW. When both CW sources are modulated and present in the time-lens source, the average power per wavelength can reach up to 400 mW.
Temporal synchronization between the pump and the Stokes is achieved by RF delay lines, which can be adjusted over a large range (~0.8 ns), eliminating the need for cumbersome mechanical optical delay lines. The pump, Stokes, and nonresonant Stokes beams are spatially combined with a dichroic mirror and sent into a laser-scanning microscope (FV1000MPE, Olympus) with a 20x water immersion objective lens (XLUMPlanFI 20x/0.95 W, Olympus). A band-pass filter (transmission at wavelength between 595 nm and 665 nm) and a long-pass filter (transmission at wavelength longer than 650 nm) are used to separate the CARS signal from the excitation beams and other nonlinearly generated light such as two-photon excited fluorescence. The pixel clock is extracted from the microscope, and is used as a time reference for two function generators that directly modulate the CW sources to achieve the desired pixel-on, pixel-off effect. Modulation speeds up to 2 MHz can be achieved.
We first characterize the pump. The average power of the pump is 200 mW. The measured spectrum of the pump is shown in Fig. 2(a). The center wavelength and the bandwidth of the pump are 816.8 nm and 1.8 nm, respectively. The corresponding pulse width of the pump, deconvolved from the measured second-order interferometric autocorrelation trace [Fig. 2(d)], is 1 ps (a deconvolution factor of 1.4 is used, assuming the pulse has a Gaussian profile).
Fig. 2.

Characterization of the lasers for CARS imaging. (a) Spectrum of the pump laser. (b, c) Spectra of the time-lens source at ~1056 nm and ~1063.6 nm, respectively. (d) Second order interferometric autocorrelation of the pump laser. The de-convolved FWHM of the pulse is approximately 1 ps. (e) Second order cross-correlation trace between the 1.9 ps pulse at 1056 nm (b) and the 100 fs pulses from the mode-locked Ti:Sa laser. (f) Second order cross-correlation trace between the 1.9 ps pulse at 1063.6 nm (c) and the 100 fs pulses from the mode-locked Ti:Sa laser. The insets in (e) and (f) show the measured sum-frequency signal at the half-maximum of the cross-correlation traces over 350 s (sampled at 1 kHz).
We then characterized the Stokes beams (time-lens output) and the synchronization performance. The average power after modulation and compression is 400 mW in the nonresonant Stokes beam at 1056 nm and 400 mW in the resonant Stokes beam at 1063.6 nm. Both wavelengths have a spectral full width at half maximum (FWHM) of ~1.5 nm, as shown in Figs. 2(b) and 2(c). For temporal profile characterization, we perform a cross-correlation between the time-lens output and the 100 fs pulse directly from the mode-locked Ti:Sa laser using collinear sum frequency generation in a beta barium borate (β-BBO) crystal of 0.5mm thickness [33, 34]. Scanning the relative delay between the beams was achieved by tuning the RF delay between the electro-optical modulators and the Ti:Sa pulse train. As shown in Figs. 2(e) and 2(f), the temporal FWHM of the two-wavelength time-lens output is 1.9 ps for both the resonant and nonresonant Stokes beams. To measure the relative timing jitter between the time-lens source and the 100 fs pulse from the mode-locked Ti:Sa laser, we record the sum frequency intensity fluctuation at the half-maximum of the cross-correlation trace [inset in Figs. 2(e) and 2(f), sampled at 1 kHz]. The measured root-mean-square (RMS) timing jitters for resonant and nonresonant Stokes over a measurement time of 350 s are 44 and 50 fs, respectively, only a small fraction of the pulse widths and suitable for CARS imaging.
The microscope pixel clock and the time-lens source are synchronized to provide pixel-to-pixel control of the on- and off-resonance imaging. Figure 3 shows the pixel clock from the microscope [Fig. 3(a)], the modulated CW light of the time-lens source [Fig. 3(b)] and the corresponding CARS image of Dodecane [Fig. 3(c)]. The pixel dwell time of the microscope is set at 2 μs and thus, the electrical pulse train of the pixel clock from the microscope has a repetition rate of 500 kHz [Fig. 3(a)]. The pixel clock is divided into two branches, which are sent to two function generators (SDG1025 and SDG1020, Siglent). These function generators work in burst modes, and generate a synchronized 250 kHz rectangular output with a pulse width of ~1.7 μs. The function generator has a built-in tunable delay with a range of more than 5 μs, which enables precise control of the relative timing of the output of the two function generators. By alternating the two Stokes beams, the adjacent pixels in the image are excited by either the on-resonance beam or the off-resonance beam. Therefore, on- and off- Raman resonance imaging is achieved within one pixel dwell time (~2 μs). As an example, CARS imaging of Dodecane (Linear Formula: CH3(CH2)10CH3, anhydrous ≥99%, Sigma-Aldrich) at the CH2 stretching frequency (2845 cm−1) is shown [Figs. 3(c) and 3(d)]. In the experiment, the mode-locked Ti:Sa laser is tuned to 816.8 nm, the Stokes beam is tuned to 1063.6 nm (on resonance with the CH2 stretching vibrational frequency at 2845 cm−1), and the nonresonant Stokes beam is tuned to 1056 nm (off-resonance at 2773 cm−1). The average power of the pump, resonant Stokes and nonresonant Stokes beams on the sample are 55 mW, 20 mW and 20 mW, respectives. The pixels in the odd and even columns are bright and dark, respectively, which represents on- and off-Raman resonance imaging.
Fig. 3.

Pixel-to-pixel synchronization of the microscope and the two-wavelength time-lens source. (a) Pixel clock extracted from the microscope. (b) Intensity of the modulated CW lasers for the time-lens source at 1056 nm (solid blue) and 1063.6 nm (dotted red). (c) CARS image of Dodecane (CH2 stretching frequency at 2845 cm−1, 64 × 64 pixels, 2 μs/pixel). The scale bar is 25 μm. (d) A zoomed-in view of (c), where 4 pixels are displayed. Pixels in columns 8 and 10 correspond to the signal excited by the pump and the nonresonant Stokes at 1056 nm, and are dark as a result of the small CARS signal; while pixels in columns 7 and 9 excited by the pump and the resonant Stokes at 1063.6 nm are bright.
To demonstrate the capabilities of the two-wavelength time-lens source for background-free CARS image, we performed CARS imaging of sebaceous glands in ex vivo mouse ear tissue. The experimental configuration is the same as in Fig. 3. Figures 4(a)-4(d) shows the CARS images. The corresponding intensity profiles along the lines indicated in the CARS images are shown in Figs. 4(e)-4(h). In particular, the on-resonance image shown in Fig. 4(a) has a strong CARS signal with nonresonant background, while the off-resonance image shown in Fig. 4(b) has a weak CARS signal with the same nonresonant background. By a simple subtraction of on- and off-resonance images, background-free CARS images [Fig. 4(c)] are obtained, with significantly improved contrast when compared to the original image without background subtraction [Fig. 4(a)]. Figure 4(d) shows the image when the pump and Stokes beams do not overlap in time (a RF delay of 80 ps was introduced), proving that the signal is CARS and indicating that contributions (e.g., two-photon excited fluorescence, room light, laser leakage, etc.) other than the nonresonant background are negligible.
Fig. 4.

CARS images of sebaceous glands in ex vivo mouse ear tissue, with the source tuned to the CH2 stretching frequency. 800 × 800 pixels, 2 μs/pixel, no average. (a) Image formed from the on-resonant pixels (all odd columns). (b) Image formed from the off-resonant pixels (all even columns). (c) Image after the subtraction of the nonresonant background (b) from the resonant signal (a). Note that the brightness of the image is increased by ~2 times to match the brightness scale of (a). (d) Image taken when the pump and Stokes beams do not overlap in time (an RF delay of 80 ps was introduced). (e-h) show the corresponding intensity profiles along the lines indicated in the images (a-d). For comparison, the intensity profile in (a) (dashed red line) is also shown in (g).
The two-wavelength time-lens source for background-free CARS image was then tested using another sample, cotton fibers in water. The same sample was used in a previous paper to demonstrate nonresonant-background suppression in CARS microscopy [21]. The experimental configuration is the same as in Fig. 3. Figures 5(a)-5(d) shows the CARS images. The corresponding intensity profiles along the lines indicated in the CARS images are shown in Figs. 5(e)-5(h). The signal-to-background contrast of the conventional on-resonance CARS image is ~3.6:1. The nonresonant background is mainly contributed by the water environment. The resulting image after background subtraction has a signal-to-background contrast of ~37.5:1, thereby achieving a ~10-fold improvement in image contrast. As discussed in [21], the detection sensitivity of the digital image processing technique is limited by the finite intensity values of each pixel of the acquired image and the accumulated noise from multiple images.
Fig. 5.

CARS images of cotton fibers in water, with the source tuned to the CH2 stretching frequency. 512 × 512 pixels, 2 μs/pixel, averaged for 8 times. (a) Image formed from the on-resonant pixels (all odd columns). (b) Image formed from the off-resonant pixels (all even columns). (c) Image after the subtraction of the nonresonant background (b) from the resonant signal (a). Note that the brightness of the image is increased by ~3 times to match the brightness scale of (a). (d) Image taken when the pump and Stokes beams do not overlap in time (an RF delay of 80 ps was introduced). (e-h) show the corresponding intensity profiles along the lines indicated in the images (a-d). For comparison, the intensity profile in (a) (dashed red line) is also shown in (g).
3. Conclusions
In conclusion, we have experimentally demonstrated background free CARS imaging using a two-wavelength time-lens source. Two synchronized picosecond sources with hundreds of milliwatts of optical power were generated through time-lens pulse compression of CW lasers. Direct modulation of the CW lasers using the microscope pixel clock ensures synchronization of image acquisition and the time-lens source, and enables real-time (pixel by pixel) subtraction of the nonresonant background in the CARS image. The demonstrated technique has the advantages of convenient synchronization to both the microscope pixel clock and the mode-locked laser in a robust, cost-effective, all-fiber configuration. While two wavelengths were demonstrated in this paper, it is relatively straightforward to include more wavelengths in the time-lens source. Multi-wavelength time-lens sources may provide an all-fiber, user-friendly alternative for background-free CARS imaging.
Acknowledgment
The authors thank Mengran Wang and Tianyu Wang from the same group for providing the mouse ear tissue.
Funding
Partially supported by National Institutes of Health/National Institute of Biomedical Imaging and Bioengineering (NIH/NIBIB) (R01EB017274); National Natural Science Foundation of China (NSFC) (11404218); The Project of Department of Education of Guangdong Province (2014KTSCX114)
References and links
- 1.Zumbusch A., Holtom G. R., Xie X. S., “Three-dimensional vibrational imaging by coherent anti-Stokes Raman scattering,” Phys. Rev. Lett. 82(20), 4142–4145 (1999). 10.1103/PhysRevLett.82.4142 [DOI] [Google Scholar]
- 2.Müller M., Zumbusch A., “Coherent anti-Stokes Raman scattering microscopy,” ChemPhysChem 8(15), 2156–2170 (2007). 10.1002/cphc.200700202 [DOI] [PubMed] [Google Scholar]
- 3.Freudiger C. W., Min W., Saar B. G., Lu S., Holtom G. R., He C., Tsai J. C., Kang J. X., Xie X. S., “Label-free biomedical imaging with high sensitivity by stimulated Raman scattering microscopy,” Science 322(5909), 1857–1861 (2008). 10.1126/science.1165758 [DOI] [PMC free article] [PubMed] [Google Scholar]
- 4.Cheng J.-X., Xie X. S., “Vibrational spectroscopic imaging of living systems: An emerging platform for biology and medicine,” Science 350(6264), aaa8870 (2015). 10.1126/science.aaa8870 [DOI] [PubMed] [Google Scholar]
- 5.Akhmanov S., Bunkin A., Ivanov S., Koroteev N., “Coherent ellipsometry of Raman scattering of light,” J. Exp. Theor. Phys. 25, 416 (1977). [Google Scholar]
- 6.Cheng J.-X., Volkmer A., Book L. D., Xie X. S., “An epi-detected coherent anti-Stokes Raman scattering (E-CARS) microscope with high spectral resolution and high sensitivity,” J. Phys. Chem. B 105(7), 1277–1280 (2001). 10.1021/jp003774a [DOI] [Google Scholar]
- 7.Cheng J.-X., Book L. D., Xie X. S., “Polarization coherent anti-Stokes Raman scattering microscopy,” Opt. Lett. 26(17), 1341–1343 (2001). 10.1364/OL.26.001341 [DOI] [PubMed] [Google Scholar]
- 8.Volkmer A., Book L. D., Xie X. S., “Time-resolved coherent anti-Stokes Raman scattering microscopy: Imaging based on Raman free induction decay,” Appl. Phys. Lett. 80(9), 1505–1507 (2002). 10.1063/1.1456262 [DOI] [Google Scholar]
- 9.Evans C. L., Potma E. O., Xie X. S., “Coherent anti-Stokes Raman scattering spectral interferometry: determination of the real and imaginary components of nonlinear susceptibility χ(3) for vibrational microscopy,” Opt. Lett. 29(24), 2923–2925 (2004). 10.1364/OL.29.002923 [DOI] [PubMed] [Google Scholar]
- 10.Wurpel G. W., Schins J. M., Müller M., “Direct measurement of chain order in single phospholipid mono-and bilayers with multiplex CARS,” J. Phys. Chem. B 108(11), 3400–3403 (2004). 10.1021/jp037629j [DOI] [Google Scholar]
- 11.Evans C. L., Potma E. O., Puoris’haag M., Côté D., Lin C. P., Xie X. S., “Chemical imaging of tissue in vivo with video-rate coherent anti-Stokes Raman scattering microscopy,” Proc. Natl. Acad. Sci. U.S.A. 102(46), 16807–16812 (2005). 10.1073/pnas.0508282102 [DOI] [PMC free article] [PubMed] [Google Scholar]
- 12.von Vacano B., Buckup T., Motzkus M., “Highly sensitive single-beam heterodyne coherent anti-Stokes Raman scattering,” Opt. Lett. 31(16), 2495–2497 (2006). 10.1364/OL.31.002495 [DOI] [PubMed] [Google Scholar]
- 13.Potma E. O., Evans C. L., Xie X. S., “Heterodyne coherent anti-Stokes Raman scattering (CARS) imaging,” Opt. Lett. 31(2), 241–243 (2006). 10.1364/OL.31.000241 [DOI] [PubMed] [Google Scholar]
- 14.Rinia H. A., Bonn M., Müller M., Vartiainen E. M., “Quantitative CARS spectroscopy using the maximum entropy method: the main lipid phase transition,” ChemPhysChem 8(2), 279–287 (2007). 10.1002/cphc.200600481 [DOI] [PubMed] [Google Scholar]
- 15.Postma S., van Rhijn A. C., Korterik J. P., Gross P., Herek J. L., Offerhaus H. L., “Application of spectral phase shaping to high resolution CARS spectroscopy,” Opt. Express 16(11), 7985–7996 (2008). 10.1364/OE.16.007985 [DOI] [PubMed] [Google Scholar]
- 16.Lin J., Lu F., Wang H., Zheng W., Sheppard C. J., Huang Z., “Improved contrast radially polarized coherent anti-Stokes Raman scattering microscopy using annular aperture detection,” Appl. Phys. Lett. 95(13), 133703 (2009). 10.1063/1.3240874 [DOI] [Google Scholar]
- 17.Duncan M., Reintjes J., Manuccia T., “Imaging biological compounds using the coherent anti-Stokes Raman scattering microscope,” Opt. Eng. 24(2), 242352 (1985). 10.1117/12.7973483 [DOI] [Google Scholar]
- 18.Dudovich N., Oron D., Silberberg Y., “Single-pulse coherently controlled nonlinear Raman spectroscopy and microscopy,” Nature 418(6897), 512–514 (2002). 10.1038/nature00933 [DOI] [PubMed] [Google Scholar]
- 19.Li L., Wang H., Cheng J.-X., “Quantitative coherent anti-Stokes Raman scattering imaging of lipid distribution in coexisting domains,” Biophys. J. 89(5), 3480–3490 (2005). 10.1529/biophysj.105.065607 [DOI] [PMC free article] [PubMed] [Google Scholar]
- 20.Zimmerley M., Lin C.-Y., Oertel D. C., Marsh J. M., Ward J. L., Potma E. O., “Quantitative detection of chemical compounds in human hair with coherent anti-Stokes Raman scattering microscopy,” J. Biomed. Opt. 14(4), 044019 (2009). 10.1117/1.3184444 [DOI] [PMC free article] [PubMed] [Google Scholar]
- 21.Fang C., Lu F., Zheng W., Huang Z., “Triple-frequency symmetric subtraction scheme for nonresonant background suppression in coherent anti-Stokes Raman scattering (CARS) microscopy,” Opt. Express 18(15), 15714–15724 (2010). 10.1364/OE.18.015714 [DOI] [PubMed] [Google Scholar]
- 22.Pegoraro A. F., Slepkov A. D., Ridsdale A., Moffatt D. J., Stolow A., “Hyperspectral multimodal CARS microscopy in the fingerprint region,” J. Biophotonics 7(1-2), 49–58 (2014). 10.1002/jbio.201200171 [DOI] [PubMed] [Google Scholar]
- 23.Chen K., Wu T., Wei H., Zhou T., Li Y., “Quantitative chemical imaging with background-free multiplex coherent anti-Stokes Raman scattering by dual-soliton Stokes pulses,” Biomed. Opt. Express 7(10), 3927–3939 (2016). 10.1364/BOE.7.003927 [DOI] [PMC free article] [PubMed] [Google Scholar]
- 24.Andreana M., Houle M.-A., Moffatt D. J., Ridsdale A., Buettner E., Légaré F., Stolow A., “Amplitude and polarization modulated hyperspectral Stimulated Raman Scattering Microscopy,” Opt. Express 23(22), 28119–28131 (2015). 10.1364/OE.23.028119 [DOI] [PubMed] [Google Scholar]
- 25.Burkacky O., Zumbusch A., Brackmann C., Enejder A., “Dual-pump coherent anti-Stokes-Raman scattering microscopy,” Opt. Lett. 31(24), 3656–3658 (2006). 10.1364/OL.31.003656 [DOI] [PubMed] [Google Scholar]
- 26.Ganikhanov F., Evans C. L., Saar B. G., Xie X. S., “High-sensitivity vibrational imaging with frequency modulation coherent anti-Stokes Raman scattering (FM CARS) microscopy,” Opt. Lett. 31(12), 1872–1874 (2006). 10.1364/OL.31.001872 [DOI] [PubMed] [Google Scholar]
- 27.Potma E. O., Jones D. J., Cheng J.-X., Xie X. S., Ye J., “High-sensitivity coherent anti-Stokes Raman scattering microscopy with two tightly synchronized picosecond lasers,” Opt. Lett. 27(13), 1168–1170 (2002). 10.1364/OL.27.001168 [DOI] [PubMed] [Google Scholar]
- 28.Ozeki Y., Kitagawa Y., Sumimura K., Nishizawa N., Umemura W., Kajiyama S., Fukui K., Itoh K., “Stimulated Raman scattering microscope with shot noise limited sensitivity using subharmonically synchronized laser pulses,” Opt. Express 18(13), 13708–13719 (2010). 10.1364/OE.18.013708 [DOI] [PubMed] [Google Scholar]
- 29.Kieu K., Saar B. G., Holtom G. R., Xie X. S., Wise F. W., “High-power picosecond fiber source for coherent Raman microscopy,” Opt. Lett. 34(13), 2051–2053 (2009). 10.1364/OL.34.002051 [DOI] [PMC free article] [PubMed] [Google Scholar]
- 30.Svedberg F., Brackmann C., Hellerer T., Enejder A., “Nonlinear microscopy with fiber laser continuum excitation,” J. Biomed. Opt. 15(2), 026026 (2010). 10.1117/1.3374039 [DOI] [PubMed] [Google Scholar]
- 31.Krauss G., Hanke T., Sell A., Träutlein D., Leitenstorfer A., Selm R., Winterhalder M., Zumbusch A., “Compact coherent anti-Stokes Raman scattering microscope based on a picosecond two-color Er:fiber laser system,” Opt. Lett. 34(18), 2847–2849 (2009). 10.1364/OL.34.002847 [DOI] [PubMed] [Google Scholar]
- 32.Bégin S., Burgoyne B., Mercier V., Villeneuve A., Vallée R., Côté D., “Coherent anti-Stokes Raman scattering hyperspectral tissue imaging with a wavelength-swept system,” Biomed. Opt. Express 2(5), 1296–1306 (2011). 10.1364/BOE.2.001296 [DOI] [PMC free article] [PubMed] [Google Scholar]
- 33.Wang K., Freudiger C. W., Lee J. H., Saar B. G., Xie X. S., Xu C., “Synchronized time-lens source for coherent Raman scattering microscopy,” Opt. Express 18(23), 24019–24024 (2010). 10.1364/OE.18.024019 [DOI] [PMC free article] [PubMed] [Google Scholar]
- 34.Wang K., Zhang D., Charan K., Slipchenko M. N., Wang P., Xu C., Cheng J.-X., “Time-lens based hyperspectral stimulated Raman scattering imaging and quantitative spectral analysis,” J. Biophotonics 6(10), 815–820 (2013). [DOI] [PMC free article] [PubMed] [Google Scholar]
- 35.Treacy E., “Optical pulse compression with diffraction gratings,” IEEE J. Quantum Electron. 5(9), 454–458 (1969). 10.1109/JQE.1969.1076303 [DOI] [Google Scholar]
- 36.Kolner B. H., “Space-time duality and the theory of temporal imaging,” IEEE J. Quantum Electron. 30(8), 1951 (1994). 10.1109/3.301659 [DOI] [Google Scholar]
- 37.Li B., Li M., Lou S., Azaña J., “Linear optical pulse compression based on temporal zone plates,” Opt. Express 21(14), 16814–16830 (2013). 10.1364/OE.21.016814 [DOI] [PubMed] [Google Scholar]