

Abstract
The cold and menthol receptor, TRPM8, also designated CMR1, is a member of the transient receptor potential (TRP) family of excitatory ion channels. TRPM8 is a channel activated by cold temperatures, voltage, and menthol. In this study, we characterize the cold- and voltage-induced activation of TRPM8 channel in an attempt to identify the temperature- and voltage-dependent components involved in channel activation. Under equilibrium conditions, decreasing temperature has two effects. (i) It shifts the normalized conductance vs. voltage curves toward the left, along the voltage axis. This effect indicates that the degree of order is higher when the channel is in the open configuration. (ii) It increases the maximum channel open probability, suggesting that temperature affects both voltage-dependent and -independent pathways. In the temperature range between 18°C and 25°C, large changes in enthalpy (ΔH = -112 kcal/mol) and entropy (ΔS = -384 cal/mol K) accompany the activation process. The Q10 calculated in the same temperature range is 24. This thermodynamic analysis strongly suggests that the process of opening involves large conformational changes of the channel-forming protein. Therefore, the highly temperature-dependent transition between open and closed configurations is possible because enthalpy and entropy are both large and compensate each other. Our data also demonstrate that temperature and voltage interact allosterically to enhance channel opening.
Keywords: CMR1, cold activation, allosteric model, voltage activation
Since the breakthrough identification of the vanilloid receptor, TRPV1, as the hot-capsaicin receptor (1), six temperature-dependent channels have been cloned during the last 7 years (1-8). Interestingly, all of the cloned channels belong to the extended transient receptor potential (TRP) family of excitatory channels (9, 10). TRP channels are membrane proteins constituted by subunits containing six-transmembrane domains, which assemble into tetramers forming conducting pores (11, 12). Heat-dependent channels belong to the vanilloid receptor TRPV subfamily and the cold-dependent channel TRPM8 belongs to the TRPM subfamily (13). Thermo-TRP channels have different temperature thresholds for activation, and their activity is modulated by several different agonists, allowing us to sense and differentiate a large spectrum of temperatures, from below 0°C to 50°C (14). Among those temperature-activated channels, TRPM8 was the first found to sense a cold stimulus (4, 7). TRPM8 is a nonselective outwardly rectifying channel. The channel opens at ≈28°C, and its activity increases as the temperature diminishes and saturates at ≈10°C (4). The channel is also able to respond to several agonists, including menthol (15).
Channel gating is known to be affected by temperature. Q10 value is used to estimate the temperature dependence of a given system. Channels with a Q10 ≥ 2 are considered highly temperature-dependent (16). Thermo-TRP receptor channels present exceptionally high Q10 values (>20) (13).
Several studies have addressed capsaicin binding (17, 18), pH dependencies (19), physiological relevance (13), and, recently, thermodynamics (20) of TRPV1, one of the molecular transducers of heat sensation. Large values for transitional entropy, enthalpy, and Q10 were found, (20) indicating large rearrangements in the channel structure during activation. In contrast, little is known about regulation of its counterpart, TRPM8.
Here we show that the large changes in TRPM8 channel gating induced by temperature are mainly due to modifications of the maximum probability of opening and to a shift along the voltage axis of the conductance-voltage curves. Moreover, the results can be fully explained by using an allosteric model in which temperature has only a moderate effect on the voltage sensors (Q10 ≈ 3) when channels are closed. Thus, temperature and voltage sensor activation act almost independently to promote channel opening.
Methods
Temperature Control and Ramps. The recording chamber consisted of an electrically isolated bronze block with a hole of the appropriate dimensions to fit the coverslip containing the cell preparation. A Peltier device was attached to this bronze chamber and a heat dissipater was connected to the Peltier. The temperature feedback signal was obtained by using a miniature thermistor located in the solution and ≈1 mm from the electrode, allowing us to measure 0.1°C changes. Temperature ramps were linear in the range that the recording of current or fluorescence was done, and the rate at which they were set (0.2°C/s) was sufficient to ensure steady-state conditions. This setting was tested by comparing the ramp results with those obtained in true equilibrium conditions (see Fig. 2 A).
Fig. 2.

Thermodynamic analysis of TRPM8. (A) Current-temperature plot. Each point represents the average of at least seven experiments. Filled symbols represent data obtained with 0.2°C/s temperature ramps. Open symbols correspond to data obtained maintaining the desired temperature constant for at least 60 s and measuring the current at the end of the run. (B) Plot of log(I) vs. T of the data shown in A. (C) van't Hoff plot of the equilibrium constant, Keq, determined as described in the text. The plot was regressed by using two straight lines in the range between 25°C and 18°C and in the range between 18°C and 10°C. Enthalpies and entropies calculated in these two ranges are shown. (D) ΔG vs. temperature plot for TRPM8 and TRPV1. ΔG was calculated as RT × ln(Keq) for TRPM8 and obtained from Liu et al. (20) for TRPV1. (E) Arrhenius plot for activation process. Activation rates were calculated from the activation time constants of current traces elicited at 160 mV and 70 mV. (F) Arrhenius plot for deactivation process. Deactivation rates were calculated from the deactivation time constants of current traces elicited at -130 mV and -40 mV. (E and F Insets) The time course of the current activation and deactivation at two different temperatures, respectively. Data were fitted to a double exponential function (red dotted lines). Activation energy, Ea, was calculated directly from the slope of the Arrhenius plots (slope = -Ea/R) at 160 mV and -130 mV (solid lines).
HEK293 Electrophysiology. Whole cell currents were obtained from HEK CR#1 cells. Gigaseals were formed by using 2-4 MΩ borosilicate pipettes (o.d., 1.5 mm; i.d., 0.86 mm; Warner Instruments, Hamden, CT). Whole cell voltage clamp was performed at different temperatures. Macroscopic currents were acquired at 10 kHz and filtered at 2 kHz. Single-channel currents were acquired at 20 kHz and filtered at 3 kHz. Borosilicate pipettes (7-10 MΩ) were used for single channels recordings. Custom-made software written in labview was developed for all electrophysiology data acquisition.
Variance Analysis. Nonstationary noise analysis (21, 22) was carried out at different temperatures. To estimate the maximum probability of opening, we collected 70 current records during activation of the channels by a depolarization voltage step from 0 to 120 mV with a 250-ms duration. Ensemble average current, 〈I〉, and its variance, σ2, on each isochrone were computed. The variance as a function of 〈I〉 data was fitted by the equation:
 |
[1] |
where i is the single-channel unitary current and N is the number of channels in the patch. The maximum open probability,  , was obtained according to the relationship
 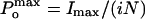 , where Imax is the maximum mean current measured in the experiment. For noise analysis, data were acquired at 20 kHz and filtered at 5 kHz.
Fit to a Stationary Model. For each temperature, a mean V0.5 (〈V0.5〉) value was obtained. All of the corresponding I/Imax vs. voltage curves were displaced in the voltage axis by V0.5 - 〈V0.5〉, thus constructing an average curve that preserved the shape of the individual curves. Every set of points was converted to a 40-point set by a smoothing function in sigmaplot 8.0. Average curves at four different temperatures were simultaneously fitted to Eq. 5 (see below) by least-squares fitting with the solver function of excel (Microsoft).
Methods for generation of cell line expressing TRPM8, cell culture, inmunocytochemistry, calcium imaging, recording solutions used, and data analysis are provided in Supporting Text and Figs. 6 and 7, which are published as supporting information on the PNAS web site.
Results
CR#1 Cell Line and Its Response to Temperature and Menthol. To characterize the TRPM8 channel, we obtained a HEK293 cell clone expressing robust temperature- and menthol-activated currents, named CR#1. TRPM8 expression in CR#1 cells assessed by immunofluorescence is shown in Fig. 1A. Intracellular calcium (assayed with Fluo-4 fluorescence) of CR#1 cells increases upon stimulation with menthol (Fig. 1B) and low temperature (Fig. 1C), a characteristic of TRPM8-expressing cells (4, 7). Nontransfected cells did not respond to either stimulus (data not shown).
Fig. 1.

TRPM8 cell line expression and functional analysis. (A) Expression of TPRM8 channels in HEK293 cells visualized by using immunofluorescence confocal images (see Methods). Nuclei have been stained with propidium iodide for counterstaining purposes. (Left) The negative control without antibody. (Scale bar in Left and Center,50 μm). The images in Center and Right are from a clone expressing TRPM8 (CR#1). (Right) A magnification in which it is possible to see that the fluorescence is in the membrane and in the cytoplasm. (Scale bar, 20 μm.) (B) Calcium images taken of CR#1 clone cells before (Left) and after (Right) menthol addition (100 μM). (C) Calcium images of CR#1 cells exposed to different temperatures. Cells were loaded with Fluo-4. (D) Current-temperature recordings at holding potentials of -60 and 60 mV. Ramp speed, 0.2°C/s. (E) Normalized current data obtained at -60 and 60 mV. Notice that voltage changes the temperature threshold.
To obtain a complete temperature vs. activity relationship for TRPM8 channels, we exposed CR#1 cells to temperature ramps of 0.2°C·s-1, a ramp speed that assures steady-state conditions (see Methods and open symbols in Fig. 2A). Fig. 1D shows current vs. temperature plots obtained at two different holding potentials. As indicated in Fig. 1E, current at -60 mV is evoked at lower temperatures than current at +60 mV, a discrepancy that is due to the voltage dependency of the channel. In summary, the data shown in Fig. 1 is in good agreement with the results obtained previously by other groups (4, 7), and we conclude that the CR#1 cell line expresses normal TRPM8 channels.
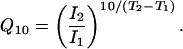
Thermodynamic Analysis of the Current vs. Temperature Curve. Fig. 2 A shows an averaged current vs. temperature plot (n = 7) for the experiments at the +60-mV holding potential. We analyzed this data with two thermodynamical approaches. First, we used the 10-degree temperature coefficient (Q10) to quantify the temperature sensitivity of the TRPM8 channel. The following equation describes the Q10 values' meaning and its relationship to the observed current:
 |
[2] |
In this equation, I1 and I2 are the measured currents at temperatures T1 and T2, respectively. The Q10 value is then obtained from the slope of a log(I) vs. T plot or directly fitting the data by using Eq. 2. Fig. 2B shows a log(I) vs. T plot in which we appreciate two temperature-dependent regimes (i.e., two linear components): a phase between 27°C and 18°C with Q10 = 23.8, and a shallower phase in the range from 18°C to 10°C with Q10 = 3.3, almost 1 order of magnitude lower than the first one. These two phases correspond to 68.5 and 25.8 kcal/mol, respectively. Channel gating has usually a Q10 of ≈3, a value close to the Q10 of the shallower phase of the TPRM8 channel. The system saturates at ≈10°C.
The second thermodynamical analysis considers that the TRPM8 channel activation is well described by a two-state model: open (O) and closed (C). Defining the equilibrium constant as Keq = O/C, the open probability [P(O)] is
 |
[3] |
Therefore, Keq = P(O)/(1 - P(O)). Because P(O) = I/Imax, we can use the data in Fig. 2 A to obtain the equilibrium constant at 60 mV and any given temperature. Recalling that lnKeq = -(ΔH/RT) + (ΔS/R), ΔH and ΔS for the channel opening can be obtained easily from a ln(Keq) vs. 1/T temperature plot or van't Hoff plot, as shown in Fig. 2C. This plot shows again the two regimes for temperature dependency, with their corresponding ΔH and ΔS values. The activation process observed between 27°C and 18°C shows large transitional changes with an entropy change of -384 cal·mol-1·K-1 and enthalpy change of -112 kcal·mol-1. After this activation phase, there is a shallower, less temperature-dependent phase with entropy and enthalpy changes of -210 cal·mol-1·K-1 and -60 kcal·mol-1, respectively. As expected from the high temperature dependency, the enthalpy changes for channel opening are high. However, the free energy changes (ΔG) are maintained at low levels due to the high entropic contribution (Fig. 2D). The change in entropy (ΔS) is negative, meaning that the closed state has a greater entropy (is more disordered) than the open state. It is worthwhile to note that voltage-dependent Na+ channels (23) and Shaker K+ channels (24, 25) also have a negative ΔS for the closed-to-open transition.
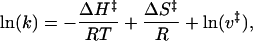
As a third thermodynamic analysis of the TRPM8 channel, we studied the macroscopic kinetics of channel opening and closure. Both the activation and deactivation of the macroscopic currents exhibit a double exponential time course (Fig. 6). In particular, a double exponential time course for the deactivation process implies the existence of more than one open state or that we are in the presence of a closed-closed-open kinetic scheme where the closed-to-open rate constant is not zero (e.g., ref. 26). Because the fast component was neither voltage- or temperature-dependent, only the slow component was used for the analysis. Activation and deactivation rates were obtained from the inverse of the time constant (τ) of the slow component. The temperature dependence of the activation and deactivation rates is shown in Fig. 2 E and F. From these Arrhenius plots, where the rates are plotted against 1/T, we can obtain activation and deactivation enthalpies, ΔH‡, by using the relationship
 |
[4] |
where k is either the activation rate (1/τactivation) or the deactivation rate (1/τdeactivation), ΔS‡ is the activation or deactivation entropy, and ν‡ is the prefactor of the rate (16). Differentiating Eq. 4 with respect to 1/T we have dln(k)/d(1/T) = -ΔH‡/R. The activation and deactivation ΔH‡ are 3 kcal·mol-1 and 24 kcal·mol-1, respectively, corresponding to approximate Q10 values of 1.4 and 3.8 (at room temperature). This means that the rate-limiting step for channel kinetics has much lower temperature dependence than the activation of the channel. Fig. 2 E and F also show that channel kinetics is weakly voltage-dependent. This finding was evaluated by fitting τ/V plots to a voltage-dependent function of the form τ = τ0exp(zFV/RT). Activation time constant is virtually voltage independent (z = 0.05), and deactivation time constant has a z = 0.25 (Fig. 7).
Voltage- and Temperature-Dependent Activation of TRPM8. The TRPM8 channel is activated not only by decreasing temperature but also by membrane depolarization. As shown in Fig. 1 D and E, the membrane potential has an obvious effect on temperature dependence, affecting the temperature threshold for activation. To better understand the interaction between voltage- and temperature-dependence of TRPM8, we studied the steady-state voltage activation at fixed temperatures. Fig. 3A shows families of macroscopic current traces obtained from the same whole cell patch at 10°C, 20°C, and 31°C. The current magnitude increases when the temperature is decreased, and Fig. 3B shows that the steady-state current magnitude at 160 mV increases >2-fold when the patch is cooled from 31°C to 10°C. At all of the temperatures studied, there is a strong outward rectification of the steady-state current. Fig. 3 C and D show that, after a depolarizing pulse, the instantaneous tail current follows an ohmic relationship with respect to voltage, and that temperature does not affect this behavior. The outward rectification must therefore come from a genuine voltage-dependent gate similar to that of other voltage-dependent channels.
Fig. 3.

Electrophysiological characterization of TRPM8 channels. (A) Whole cell recordings of a cell exposed to the indicated temperatures. The voltage protocol is shown in the top of the figure. (B) Steady-state currents of the recordings shown in A.(C) Instantaneous current protocol for TRPM8. The cell was exposed to a 120-mV depolarizing potential pulse and then pulsed to voltages between 160 and -130 mV in 10-mV increments. Macroscopic tail currents elicited by voltages in the range of -20 to -130 mV were fitted with a double exponential function (red dotted line) to obtain the instantaneous current (Inset). (D) Instantaneous current-voltage plots obtained at 30°C and 14°C. (E) Voltage-activation curves obtained at different temperatures by plotting the tail currents obtained at the indicated voltages. (F) Effect of temperature on the normalized conductance (G/Gmax)-voltage curves. Each point represents the average of at least nine different determinations. In E and F, solid lines are best fits to a Boltzmann function (see text).
A more precise quantification of open probability is obtained from the tail currents, plotted against activation voltage in Fig. 3E. These plots are well fitted by a Boltzmann distribution of the form I = Imax/(1+ exp - [zF(V - V0.5)/RT]), where z is the voltage dependency, V0.5 is the half-activation voltage, and Imax is the maximum tail current. F, R, and T have their usual meanings. Imax = I × N × P(O)max, where i is unitary current, N is the number of channels, and P(O)max is the maximum open probability that can be achieved at large depolarizing voltages. When the tail currents are plotted as I/Imax (Fig. 3F), it can be seen that, below 20°C, the curves are left-shifted. Above 20°C, there is little change in the V0.5 of the curves, despite the fact that the tail currents keep increasing in the temperature range between 31°C and 20°C. This tail current increase between 31°C and 20°C must come from an increase in Imax, reflecting a change of either the maximum open probability [P(O)max], the number of channels in the patch (N), and/or the unitary current (i).
To address whether temperature changes P(O)max, I, and/or N, we directly measured open probability at 120 mV by using single channel recordings for high temperatures and nonstationary noise analysis for the whole temperature range (21, 22). Both the noise analysis (n = 15) (Fig. 4 A and B) and the single channel (n = 6) (Fig. 4C) data show that temperature effectively changes the P(O)max at 120 mV, even at ranges where there is little change in the V0.5 of the G/V relationships. Neither the number of channels nor the unitary conductance was changed significantly by decreasing the temperature. Measured unitary conductance was ≈60 pS at 10°C and ≈75 pS at 30°C, similar to the 80 pS reported previously (4). Fig. 4D shows the P(O) plotted as a function of temperature. To build the plot, we used noise analysis data for the whole range of temperatures, and single channel data to resolve lower probabilities. This was done because noise analysis is based on parabolic fitting to the data, and the fitting became stronger and more reliable when the P(O) > 0.5.
Fig. 4.

Determination of the maximum open probability,  , by using variance analysis and single channel current records. (A and B) Plots of variance vs. mean current obtained from whole cell recordings of different cells at different temperatures. Data were fit to a parabola (solid line, Eq. 1) where the single channel amplitude, i, and the number of channels, N, were left as free parameters.
  was obtained by using the relationship
  . (C) Single channel recordings obtained from the same patch at different temperatures between 20°C and 30°C. Current graphs are shown at right. Red solid lines are fits to the data by using two Gaussians distributions. (D) Open probability, P(O), vs. temperature plot summarizing data from noise analysis and single channel. P(O) values for 29°C, 24°C, and 22°C from single channel data (filled circles) were used for the Boltzmann fitting shown (dashed line). Open circles are
  obtained from variance analysis.
Although 120 mV is not enough to reach the maximum open probability, the obtained P(O) values forced us to normalize the G/V plots and express them as an actual open probability. Because the V0.5 value for any given temperature had a great variation between different patches, we averaged P(O)/V curves by displacing the points in the voltage axis (see Methods), preserving the form of the curves. Fig. 5B shows averaged P(O)/V curves, and Fig. 5C shows the same curves normalized by P(O)max. In Fig. 5 D and E, P(O)max, V0.5, and z values are plotted against temperature. Again, between 30°C and 20°C, the main effect is a change of P(O)max, with little or no change of the V0.5 value. Below 20°C, both values change, until the effect apparently saturates at ≈10°C. The voltage dependence of activation, measured as the z value (0.64 ± 0.1) of the Boltzmann distribution or the slope of the curve, changes little with temperature.
Fig. 5.

Fit of averaged P(O)-V curves to an allosteric gating scheme. (A) Allosteric model for activation by voltage and temperature. See text for details. (B) Averaged P(O) (symbols) plotted against voltage for the indicated temperatures. Lines are the simultaneous best fit to Eq. 5.(C) Same data as in A plotted as P(O)/P(O)max. (D) Plot of maximum open probability [P(O)max] and voltage dependency (z) against temperature. (E) Plot of half-activation voltages (V0.5) against temperature. In D and E, symbols are experimental data (mean ± SEM) and the continuous line is the prediction from the best fit to Eq. 5. (F) Theoretical current vs. temperature curves for the indicated holding potential, calculated as P(O) × g × V × N. P(O) is the open probability calculated from the model, g is unitary conductance (70 pS), V is membrane holding potential, and N is number of channels (assumed to be 100).
Discussion
In most channels the gating processes have Q10 values of ≈3, with some notable exceptions. In Shaker K+, channel inactivation is highly temperature-dependent (27). The inactivation rate increases with increasing temperature with a Q10 of 7, a result that has been interpreted in terms of a temperature-induced stabilization of some structure(s) of the inactivating peptide able to bind much more strongly to the channel than the other structures that the peptide can adopt (27, 28). It is difficult to imagine that a similar mechanism can explain the temperature sensitivity of TRPM8 channels, because the rates of activation or deactivation have lower Q10 values (≤3) than the overall channel gating (Q10 ≈ 23). The slow gating of the ClC0 channel shows a very strong temperature dependence (Q10 ≈ 40), and this result has been interpreted in terms of a coupling of the slow gate with channel subunit interaction (29). In general, high Q10 for channel gating is compatible with large rearrangements of the protein induced by temperature. What makes the TRPM8 channel special is that, unlike the cases described above, in which rates of opening or closing are greatly affected, temperature mainly modifies equilibrium parameters of the activation pathway of TRPM8. In particular, temperature induces large changes in the maximum probability of opening and the half voltage.
Possible Molecular Origin of the Large ΔH and ΔS Changes. The thermodynamic analysis of TRPM8 shows that this protein undergoes highly temperature-dependent rearrangements. The opening of the channel is accompanied by large enthalpy and entropy changes, although with low free energy changes that ensure the reversibility of the process. On the basis of the data presented here, we discuss below the possible molecular origin of the large ΔH and ΔS changes.
The most plausible explanation for the effect of temperature on the TRPM8 channel considers the existence of a temperature-sensing domain, a “temperature sensor” that would suffer large structural rearrangements upon temperature changes. It is interesting to recall that protein denaturation is also a process highly temperature-dependent, characterized by large entropic and enthalpic changes, whereas ΔG is relatively small (for example, see ref. 29). This is another case in which a highly temperature-dependent process takes place only because the large enthalpic change is compensated by a large change in entropy. The fact that denaturation can be induced by heat and by cold (30, 31) suggests that it is possible that, in the TRPM8 channel, certain specialized regions of the channel suffer severe rearrangements by cold, whereas in VR1 channels (20) the rearrangements of this hypothetical “temperature sensor” are driven by heat. This behavior is a peculiarity of protein thermodynamics, where both enthalpies and entropies of denaturation decrease upon a drop in temperature, and at some point they become zero and then change their sign (29, 31). In such a scenario, changing the temperature at which these parameters become zero could produce a channel activated by cold or one activated by heat. Hydrophobic interactions are entropically driven, and negative values of ΔS obtained for this process may suggest that there is a net loss of hydrophobic interactions in the closed-to-open transition by temperature. For example, we can visualize that, during the process of opening, an exposure to solvent of aliphatic and aromatic groups takes place. Restricting the temperature sensing to a discrete domain ensures the stability of the protein; otherwise the whole channel would “denature” by cold or heat.
A Model of Channel Activation by Voltage and Temperature. A recently published study by Voets et al. (32) describes the voltage and temperature dependence of the TRPM8 channel. We would like to point out here that our results differ from those of Voets et al. (32) in several important aspects. We found that the voltage dependence of the activation and deactivation rates does not account for the voltage-dependence of the channel. Also, the temperature dependence of the deactivation rate (Q10 = 3.8) is much smaller than the temperature dependence of the steady-state macroscopic currents (Q10 = 24). Therefore, neither the voltage- nor the temperature-dependence is contained in the activation or deactivation rates. This and the existence of two exponential components in the decay of the current make our results incompatible with a two-state model. The data presented here pose other restrictions that have to be accounted for. First, the existence of weakly voltage-dependent or -independent transitions between open and closed states needs to be postulated; otherwise, an open probability of 1 would always be reached at sufficiently high depolarizing pulses regardless of the temperature. Second, a decrease in temperature must increase the maximum open probability and must not affect the half-activation voltage until some threshold temperature is reached. Finally, the study of channel kinetics showed that there must be a rate-limiting step that is essentially voltage-independent and has low temperature dependence.
We found that a simple way to explain the data is to use an allosteric activation mechanism for both voltage and temperature. In this model, the activation of both sensors (voltage and temperature) and channel opening constitute three separate two-state equilibriums that interact allosterically with each other. These equilibria can be represented as a cubic eight-state kinetic model (Fig. 5A). In absence of stimuli (e.g., at low voltages and high temperature), the channel is confined to the equilibrium between states C0 and O0, with a small equilibrium constant L that makes channel opening very improbable. The equilibrium between states C0 and C1 represents the activation of voltage sensors and is governed by the voltage-dependent constant J. These two equilibria are coupled by the allosteric factor D, so that when voltage sensors are active, the opening of the channel (equilibrium between states C1 and O1) has a higher equilibrium constant, L × D. When the channel is open, the activation of voltage sensors (O0-O1 equilibrium) is J × D. Therefore, when the temperature is high the maximum open probability achievable by depolarization will be determined by the LD value. The equilibrium between states C0 and C2 represents the activation of temperature sensors and is governed by the temperature-dependent constant K. K is increased when the temperature is lowered. Activation of the temperature sensor is coupled to channel opening by the allosteric factor C, thus completing the cube depicted in Fig. 5A. In this way, when both stimuli (voltage and low temperature) are present, the open probability will be determined by the LCD value, the equilibrium constant between states C3 and O3.
We note that, being a homotetramer, the channel is likely to contain four voltage sensors. However, because there is no evidence about their molecular nature and whether they move independently, we are making a simplifying assumption that the voltage sensors move in concert. The existence of the temperature- and voltage-independent C-O transitions in the allosteric model allow the rate-limiting steps for channel kinetics to have lower temperature and voltage dependence than the steady-state open probability. Finally, the existence of several kinetic paths for channel activation and deactivation would explain the two exponential components of the current traces.
The equation for the open probability at any temperature and membrane potential is
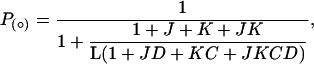 |
[5] |
where J = J0exp(zFV/RT) and K = exp(-(ΔH - TΔS)/RT). J0 is the equilibrium constant for the C0 to C1 transition at 0 mV, z is the voltage dependency for this constant, V is membrane potential, and T is absolute temperature. ΔS and ΔH represent the difference of entropy and enthalpy between C1 and C2 states, respectively, R is the universal gas constant, and F is Faraday′s constant.
We selected four averaged and normalized P(O)/V curves corresponding to 31°C, 22°C, 18°C, and 10°C, to be simultaneously fitted to Eq. 5. The best fit was obtained with the following parameters: L = 1.44 × 10⁻⁴, J0 = 0.15, z = 0.6, D = 1,000, C = 3,047, ΔH = -48 kcal/mol, and ΔS = -177 cal/(mol × K). Continuous lines in Fig. 5 B and C show the best fit found by least-squares. In Fig. 5 D and E, the lines are the prediction of P(O)max, z, and V0.5 as a function of temperature, and Fig. 5F shows simulated current vs. temperature curves at different holding potentials. Thus, the allosteric model can reproduce the steady-state behavior on TRPM8 over a wide range of conditions, with the assumption that activation of voltage sensors and temperature sensors additively affect the energy of the C-O transition. This model also gives transitional energies (see above) very similar to those obtained from the van't Hoff plot. It is important to notice that the model is very sensitive to changes in these parameters.
It is noteworthy that an allosteric linkage between voltage sensor movement and channel opening, as opposed to a strict coupling, has been proposed for another channel activated by two stimuli, the high conductance, Ca2+- and voltage-activated potassium (BK) channel. Detailed analysis of the voltage- and calcium-dependence of the BK channel showed that neither Ca2+ nor voltage is strictly necessary for channel activation, and that both stimuli can act independently of each other (e.g., refs. 33 and 34). The present results indicate that neither temperature nor voltage is strictly necessary for TRPM8 channel activation and that they can be understood in an allosteric voltage- and temperature-gating kinetic scheme. Therefore, it is possible that, in the same way the voltage sensor of voltage-dependent channels converts the energy store in the membrane electric field into mechanical work, a temperature sensor in thermo-TRP channels converts thermal energy into mechanical work.
Supplementary Material
Acknowledgments
We thank M. Castro and Dr. O. Alvarez for experiment design contribution and interesting discussions, and S. Ramsey and H. Xu for fruitful discussions. S.B. is recipient of a Comisión Nacional de Investigaciones Científica y Tecnológica doctoral fellowship. R.L. was supported by Chilean Grant Fondo Nacional de Investigaciòn Científica y Tecnològica 103-0830. Centro de Estudios Científicos is a Millennium Institute and is funded in part by a grant from Fundación Andes.
Author contributions: S.B., P.O., and R.L. designed research; S.B. performed research; S.B., P.O., and R.L. analyzed data; and S.B., P.O., and R.L. wrote the paper.
Abbreviation: TRP, transient receptor potential.
References
- 1.Caterina, M. J., Schumacher, M. A., Tominaga, M., Rosen, T. A., Levine, J. D. & Julius, D. (1997) Nature 389, 816-824. [DOI] [PubMed] [Google Scholar]
- 2.Caterina, M. J., Rosen, T. A., Tominaga, M., Brake, A. J. & Julius, D. (1999) Nature 398, 436-441. [DOI] [PubMed] [Google Scholar]
- 3.Xu, H., Ramsey, I. S., Kotecha, S. A., Moran, M. M., Chong, J. A., Lawson, D., Ge, P., Lilly, J., Silos-Santiago, I., Xie, Y., et al. (2002) Nature 418, 181-186. [DOI] [PubMed] [Google Scholar]
- 4.McKemy, D. D., Neuhausser, W. M. & Julius, D. (2002) Nature 416, 52-58. [DOI] [PubMed] [Google Scholar]
- 5.Guler, A. D., Lee, H., Iida, T., Shimizu, I., Tominaga, M. & Caterina, M. (2002) J. Neurosci. 22, 6408-6414. [DOI] [PMC free article] [PubMed] [Google Scholar]
- 6.Peier, A. M., Reeve, A. J., Andersson, D. A., Moqrich, A., Earley, T. J., Hergarden, A. C., Story, G. M., Colley, S., Hogenesch, J. B., McIntyre, P., et al. (2002) Science 296, 2046-2049. [DOI] [PubMed] [Google Scholar]
- 7.Peier, A. M., Moqrich, A., Hergarden, A. C., Reeve, A. J., Andersson, D. A., Story, G. M., Earley, T. J., Dragoni, I., McIntyre, P., Bevan, S., et al. (2002) Cell 108, 705-715. [DOI] [PubMed] [Google Scholar]
- 8.Story, G. M., Peier, A. M., Reeve, A. J., Eid, S. R., Mosbacher, J., Hricik, T. R., Earley, T. J., Hergarden, A. C., Andersson, D. A., Hwang, S. W., et al. (2003) Cell 112, 819-829. [DOI] [PubMed] [Google Scholar]
- 9.Moran, M. M., Xu, H. & Clapham, D. E. (2004) Curr. Opin. Neurobiol. 14, 362-369. [DOI] [PubMed] [Google Scholar]
- 10.Montell, C., Birnbaumer, L., Flockerzi, V., Bindels, R. J., Bruford, E. A., Caterina, M. J., Clapham, D. E., Harteneck, C., Heller, S., Julius, D., et al. (2002) Mol. Cell 9, 229-231. [DOI] [PubMed] [Google Scholar]
- 11.Kedei, N., Szabo, T., Lile, J. D., Treanor, J. J., Olah, Z., Iadarola, M. J. & Blumberg, P. M. (2001) J. Biol. Chem. 276, 28613-28619. [DOI] [PubMed] [Google Scholar]
- 12.Rosenbaum, T., Awaya, M. & Gordon, S. E. (2002) BMC Neurosci. 3, 4. [DOI] [PMC free article] [PubMed] [Google Scholar]
- 13.Clapham, D. E. (2003) Nature 426, 517-524. [DOI] [PubMed] [Google Scholar]
- 14.Patapoutian, A., Peier, A. M., Story, G. M. & Viswanath, V. (2003) Nat. Rev. Neurosci. 4, 529-539. [DOI] [PubMed] [Google Scholar]
- 15.Behrendt, H.-J., Germann, T., Gillen, C., Hatt, H. & Jostock, R. (2004) Br. J. Pharmacol. 141, 737-745. [DOI] [PMC free article] [PubMed] [Google Scholar]
- 16.Hille, B. (2001) Ion Channels of Excitable Membranes (Sinauer, Sunderland, MA).
- 17.Jordt, S. E. & Julius, D. (2002) Cell 108, 421-430. [DOI] [PubMed] [Google Scholar]
- 18.Hui, K., Liu, B. & Qin, F. (2003) Biophys. J. 84, 2957-2968. [DOI] [PMC free article] [PubMed] [Google Scholar]
- 19.Ryu, S., Liu, B. & Qin, F. (2003) J. Gen. Physiol. 122, 45-61. [DOI] [PMC free article] [PubMed] [Google Scholar]
- 20.Liu, B., Hui, K. & Qin, F. (2003) Biophys. J. 85, 2988-3006. [DOI] [PMC free article] [PubMed] [Google Scholar]
- 21.Sigworth, F. J. (1980) J. Physiol. 307, 97-129. [DOI] [PMC free article] [PubMed] [Google Scholar]
- 22.Alvarez, O., Gonzalez, C. & Latorre, R. (2002) Adv. Physiol. Ed. 26, 327-341. [DOI] [PubMed] [Google Scholar]
- 23.Correa, A. M., Bezanilla, F. & Latorre, R. (1992) Biophys. J. 61, 1332-1352. [DOI] [PMC free article] [PubMed] [Google Scholar]
- 24.Rodriguez, B. M., Sigg, D. & Bezanilla, F. (1998) J. Gen. Physiol. 112, 223-242. [DOI] [PMC free article] [PubMed] [Google Scholar]
- 25.Rodriguez, B. M. & Bezanilla, F. (1996) Neuropharmacology 35, 775-785. [DOI] [PubMed] [Google Scholar]
- 26.Bezanilla, F., Perozo, E. & Stefani, E. (1994) Biophys. J. 66, 1011-1021. [DOI] [PMC free article] [PubMed] [Google Scholar]
- 27.Nobile, M., Olcese, R., Toro, L. & Stefani, E. (1997) Exp. Brain Res. 114, 138-142. [DOI] [PubMed] [Google Scholar]
- 28.Murrell-Lagnado, R. D. & Aldrich, R. W. (1993) J. Gen. Physiol. 102, 977-1003. [DOI] [PMC free article] [PubMed] [Google Scholar]
- 29.Pusch, M., Ludewig, U. & Jentsch, T. J. (1997) J. Gen. Physiol. 109, 105-116. [DOI] [PMC free article] [PubMed] [Google Scholar]
- 30.Richardson, J. M., III, Lemaire, S. D., Jacquot, J. P. & Makhatadze, G. I. (2000) Biochemistry 39, 11154-11162. [DOI] [PubMed] [Google Scholar]
- 31.Privalov, P. L. (1989) Annu. Rev. Biophys. Biophys. Chem. 18, 47-69. [DOI] [PubMed] [Google Scholar]
- 32.Voets, T., Droogmans, G., Wissenbach, U., Janssens, A., Flockerzi, V. & Nilius, B. (2004) Nature 430, 748-754. [DOI] [PubMed] [Google Scholar]
- 33.Rothberg, B. S. & Magleby, K. L. (1999) J. Gen. Physiol. 114, 93-124. [DOI] [PMC free article] [PubMed] [Google Scholar]
- 34.Horrigan, F. T. & Aldrich, R. W. (2002) J. Gen. Physiol. 120, 267-305. [DOI] [PMC free article] [PubMed] [Google Scholar]
Associated Data
This section collects any data citations, data availability statements, or supplementary materials included in this article.