

Abstract
Gaucher disease (GD) leads to accumulation of glucosylceramide (GL1) and its deacylated lysolipid, glucosylsphingosine (lyso-GL1) which is implicated in mediating immune dysregulation and skeletal disease. The aim of our study was to assess plasma Lyso-GL1 as a biomarker of GD and its response to therapy.
Plasma lyso-GL1 in 169 patients with GD type 1 (GD1) was measured by LC-MS/MS. Significant predictors of were assessed by Pearson’s correlation coefficient, Wilcoxon Mann Whitney test and multiple linear regression. Propensity scores were used to match patients on treatment mode: Enzyme Replacement Therapy (ERT) vs Eliglustat Tartrate SRT (ELI-SRT).
Lyso-GL1 levels in healthy controls on average was 1.5 ng/ml (1.3 – 1.7; 95% CI). In untreated GD patients, the levels were massively elevated (180.9 ng/ml: 95% CI, 145.4 – 216.5) and ERT resulted in marked reduction (89 ng/ml: 95% CI, 69.2 – 129.4) (p<0.001). Lyso-GL1 correlated with chitotriosidase (r=0.59 p<0.001), CCL18 (r= 0.62 p <0.001), hepatomegaly (r=0.28 p<0.001), splenomegaly (r=0.27 p=0.003), splenectomy (p=0.01) and treatment mode (p<0.001). By multiple linear regression, the strongest predictors of lyso-GL1 were age (p<0.001), splenectomy (p=0.02), Chitotriosidase (p<0.001) and CCL18 levels (p=0.001). After propensity score matching to obtain comparable groups of patients on ERT vs ELI-SRT, lyso-GL1 levels were lower among patients receiving ELI-SRT by 113 ng/ml (95% CI: 136 – 90.3 ng/ml p<0.001).
Plasma lyso-GL1 is a key biomarker of GD. ERT reduced lyso-GL1 levels. By propensity scoring, ELI-SRT resulted in greater reduction of lyso-GL1 than ERT.
Keywords: Glucosylsphingosine, Lyso-glucosylceramide, biomarker, Gaucher Disease
INTRODUCTION
Gaucher Disease is among the most prevalent lysosomal storage disorders affecting ~ 1 in 40,000 individuals in the general population but its frequency is as high as 1:800 in the Ashkenazi Jewish population [1]. The metabolic defect in GD is deficiency of lysosomal acid β-glucosidase (glucocerebrosidase, EC 3.2.1.45) due to biallelic mutations in GBA which results in massive accumulation of glucosylceramide, most conspicuously in lysosomes of macrophages, the eponymous Gaucher cells [2]. Although >400 mutations in GBA have been reported in the Human Gene Mutation Database, N370S is the most commonly reported mutation in the literature, accounting for ~77% of disease mutations in Ashkenazi Jewish GD1 patients and ~ 29% of mutations in non-Jewish patients [3, 4]. Common manifestations of GD include growth failure, hepatosplenomegaly, anemia, thrombocytopenia, and a complex pattern of skeletal disease. GD is classified into 3 broad clinical phenotypes based on presence or absence of early-onset neurodegenerative disease: the most common is GD type 1 (GD1), which is not associated with early onset neurodegenerative disease; and GD2 and G3, characterized by additional fulminant or chronic neurodegenerative disease, respectively [5]. The pathways linking the accumulation of GL1 to the diverse clinical phenotypes and disease manifestations have not been fully delineated [6]. Although glucosylceramide is the primary lipid that accumulates in tissues of GD patients, there is accompanying massive elevation of its deacylated lysolipid, lyso-GL1, considered to play a primary role in neuronal injury accompanying GD2 and GD3 [7, 8]. Recently however, lyso-GL1 has been shown to mediate several key features of GD1, namely immune dysregulation and skeletal disease [9–12]. As GL1 accumulates in the lysosomes in GD, it is deacylated by acid ceramidase to form lyso-GL1, a more soluble lipid that exits the lysosomal system to cause wide-spread pathophysiological effects [13–15]. Lyso-GL1 is a potent antigen for CD1d-restricted NKT cells and triggers B cell proliferation and metabolic inflammation, which underlie GD pathophysiology [10, 12]. In addition, lyso-GL1 mediates osteoblastic dysfunction which results in osteopenia [11].
Assessment of GD activity and disease burden to determine indication for treatment and to monitor response to treatment can be challenging due to heterogeneous organ involvement and inability to assess pathological Gaucher cell infiltration by imaging. Traditionally, evaluation of GD is based on indirect surrogate markers such as liver volume, spleen volume, hemoglobin, platelets, plain radiology and MRI characteristics of the bone marrow [16]. Hence it is necessary to validate biomarker(s) that are pathologically relevant and reliably predict meaningful outcomes in the clinic to guide personalized. The properties of an ideal biomarker for GD should fulfill each of these characteristics: specificity to GD, a direct role in pathophysiology, absence of genetic variation, reliable change in response to therapy and it should be applicable to all patients. The established biomarker of GD is chitotriosidase, an orthologue of the chitinase family, which is elevated several hundred-fold in GD [17]. However, ~10% of patients with GD have no measurable chitotriosidase activity due to homozygosity for a prevalent polymorphic null allele and ~33% are heterozygote for this CHIT1 SNP, which manifests as half-normal serum levels [18]. Moreover, expression of GD symptoms is not altered in patients harboring homozygous CHIT1 null allele. An alternative biomarker, a chemokine CCL18 has been validated and it is used in some centers [19, 20].
The accumulation of lyso-GL1 in patients with GD was first reported over 40 years ago [8, 14, 21–25]. Initial reports demonstrated 100–1000 fold elevations of lyso-GL1 levels in grey matter of neuronopathic GD patients and discussed potential neurotoxic effects of lyso-GL1[21]. More recent studies reported elevated lyso-GL1 levels in tissues of GD1 patients and described its pathophysiological role in immune dysregulation and skeletal disease in GD1 [9, 10, 12]. Recently, we and others reported marked elevations of plasma lyso-GL1 in patients with GD1 that decrease following ERT and correlated with some indicators of disease activity [14, 24].
The aim of our present study was to assess the utility of lyso-GL1 as a pathophysiologically relevant biomarker in GD1. A cohort of 169 GD1 patients on therapy were studied. Of these 155 patients were on macrophage-targeted enzyme replacement therapy (ERT) and 14 patients were on eliglustat tartrate SRT (ELI-SRT). Plasma lyso-GL1 levels were markedly elevated in GD1. A cutoff of 4 ng/ml yielded 100% sensitivity and specificity in distinguishing between GD patients and healthy controls through receiver operating characteristics (ROC) curve analysis. In the ERT cohort, 41 patients were followed longitudinally from baseline prior to initiation of therapy and subsequently after initiation of imiglucerase ERT. In these treatment-naïve patients, imiglucerase resulted in mean 49% decrease in plasma lyso-GL1 levels after mean treatment period of 3.6 years. Follow up on long-term imiglucerase ERT showed levels of lyso-GL1 decrease by half in the second year and by one third in the third year of treatment. Lyso-GL1 plateaued to 13.5-fold elevation by year five. Plasma lyso-GL1 levels correlated with other indicators of disease severity, chitotriosidase (r=0.59 p<0.001), CCL18 (r= 0.62 p <0.001), liver volume (r=0.28 p< 0.001) and spleen volume (r=0.27 p=0.003), age (r = −0.22 p<0.001), splenectomy (i.e., it was higher in asplenic patients than in patients with intact spleen, p = 0.01) and treatment with ELI-SRT (p < 0.001). Multiple regression analysis was performed to identify independent predictors of lyso-GL1. The strongest independent predictors of lyso-GL1were age (negative correlation, p<0.001), serum chitotriosidase (p<0.001), CCL18 levels (p=0.001), splenectomy (p=0.02) and treatment with eliglustat SRT, ELI-SRT (p < 0.001). To determine biomarker response by mode of therapy (ERT vs ELI-SRT), we matched patients receiving ERT vs ELI-SRT by propensity scoring. ELI-SRT was associated with greater reduction of lyso-GL1 levels that ERT by mean of 113 ng/ml (136 – 90.3 ng/ml 95% CI p<0.001).
MATERIALS & METHODS
Patients
One hundred and sixty nine patients with GD1 consented to participate in the study. All patients were confirmed to have GD by low leukocyte levels of lysosomal acid β-glucosidase activity and the presence of GBA mutations. The study was approved by the institutional review boards of Yale University School of Medicine and New York University School of Medicine. Patients underwent standard of care imaging studies to assess spleen volume, liver volume (results expressed as multiples of normal) and skeletal lesions to monitor their disease progression. Normal liver volume was 2.5% body weight and normal spleen volume 0.2% body weight [26]. Data to determine the burden of Gaucher disease was compiled for each patient, including Hermann Score [27], Bone Marrow Burden Score (BMB) [28], Severity Score Index (SSI) and Disease Severity Scoring System (DS3) [29] as described previously. In the cohort of ERT treated patients, baseline plasma samples before initiation of ERT were available in 41 patients and subsequent samples on imiglucerase ERT were available in these patients. In the remaining 114 patients, baseline samples were not available but samples were obtained while already receiving ERT (60% on imiglucerase, 40% on velaglucerase ERT) with duration of therapy ranging from 1 – 19 years. In the ELI-SRT cohort, 14 patients were on treatment with ELI-SRT with duration of therapy ranging from 1–3.5 years.
LC-MS/MS Assay for Lyso GL1
For sample preparation, 25 pg of internal standard (N, N-Dimethylsphingosine-Matreya, Pleasant Gap, and PA) was added to a 2.0 mL Eppendorf tube and dried under nitrogen gas. Twenty µL plasma and 1000 µL chloroform: methanol (2:3) was added to the tube, which was then mixed by vortexing for 5 minutes and centrifuged for 3 minutes at 16,000xg. The supernatant was then transferred to a new Eppendorf tube. Two hundred µL chloroform and 520 µL water were added to the tube to perform liquid–liquid extraction. The solution was vortexed 3 minutes, centrifuged at 16,000xg for 3 minutes, and the lower phase was transferred to an auto-sampler vial. The upper phase was re-extracted with chloroform and the lower phase was added to the previous lower phase in the auto-sampler vial. The contents of the vial were dried with nitrogen gas and reconstituted in 100 uL methanol: water (9:1) for liquid chromatography coupled to tandem mass spectrometry (LC-MS/MS) analysis. A calibration curve was prepared using the same procedure as the sample preparation described above using lyso-GL1 standard (Matreya, Pleasant Gap, and PA) and internal standard.
Reconstituted samples were injected into an LC–MS/MS system [Waters Acquity UPLC and an API-5000 triple-quadrupole mass spectrometer]. Separation of lyso-GL1 and other matrix components was achieved using an Acquity BEH C18 column (2.1x50 mm, 1.7 µm column) under gradient conditions with mobile phase A (0.1 % formic acid in water) and mobile phase B (0.1 % formic acid in acetonitrile). Mass spectrometry (MS) was performed in select ion monitoring mode with the following transitions: m/z 462.5> 282.4 for lyso-GL-1 and m/z 490.3 > 292.4 for N, N-Dimethylsphingosine.
Chitotriosidase activity assay
Chitotriosidase activity assay was performed as described [30] with minor modification. Briefly, serum samples were diluted with dH2O to 1:10, 1:20, and 1:50. Healthy control samples were not diluted. Five µL of each diluted sample was added to 50 µL of 4MU-Chitotrioside (Sigma Aldrich, St Louis, MO) that was pre-diluted to 22 nM in Mcilvaine Buffer (0.1M Citric acid, 0.2M Na2HPO4, pH 5.2). Samples were incubated at 37°C for 30 min. Reactions were quenched by adding 0.5 mL stop buffer (0.3M glycine-NaOH, pH 10.6). One hundred µL of each reaction was transferred to a black flat-bottomed plate and the enzyme activity was measured at 366nm (excitation)/445nm (emission). A standard curve of β-Methylumbelliferone (4MU, Sigma Aldrich. St Louis, MO) was included in each plate.
CHIT 1 genotyping
Genomic DNA from GD patients and health controls were extracted using Qiagen’s DNA isolation kit (Valencia, CA). Following primers were used to amplify the CHIT 1 fragment containing the possible 24-bp duplication: CHIT1F CAG CTA TCT GAA GCA GAA GG, and CHITR1 GAG AAG CCG GCA AAG TC. PCR reaction was performed using the AmpliTaq Gold DNA Polymerase system (Thermo Fisher Scientific, Waltham, MA) at the conditions of 95°C −60°C −72°C for 35 cycles. The amplified DNAs were separated on an agarose gel containing 2% Agarose GPG/LE (Amerianbio, Natick, MA) and 2% LMP Agarose (Thermo Fisher Scientific). In the presence or absence of the extra 24 bps, the band size is either 99bp or 75bp.
CCL18 Enzyme-Linked Immuno Sorbent Assay (ELISA)
The CCL18 protein levels in sera from GD patients were assayed according to the protocol provided in the DuoSet CCL18/PARC Kit (R&D System, MN). Briefly, 96-well microplates (Greiner Bio-One) were coated overnight at 4°C with a 1:180 dilution of the Capture Antibody in PBS. The coating solution was aspirated and the wells were washed three times with Wash Buffer (0.05% Tween 20 in PBS, pH 7.2-7.4) and blocked with 300 µL /well of Block Buffer (1% BSA in PBS) for 1hr at room temperature. Wells were washed three times with the Wash Buffer. 100ul/well of samples (duplicated 2ul of plasma diluted at 1:5, 1:10 and 1:20 plus 98ul/well of 10% BSA-PBS) were added and the plates were incubated at RT for 1.5-2hr. Serial dilutions (1:25, 1:50, 1:100, and 1:200) of rhCCL18 with Reagent Diluent were used for the standard curve. After incubation and washes, 100ul/well of the Detection Antibody (final concentration of 1:180 in Reagent Diluent) was added to each well and incubated for 1.5hr RT. After three washes, the plates were incubated with 100ul/well of 1:200 (0.5% BSA in PBS) diluted Streptavidin-HRP for 20 minutes RT followed by three more washes. Finally, 100 ul/well of Stop Solution (2 N H2SO4) were added to stop the reaction and Absorbance was measured at 450nm using a SpectraMax Plus micro-plate reader (Molecular Devices, CA). Previously identified samples with high, middle and low CCL18 levels were used as an internal control in all assays.
Liver Volume and Spleen Volume / Splenectomy Status ordinal scale
The liver volume was categorized into ordinal scale with volume <1.25×multiples of normal (MN) = 1, 1.25 – 1.5×MN = 2, 1.5 – 2.5×MN= 3 and > 2.5×MN = 4. Similarly spleen volume of <2×MN = 1, 2–5×MN = 2, 5 – 15×MN = 3, > 15×MN = 4 and splenectomy = 5.
Statistical Analysis
Non parametric Wilcoxon Mann Whitney test for unpaired and Wilcoxon signed rank test for paired samples were used to compare for the difference in numerical measurements between untreated, treated and healthy controls as the distribution was not normal. In univariate analysis, Pearson’s correlation coefficient was used correlate lyso-GL1 against continuous variables after log-transformation to achieve normal distribution. Wilcoxon Mann Whitney test was used to compare lyso-GL1 levels in patients stratified by spleen and treatment status. Multiple linear regression model was constructed with the outcome as the continuous variable, lyso-GL1 to assess candidate predictor variables (continuous or categorical) of Gaucher disease burden i.e., age, gender, spleen volume/splenectomy ordinal scale, liver volume ordinal scale, serum chitotriosidase, serum CCL18, hemoglobin levels and platelet counts and treatment status (either ELI-SRT or ERT) after log transformation for normal distribution. The validity of the final model was tested for normal distribution of residuals through standardized normal probability (P-P) plot and Q-Q plot. The model was also tested for heteroscedasticity through residual versus fitted plot and White’s test and for multicollinearity through variance inflation factor values of >10.
To analyze the average treatment effect of ELI-SRT on Lyso-GL1 levels and to limit potential confounding by indication, propensity scoring was utilized to identify comparable groups of patients in the two arms of treatment across relevant variables of disease burden. A logistic treatment model was used to calculate propensity scores using age, spleen volume/ splenectomy status ordinal scale, liver volume ordinal scale, hemoglobin levels, platelet levels, serum chitotriosidase and CCL18 levels. Patients receiving ELI-SRT were individually matched to patients receiving ERT with the closest propensity score using a greedy matching algorithm [31, 32]. Each patient in the ELI-SRT cohort was compared to the nearest neighbor with ratio of 1: 3 matches i.e., every patient receiving ELI-SRT was matched to 3 patients receiving ERT with the closest propensities.
Sensitivity and Specificity analysis to determine the ideal cut off point to distinguish between patients with GD and healthy controls were performed using a receiver operating characteristic (ROC) curve.
RESULTS
Demographic Description
169 patients in total enrolled in our study and were divided into two cohorts of patients. The first cohort consisted of 155 patients on ERT. Of these we had baseline samples before initiation of ERT in 41 patients and subsequent samples after therapy was initiated. In 114 patients, baseline samples were not available but samples were drawn after patients were already on ERT for variable periods. The second cohort of 14 patients represented those that contributed samples while receiving ELI-SRT.
The demographics of treatment naïve ERT patients is depicted in Table 1A. Prior of initiation of ERT, the average age was 38.5 years (range 4 – 69 years) at the time of the first sample. At second measurement, the average age was 41 years (range 5–77 years). The mean duration of Imiglucerase ERT at the time of the second post – ERT sample was 3.6 years (range 0.5 – 19 years). Patients exhibited significant burden of visceral disease indicated by mean liver volume 1.8 MN (range: 0.9 – 4) and spleen volume 17.2 MN (range: 0.9 – 45.6) before initiation of Imiglucerase ERT. There was the expected response to imiglucerase ERT with reduction of liver volume to 1.2 (range 0.5 – 3.9 p = 0.09) and spleen volume to 6.1 (range 0.9 – 14 p= 0.01). Hemoglobin at baseline was 122.6 g/L and increased to mean of 135.9 g/L after (p = 0.02). Platelet count 158.7×10⁹/L at baseline and increased to 201.5×10⁹/L after treatment (p = 0.05). SSI, and Herman scores were unchanged as expected and in our study DS3 scores were not impacted by ERT.
Table 1.
| A: Demographic and clinical severity description of cohort 1 of GD patients | |||
|---|---|---|---|
| Baseline Characteristics of Treatment Naïve Patients (n = 41) | |||
| Gender |
Males: 17 (41.4%) N370S / N370S: 14 (34.1%) N370S/Other: 21 (51.2%) Other/Other: 6 (14.6%) 19.1 (0.5 – 54) 21.5 (0.5 – 54) 17 (41.4%) 3.6 (0.5 – 19) |
||
| Genotype | |||
|
Age at First Symptom (years) | |||
| Age at Diagnosis (years) | |||
| Splenectomy | |||
| Treatment (years) | |||
| Before ERT | After ERT | P - value | |
|
Liver Volume (X Normal) |
1.8 (0.9 – 4) | 1.3 (0.6 – 3.9) | 0.09 |
|
Spleen Volume (X Normal) |
17.2 (0.9 – 45.6) | 6.1 (0.9 – 14) | 0.01 |
| SSI | 7.2 (2 – 17) | 7.5 (2 – 17) | 0.97 |
| DS3 | 2.6 (0 – 8) | 2.8 (0 – 8) | 0.89 |
| Herman Score | 3.6 (0 – 5) | 3.6 (0 – 5) | 0.94 |
| Hemoglobin (g/L) | 122.6 (95 – 164) | 135.9 (108 – 172) | 0.02 |
| Platelets (× 109/L) | 158.7 (39 – 364) | 201.4 (44 – 366) | 0.05 |
| Age (years) | 36.8 (4–69) | 44.9 (5–77) | ----- |
|
Serum Chitotriosidase (nm/ml/hour) |
12451.9 (337 – 58707) | 3880.5 (330 – 19433) | <0.001 |
| Serum CCL 18 (ng/ml) | 603.02 (40 – 1240) | 276.7 (49 – 1039) | <0.001 |
| Serum Lyso-GL1 (ng/ml) | 180.9 (14 – 464) | 99.3 (3 – 503) | <0.001 |
| B: Demographic and clinical severity description in cohort 1 & 2 of GD patients | ||
|---|---|---|
| Cohort 1: ERT patients on therapy (n = 114) | Cohort 2: E-SRT patients (14) | |
| Gender | Males = 38.6% | 31.1% |
| Genotype | N370S/N370S = 57.8% | 58.1% |
| Age | 48.3 (4 – 83) | 43.8 (20 – 58) |
| SSI | 6.9 (2 – 17) | 7.0 (3 – 10) |
| DS3 | 2.5 (0 – 8) | 2.3 (0 – 8) |
| Hemoglobin (g/L) | 139.7 (87 – 171) | 134.6 (108 – 171) |
| Platelet (× 109/L) | 168.8 (52 – 796) | 205.7 (73 – 566) |
| Liver Volume × Normal | 0.9(0.5 – 2) | 0.9 (0.6 – 2) |
| Spleen Volume X Normal | 3.3 (0.7 – 14.6) | 2.7 (0.7 – 5.3) |
| Splenectomy | 39 (20.7%) | 17.7% |
| Bone Marrow Burden Score | 5.4 (0 – 16) | 6.2 (3 – 11) |
| Herman Score | 2.6 (1 – 5) | 2.7 (1 – 5) |
| Years in Treatment | 13.7 (.5 – 29) | 1.3 (1 – 3.5) |
|
Serum Chitotriosidase (nm/ml/hour) |
973.3 (1 – 7262) | 1054 (18 – 4345) |
| Serum CCL18 (ng/ml) | 117.2 (1 – 936) | 86.8 (1.1 – 360) |
| Serum Lyso-GL1 (ng/ml) | 155.9 (4 – 1160) | 61. 4 (4 – 259) |
Data in brackets indicate range of values. SSI: Severity Score Index; DS3: Disease Severity Criteria
Table 1B depicts the demographics of patients in Cohort 1 & 2 which consisted of patients receiving therapy – either ERT (n = 69 on imiglucerase or n=46 on Velaglucerase) or ELI-SRT and in whom baseline pre-treatment samples were not available.
Response of Plasma lyso-GL1 levels to ERT
To assess the impact of ERT on plasma lyso-GL1 levels, we measured plasma levels at baseline prior to initiation of imiglucerase ERT and while on ERT. There was barely detectable level of lyso-GL1 in plasma of healthy controls. At baseline prior to initiation of imiglucerase ERT, lyso-GL1 levels were markedly elevated up to 500-fold compared to healthy controls (Figure 1A & B). After Imiglucerase ERT for mean 3.6 years, there was marked decrease of plasma lyso–GL1 from mean 180.9 ng/ml (145.4 – 216.5; 95% confidence interval) to a mean of 89 ng/ml (69.2 – 129.4; 95% confidence interval) (p<0.001, Figure 1A & B) in the post treatment group.
Figure 1.
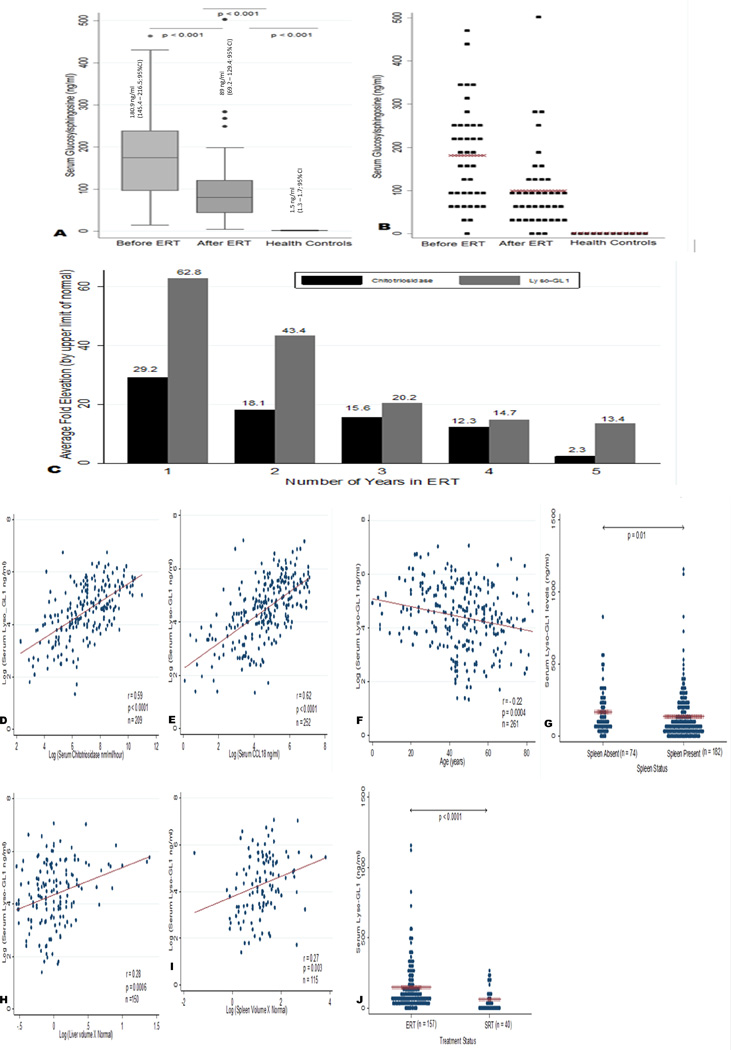
(A and B) Median and mean values of Lyso-GL1 in cohort 1—Before ERT & after ERT against healthy controls. The levels of circulating Lyso GL1 values were assessed in treatment naïve patients before ERT & after ERT and compared against health controls (n = 41). In Panel A, values are expressed as median (horizontal line in each box), 25th and 75th centiles (top and bottom lines of the box) and 10th and 90th centiles (top and bottom of each whisker). In panel B, distribution of Lyso GL1 measurements across untreated, treated and healthy controls is shown. Mean values are marked by a x. There was barely detectable level of Lyso-GL1 in plasma of healthy controls (1.5 ng/ml; 1.3–1.7 95% CI). At baseline prior to initiation of imiglucerase ERT, average lyso-GL1 levels were 180.9 ng/ml (145.4–216.5; 95% CI) and decreased to a mean of 89 ng/ml (69.2–129.4; 95% CI) after therapy. (C) Trend in Chitotriosidase against Lyso-GL1 over 5 years of ERT Treatment. N = 25 (Year 1); N = 20 (Year 2); N = 5 (Year 3); N = 7 (Year 4); N = 3 (Year 5). The biomarker elevation in patients were averaged from year one to year five and divided by the upper limit of normal (ULN) taken as 125 nm/ml/h for chitotriosidase and 2.7 ng/ml for Lyso-GL1. The average fold elevation of each biomarker per year is graphed. Lyso-GL1 was correlated with visceral and serum markers of Gaucher disease burden to assess its utility as a biomarker. Non-normally distributed data was logarithmically transformed and correlated using Pearson's correlation coefficient. (D) Lyso-GL1 correlation with Chitotriosidase (r = 0.59 P < 0.001 n = 209) (E) Lyso- GL1 correlation with CCL 18 (r = 0.62 P < 0.001 n = 252) (H) Lyso-GL1 correlation with liver volume as multiples of normal (r = 0.28 P < 0.001 n = 150) (I) Lyso-GL1 correlation with spleen volume as multiples of normal (r = 0.27 P = 0.003 n = 115) (F) Lyso GL1 correlation with age in years (r = −0.22 P < 0.001) G. Lyso-GL1 levels between patients with intact spleens and splenectomy (P = 0.01) J. Lyso-GL1 levels between patients on ERT and SRT (P < 0.001).
Long Term Response of lyso-GL1 to Therapy
Next, we compared long-term response of lyso-GL1 to the response of chitotriosidase over 5 years of treatment. The average chitotriosidase levels at baseline before treatment was 12,450 nm/ml/hour (range: 337 – 58707 nm/ml/hour). Similarly lyso-GL1 levels at baseline was 180.9 ng/ml (range: 14 – 464 ng/ml). Biomarker levels were then calculated as mean elevations of upper limit of normal (ULN) from year one of treatment to year 5. The ULN was derived from the healthy controls. The cutoff of was 2.7 ng/ml for lyso-GL1 and 125 nm/ml/hour for chitotriosidase. At year one, chitotriosidase was elevated on average 29.2x ULN and decreased to half by year three. By year five, chitotriosidase was only elevated to twice the normal value seen in healthy adults [Figure 1C]. In comparison, in the same patients, lyso-GL1 was increased 63×ULN in year one, decreased by half in year two, decreased to one third by year three and then plateaued to 13.4×ULN at year five [Figure 1C]. Given that lyso-GL1 is the bioactive lipid involved directly in pathological pathway in GD, our data suggests that lyso-GL1 may more accurately represent the residual GD system-wide activity in patients compared to chitotriosidase which is only secreted by activated macrophages in response to GL1 accumulation [24, 33].
Correlation of lyso-GL1 levels with established biomarkers and clinical indicators of disease burden
To determine the utility of lyso-GL1 in GD1, we assessed its correlation with established biomarkers, chitotriosidase and CCL18 and with indicators of disease burden. We pooled the data of cohort 1 and cohort 2 to maximize the strength of the analysis. Plasma lyso-GL1 correlated significantly with chitotriosidase after adjustment for polymorphism (i.e., levels in heterozygotes carriers were multiplied by 2 [34]) (r = 0.59; p<0.001, Figure 1D). Plasma lyso-GL1 was significantly correlated with CCL18 (r = 0.62 p<0.001, Figure 1E) and with indicators of severity of visceral disease: splenic volume (r = 0.27 p= 0.003, Figure 1I), liver volume (r = 0.28 p<0.001 Figure 1H) as well as with age (r = −0.22 p < 0.001 Figure 1F). Splenectomy was associated with higher lyso-GL1 levels compared to patients with intact spleens (p = 0.01 Fig 1G). Patients receiving ELI-SRT had lower levels of lyso-GL1 when compared to patients receiving ERT (p < 0.001 Fig. 1J). There was no correlation of lyso-GL1 with indicators of skeletal disease severity, Herman scores (r = 0.06 p = 0.35) and bone marrow burden score (r = 0.12 p=0.39) with hemoglobin (r= 0.07 p = 0.73) or platelet counts (r = 0.14 p =0.07) (data not shown). There was no difference in plasma lyso-GL1 levels between patients treated with imiglucerase and velaglucerase ERT (data not shown).
Multi-variate Regression analysis
Using multiple linear regression we estimated the coefficients adjusted for age, spleen volume, liver volume, splenectomy status, serum chitotriosidase, serum CCL18, hemoglobin levels, platelet counts and mode of therapy without further selection of variables to identify clinical indicators independently predictive of plasma lyso-GL1 levels. In our analysis, age (p < 0.001), serum chitotriosidase (p < 0.001) serum CCL18 (p = 0.001), splenectomy (p=0.02) and treatment with ELI-SRT (p < 0.001) were most predictive of plasma lyso-GL 1 levels after adjusting for each other and for all other variables mentioned above. The adjusted r-squared of the model was 78% with a root mean squared error of 0.47 with a total of 64 observations. Age had an inverse relationship with plasma lyso-GL1 (p<0.001). This likely reflects the fact that children have more severe disease at presentation than adults. An increase in chitotriosidase (1 unit increase in the natural logarithm of chitotriosidase measured in nm/ml/hour resulted in 0.61 + 0.07 unit increase in the natural logarithm of lyso-Gl1 measured in ng/ml; p < 0.001) and CCL18 (1 unit increase in logarithm of CCL18 measured in ng/ml resulted in 0.24 + 0.06 unit increase in the natural logarithm of lyso-GL1 measured in ng/ml p = 0.001) predicted an increase in plasma lyso-GL1 levels. Similarly, patients receiving ELI-SRT had significantly lower levels of lyso-GL1 (p < 0.001) than patients who were treated on ERT. Asplenic patients had significantly higher levels of plasma lyso-GL1 (p = 0.02) than those with intact spleen. By multiple linear regression, spleen volume, liver volume, platelet levels and hemoglobin were not independently associated with plasma lyso-GL1 levels.
Comparison of biomarker response to ERT & ELI-SRT by propensity scoring
To analyze whether ELI-SRT resulted in significant differences in plasma lyso-GL1 levels as compared to ERT and to assess the magnitude of effect, propensity scores of the two cohorts of patients were generated using a logistic treatment model based on disease characteristics that could confound the results: age, spleen volume/splenectomy status ordinal scale, liver volume ordinal scale, hemoglobin level, platelet count, chitotriosidase and CCL18 levels (Figure 2A). Only those patients who were on therapy for a minimum of a year were included in the study. The cohorts were matched using nearest neighbor matching where the observations with the least difference in propensity scores were matched in a 1:3 ratio i.e., every patient on ELI-SRT was matched to 3 patients from ERT with the nearest propensity scores using the greedy matching algorithm. In the matched sample, 47 patients receiving ERT cohort were matched to 9 patients receiving ELI-SRT cohort (Figure 2B). Lyso-GL1 levels decreased to a greater extent by mean of 113 ng/ml (95% confidence interval 90.3 – 136 ng/ml p < 0.001) in patients receiving ELI-SRT compared to patients receiving ERT. Further prospective studies in a larger subset of patients would be of interest as our preliminary analysis indicate lyso-GL1 is biomarker that my reflect system-wide as opposed to macrophage-centric pathophysiology based on the mechanism of action of the two types of treatments. Similarly matched patients by propensity scoring on imiglucerase vs velaglucerase ERT did not show any difference in plasma lyso-GL1 levels (p = 0.66; data not shown).
Figure 2.
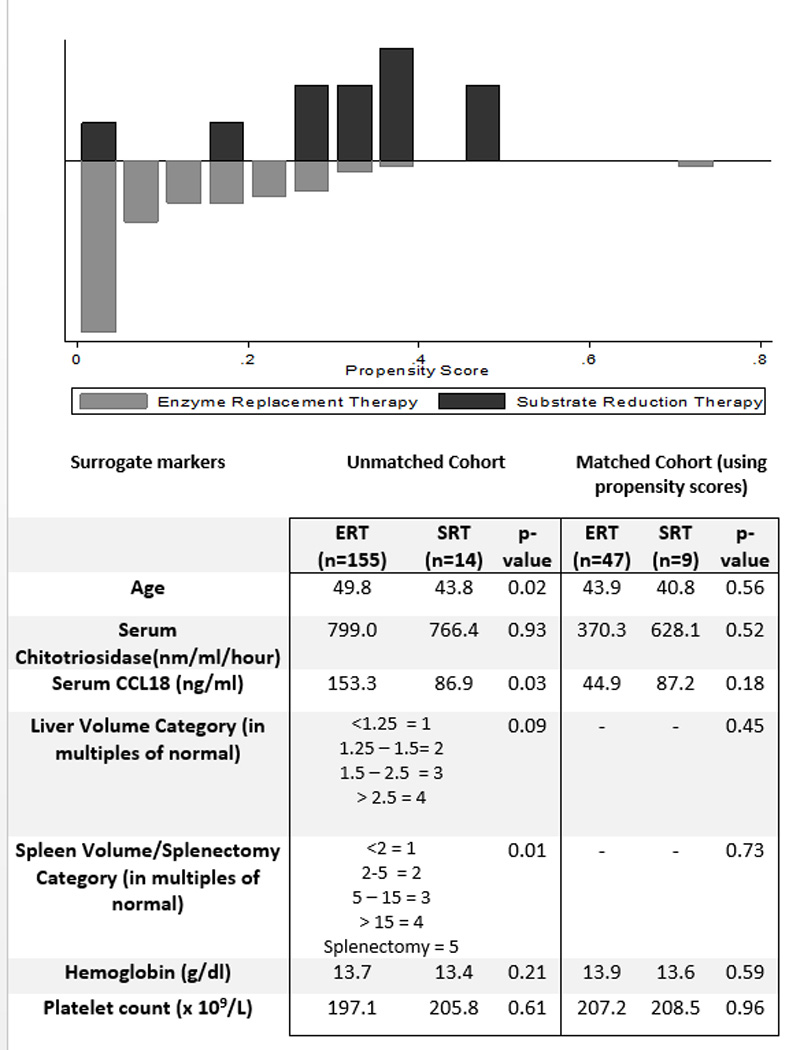
Propensity Score Matching between ERT and ELI-SRT patients. Top panel: Comparison of Propensity scores between the ERT and SRT cohort of patients. Table shows baseline Characteristics of unmatched and matched patients receiving ERT and SRT.
Sensitivity and Specificity of Plasma lyso-GL1
Sensitivity and specificity analysis was performed with the aim to identify the ideal cutoff point of plasma lyso-GL1 for identification of patients with GD. In our analysis of 42 pre-treatment GD patients, 42 patients on ongoing treatment with GD and 49 healthy controls, a cut off of 4 ng/ml yielded an ideal sensitivity and specificity of 100% each to distinguish between healthy controls and patients with GD. The area under curve (AUC) for receiver operating characteristics was 1.00 (95% CI 1.00 – 1.00) indicating that there was no overlap of plasma lyso-GL1 values between healthy controls and patients with GD [Supplementary Figure].
Discussion
There is emerging appreciation of system-wide involvement of Gaucher disease where cells beyond the macrophage system participate in orchestrating pathophysiology and lyso-GL1 appears to be a critical mediator. Herein, we show that plasma lyso-GL1 is a valid biomarker in a large cohort of GD1 patients. Patients with GD1 show up to 500-fold elevation of plasma lyso-GL1 levels compared to healthy controls. Healthy controls have barely detectable lyso-GL1. Levels fall dramatically with imiglucerase ERT and our analysis of the observational data by propensity scoring suggests that ELI-SRT may result in greater decrease plasma lyso-GL1 levels than ERT. Thus this biomarker exhibits considerable utility for monitoring patients on or off therapy, extent of disease burden and residual disease activity in patients receiving therapy. Cumulative long term analysis show that on average lyso-GL1 levels decrease to half their initial value within 1 year of ERT although individual patient trends are heterogeneous. Subsequently, with ongoing ERT, lyso-GL1 levels appear to plateau by 3–4 years with a mean average residual elevation of 13.5 fold the normal levels at 5 years of treatment. Unlike lyso-GL1, chitotriosidase levels decrease by half in 2 years and are elevated by only 2-fold upper limit of normal by year 5. Given that lyso-GL1 is a product derived from the root cause of GD, it may reflect more accurately residual GD disease activity that is independent of macrophage activation.
We find that patients receiving ELI-SRT have lower lyso-GL1 levels compared to patients on ERT. By propensity scoring, lyso-GL1 was on average lower by 113 ng / ml (95% 138 – 90 p< 0.001) in patients on ELI-SRT. Recent study by Smid et al, comparing ELI-SRT to miglustat-SRT suggest that lyso-GL1 levels are lower in patients treated with ELI- SRT than in miglustat-SRT in the first year of treatment. In this study of a small number of patients reported by Smid et al, there is also trend toward greater reduction of lyso-GL1 in patients treated with ELI-SRT patients than patients receiving ERT [35].
In our cohort of patients, there is a significant correlation with established biomarkers, chitotriosidase and CCL18. In addition, plasma lyso-GL1 levels correlate with liver volume and spleen volume, platelet counts and age. Asplenia was associated with higher levels of circulating lyso-GL1 and treatment with ELI-SRT resulted in lower levels of lyso-GL1 than ERT.
Further, lyso-GL1 was independently associated age, serum chitotriosidase, serum CCL18 and splenectomy once adjusted for each other as well as liver volume, spleen volume, hemoglobin and platelet counts. Similarly, Dekker et al, have reported correlation of lyso-GL1 with markers of significant disease burden [14] and Rolfs and colleagues compared lyso-GL1 against biomarkers chitotriosidase and CCL18 [24]. Our data also suggest lyso-GL1 levels may have greater utility compared to other biomarkers to reflect ongoing disease activity in patients on long-term therapy.
Lyso-GL1, the deacylated form of glucosylceramide has risen to importance as the first biomarker of GD that is proximately involved with root-cause of GD. Deficiency of acid β-glucosidase leads to accumulation of GL1 that is metabolized by an alternative metabolic pathway involving acid ceramidase [13–15]. Other theories purport that lyso-GL1 is formed through the glucosylation of sphingosine through the enzyme glucosylceramide synthase [36]. Seminal studies by Raghavan et al, led to first identification of elevated lyso-GL1 from GD spleens. [23]. Nilsson et al, subsequently showed increased lyso-GL1 in the grey matter of GD subjects focusing attention on potentially neurotoxic role of this lipid in neuronopathic GD [21]. However, formal evaluation of lyso-GL1 in GD had to await recent advances in lipidomics for specific and accurate measurement in body tissues and fluids [14, 37]. There is now mounting body of evidence to support use of lyso-GL1 as a pathologically meaningful biomarker.
Evaluation of circulating biomarkers of total burden of Gaucher cells requires consideration of relative organ contribution to the circulating pool and regional metabolism. For chitotriosidase, Aerts and associates suggest that secretion of this biomarker by splenic Gaucher cells undergoes extensive first pass metabolism in the liver and hence makes minor contribution to circulating pool of the biomarker. [Supplementary Figure][36]. Hence chitotriosidase in blood likely represents that secreted primarily by Gaucher cells in the liver and bone marrow with some contribution from the lungs. Regional metabolism of lyso-GL1 and the relative organ contribution to circulating pool is likely to be complex involving transport in plasma lipoproteins and biliary secretion. Indeed high biliary secretion of lyso-GL1 has been demonstrated in a mouse model of GD [9].
Studies revealed the cytotoxic nature of lyso-GL1 in neuronal cells as other cell types involving its role as an inhibitor of cytochrome c oxidase, protein kinase c activity, and CTP-phosphocholine citdyltransferase [38–41] . Its role as an apoptotic agent has been described by Sueyoshi et al, through DNA fragmentation, chromatin condensation and phosphatidylserine externalization in mouse neuroblastoma Neuro2a cells [42]. We studied the impact of lyso-GL1 in osteoblasts and concluded that it directly contributes to osteoblast cell death and apoptosis. Further studies have defined its importance in the immune dysregulation and chronic metabolic inflammation that are hallmarks of GD. Lyso-GL1 specific NK T cells induce B cell proliferation resulting in hypergammaglobulinemia and anti-lipid antibodies (3–5). Importantly, these toxic effects parallel the macroscopic clinical manifestations found in patients with GD and are consistent with a direct relationship between circulating lyso-GL1 levels and disease burden.
In conclusion the utility of plasma lyso-GL1 as a biomarker of GD is underscored by its biological role and impressive associations with indicators of disease severity as well as treatment status. Its involvement in the disease pathology directly correlates with disease burden and clinical severity.
Supplementary Material
Acknowledgments
We thank the patients for their support and generous participation in our study. We express our thanks to Dr. Guillermo Madico for the illustration of organs contributing to total circulating chitotriosidase. PKM is supported by a grant from the National Institutes of Arthritis, Musculoskeletal and Skin Diseases AR 65932 and Center of Excellence Grant in Clinical Translational Research from Genzyme, a Sanofi Company. He has received research support, honoraria and consulting fees from Genzyme.
Uncategorized References
- 1.Mistry PK, Belmatoug N, vom Dahl S, et al. Understanding the natural history of Gaucher disease. American journal of hematology. 2015;90(Suppl 1):S6–S11. doi: 10.1002/ajh.24055. [DOI] [PubMed] [Google Scholar]
- 2.Cox TM, Cachon-Gonzalez MB. The cellular pathology of lysosomal diseases. The Journal of pathology. 2012;226:241–254. doi: 10.1002/path.3021. [DOI] [PubMed] [Google Scholar]
- 3.Beutler E, Gelbart T, Kuhl W, et al. Mutations in Jewish patients with Gaucher disease. Blood. 1992;79:1662–1666. [PubMed] [Google Scholar]
- 4.Beutler E, Gelbart T. Gaucher disease mutations in non-Jewish patients. Br J Haematol. 1993;85:401–405. doi: 10.1111/j.1365-2141.1993.tb03185.x. [DOI] [PubMed] [Google Scholar]
- 5.Grabowski GA. Phenotype, diagnosis, and treatment of Gaucher's disease. Lancet (London, England) 2008;372:1263–1271. doi: 10.1016/S0140-6736(08)61522-6. [DOI] [PubMed] [Google Scholar]
- 6.Cox TM. Gaucher disease: understanding the molecular pathogenesis of sphingolipidoses. Journal of inherited metabolic disease. 2001;24(Suppl 2):106–121. doi: 10.1023/a:1012496514170. discussion 187-108. [DOI] [PubMed] [Google Scholar]
- 7.Nilsson O, Mansson JE, Hakansson G, et al. The occurrence of psychosine and other glycolipids in spleen and liver from the three major types of Gaucher's disease. Biochimica et biophysica acta. 1982;712:453–463. doi: 10.1016/0005-2760(82)90272-7. [DOI] [PubMed] [Google Scholar]
- 8.Orvisky E, Sidransky E, McKinney CE, et al. Glucosylsphingosine accumulation in mice and patients with type 2 Gaucher disease begins early in gestation. Pediatr Res. 2000;48:233–237. doi: 10.1203/00006450-200008000-00018. [DOI] [PubMed] [Google Scholar]
- 9.Mistry PK, Liu J, Sun L, et al. Glucocerebrosidase 2 gene deletion rescues type 1 Gaucher disease. Proceedings of the National Academy of Sciences of the United States of America. 2014;111:4934–4939. doi: 10.1073/pnas.1400768111. [DOI] [PMC free article] [PubMed] [Google Scholar]
- 10.Nair S, Boddupalli CS, Verma R, et al. Type II NKT-TFH cells against Gaucher lipids regulate B-cell immunity and inflammation. Blood. 2015;125:1256–1271. doi: 10.1182/blood-2014-09-600270. [DOI] [PMC free article] [PubMed] [Google Scholar]
- 11.Mistry PK, Liu J, Yang M, et al. Glucocerebrosidase gene-deficient mouse recapitulates Gaucher disease displaying cellular and molecular dysregulation beyond the macrophage. Proceedings of the National Academy of Sciences of the United States of America. 2010;107:19473–19478. doi: 10.1073/pnas.1003308107. [DOI] [PMC free article] [PubMed] [Google Scholar]
- 12.Nair S, Branagan AR, Liu J, et al. Clonal Immunoglobulin against Lysolipids in the Origin of Myeloma. The New England journal of medicine. 2016;374:555–561. doi: 10.1056/NEJMoa1508808. [DOI] [PMC free article] [PubMed] [Google Scholar]
- 13.Yamaguchi Y, Sasagasako N, Goto I, et al. The synthetic pathway for glucosylsphingosine in cultured fibroblasts. Journal of biochemistry. 1994;116:704–710. doi: 10.1093/oxfordjournals.jbchem.a124584. [DOI] [PubMed] [Google Scholar]
- 14.Dekker N, van Dussen L, Hollak CE, et al. Elevated plasma glucosylsphingosine in Gaucher disease: relation to phenotype, storage cell markers, and therapeutic response. Blood. 2011;118:e118–e127. doi: 10.1182/blood-2011-05-352971. [DOI] [PMC free article] [PubMed] [Google Scholar]
- 15.Ferraz MJ, Marques AR, Appelman MD, et al. Lysosomal glycosphingolipid catabolism by acid ceramidase: formation of glycosphingoid bases during deficiency of glycosidases. FEBS Lett. 2016;590:716–725. doi: 10.1002/1873-3468.12104. [DOI] [PubMed] [Google Scholar]
- 16.Weinreb NJ, Aggio MC, Andersson HC, et al. Gaucher disease type 1: revised recommendations on evaluations and monitoring for adult patients. Seminars in hematology. 2004;41:15–22. doi: 10.1053/j.seminhematol.2004.07.010. [DOI] [PubMed] [Google Scholar]
- 17.Hollak CE, van Weely S, van Oers MH, et al. Marked elevation of plasma chitotriosidase activity. A novel hallmark of Gaucher disease. The Journal of clinical investigation. 1994;93:1288–1292. doi: 10.1172/JCI117084. [DOI] [PMC free article] [PubMed] [Google Scholar]
- 18.Boot RG, Renkema GH, Verhoek M, et al. The human chitotriosidase gene. Nature of inherited enzyme deficiency. The Journal of biological chemistry. 1998;273:25680–25685. doi: 10.1074/jbc.273.40.25680. [DOI] [PubMed] [Google Scholar]
- 19.Boot RG, Verhoek M, de Fost M, et al. Marked elevation of the chemokine CCL18/PARC in Gaucher disease: a novel surrogate marker for assessing therapeutic intervention. Blood. 2004;103:33–39. doi: 10.1182/blood-2003-05-1612. [DOI] [PubMed] [Google Scholar]
- 20.Deegan PB, Moran MT, McFarlane I, et al. Clinical evaluation of chemokine and enzymatic biomarkers of Gaucher disease. Blood Cells Mol Dis. 2005;35:259–267. doi: 10.1016/j.bcmd.2005.05.005. [DOI] [PubMed] [Google Scholar]
- 21.Nilsson O, Svennerholm L. Accumulation of glucosylceramide and glucosylsphingosine (psychosine) in cerebrum and cerebellum in infantile and juvenile Gaucher disease. Journal of neurochemistry. 1982;39:709–718. doi: 10.1111/j.1471-4159.1982.tb07950.x. [DOI] [PubMed] [Google Scholar]
- 22.Orvisky E, Park JK, LaMarca ME, et al. Glucosylsphingosine accumulation in tissues from patients with Gaucher disease: correlation with phenotype and genotype. Molecular genetics and metabolism. 2002;76:262–270. doi: 10.1016/s1096-7192(02)00117-8. [DOI] [PubMed] [Google Scholar]
- 23.Raghavan SS, Mumford RA, Kanfer JN. Deficiency of glucosylsphingosine: beta-glucosidase in Gaucher disease. Biochem Biophys Res Commun. 1973;54:256–263. doi: 10.1016/0006-291x(73)90916-9. [DOI] [PubMed] [Google Scholar]
- 24.Rolfs A, Giese AK, Grittner U, et al. Glucosylsphingosine is a highly sensitive and specific biomarker for primary diagnostic and follow-up monitoring in Gaucher disease in a non-Jewish, Caucasian cohort of Gaucher disease patients. PLoS One. 2013;8:e79732. doi: 10.1371/journal.pone.0079732. [DOI] [PMC free article] [PubMed] [Google Scholar]
- 25.Schueler UH, Kolter T, Kaneski CR, et al. Toxicity of glucosylsphingosine (glucopsychosine) to cultured neuronal cells: a model system for assessing neuronal damage in Gaucher disease type 2 and 3. Neurobiology of disease. 2003;14:595–601. doi: 10.1016/j.nbd.2003.08.016. [DOI] [PubMed] [Google Scholar]
- 26.Taddei TH, Dziura J, Chen S, et al. High incidence of cholesterol gallstone disease in type 1 Gaucher disease: characterizing the biliary phenotype of type 1 Gaucher disease. Journal of inherited metabolic disease. 2010;33:291–300. doi: 10.1007/s10545-010-9070-1. [DOI] [PMC free article] [PubMed] [Google Scholar]
- 27.Hermann G, Pastores GM, Abdelwahab IF, et al. Gaucher disease: assessment of skeletal involvement and therapeutic responses to enzyme replacement. Skeletal radiology. 1997;26:687–696. doi: 10.1007/s002560050313. [DOI] [PubMed] [Google Scholar]
- 28.Maas M, van Kuijk C, Stoker J, et al. Quantification of bone involvement in Gaucher disease: MR imaging bone marrow burden score as an alternative to Dixon quantitative chemical shift MR imaging--initial experience. Radiology. 2003;229:554–561. doi: 10.1148/radiol.2292020296. [DOI] [PubMed] [Google Scholar]
- 29.Weinreb NJ, Finegold DN, Feingold E, et al. Evaluation of disease burden and response to treatment in adults with type 1 Gaucher disease using a validated disease severity scoring system (DS3) Orphanet journal of rare diseases. 2015;10:64. doi: 10.1186/s13023-015-0280-3. [DOI] [PMC free article] [PubMed] [Google Scholar]
- 30.Schoonhoven A, Rudensky B, Elstein D, et al. Monitoring of Gaucher patients with a novel chitotriosidase assay. Clinica chimica acta; international journal of clinical chemistry. 2007;381:136–139. doi: 10.1016/j.cca.2007.02.042. [DOI] [PubMed] [Google Scholar]
- 31.Seeger JD, Williams PL, Walker AM. An application of propensity score matching using claims data. Pharmacoepidemiol Drug Saf. 2005;14:465–476. doi: 10.1002/pds.1062. [DOI] [PubMed] [Google Scholar]
- 32.Haukoos JS, Lewis RJ. The Propensity Score. JAMA. 2015;314:1637–1638. doi: 10.1001/jama.2015.13480. [DOI] [PMC free article] [PubMed] [Google Scholar]
- 33.Aerts JM, Hollak CE, van Breemen M, et al. Identification and use of biomarkers in Gaucher disease and other lysosomal storage diseases. Acta Paediatr Suppl. 2005;94:43–46. doi: 10.1111/j.1651-2227.2005.tb02110.x. discussion 37-48. [DOI] [PubMed] [Google Scholar]
- 34.Grace ME, Balwani M, Nazarenko I, et al. Type 1 Gaucher disease: null and hypomorphic novel chitotriosidase mutations-implications for diagnosis and therapeutic monitoring. Human mutation. 2007;28:866–873. doi: 10.1002/humu.20524. [DOI] [PubMed] [Google Scholar]
- 35.Smid BE, Ferraz MJ, Verhoek M, et al. Biochemical response to substrate reduction therapy versus enzyme replacement therapy in Gaucher disease type 1 patients. Orphanet journal of rare diseases. 2016;11:28. doi: 10.1186/s13023-016-0413-3. [DOI] [PMC free article] [PubMed] [Google Scholar]
- 36.Ferraz MJ, Kallemeijn WW, Mirzaian M, et al. Gaucher disease and Fabry disease: new markers and insights in pathophysiology for two distinct glycosphingolipidoses. Biochimica et biophysica acta. 2014;1841:811–825. doi: 10.1016/j.bbalip.2013.11.004. [DOI] [PubMed] [Google Scholar]
- 37.Shinoda H, Kobayashi T, Katayama M, et al. Accumulation of galactosylsphingosine (psychosine) in the twitcher mouse: determination by HPLC. Journal of neurochemistry. 1987;49:92–99. doi: 10.1111/j.1471-4159.1987.tb03399.x. [DOI] [PubMed] [Google Scholar]
- 38.Hannun YA, Bell RM. Lysosphingolipids inhibit protein kinase C: implications for the sphingolipidoses. Science (New York, NY) 1987;235:670–674. doi: 10.1126/science.3101176. [DOI] [PubMed] [Google Scholar]
- 39.Sohal PS, Cornell RB. Sphingosine inhibits the activity of rat liver CTP: phosphocholine cytidylyltransferase. The Journal of biological chemistry. 1990;265:11746–11750. [PubMed] [Google Scholar]
- 40.Shayman JA, Deshmukh GD, Mahdiyoun S, et al. Modulation of renal epithelial cell growth by glucosylceramide. Association with protein kinase C, sphingosine, and diacylglycerol. The Journal of biological chemistry. 1991;266:22968–22974. [PubMed] [Google Scholar]
- 41.Ballabio A, Gieselmann V. Lysosomal disorders: from storage to cellular damage. Biochimica et biophysica acta. 2009;1793:684–696. doi: 10.1016/j.bbamcr.2008.12.001. [DOI] [PubMed] [Google Scholar]
- 42.Sueyoshi N, Maehara T, Ito M. Apoptosis of Neuro2a cells induced by lysosphingolipids with naturally occurring stereochemical configurations. Journal of lipid research. 2001;42:1197–1202. [PubMed] [Google Scholar]
Associated Data
This section collects any data citations, data availability statements, or supplementary materials included in this article.