Abstract
Purpose
Discrete wavelet transform (DWT) analyses suggest that the 20- and 40-Hz components of the short-flash photopic electroretinogram (ERG) are closely related to the ON and OFF pathways, respectively. With the DWT, we examined how the ERG ON and OFF components are modulated by the stimulus intensity and/or duration.
Methods
Discrete wavelet transform descriptors (20, 40 Hz and 40:20-Hz ratio) were extracted from ERGs evoked to 25 combinations of flash durations (150–5 ms) and strengths (0.8–2.8 log cd.m−2).
Results
In ERGs evoked to the 150-ms stimulus (to separate the ON and OFF ERGs), the 40:20-Hz ratio of ON ERGs (mean ± SD: 0.49 ± 0.04) was significantly smaller (P < 0.05) than that of OFF ERGs (1.71 ± 0.18) owing to a significantly (P < 0.05) higher contribution of the 20 and 40 Hz components to the ON and OFF ERGs, respectively. With brighter stimuli, the ON and OFF components increased similarly (P < 0.05). While progressively shorter flashes had no impact (P > 0.05) on the ON component, it exponentially enhanced (P < 0.05) the OFF component.
Conclusions
Discrete wavelet transform allows for an accurate determination of ON and OFF retinal pathways even in ERGs evoked to a short flash. To our knowledge, the significant OFF facilitatory effect evidenced with shorter stimuli has not previously been reported.
Translational Relevance
The DWT approach should offer a rapid, easy, and reproducible approach to retrospectively and prospectively evaluate the function of the retinal ON and OFF pathways using the standard (short-flash duration) clinical ERG stimulus.
Keywords: electroretinogram, ON and OFF, stimulus duration, stimulus strength, wavelet transform, human
Introduction
The push-pull concept suggests that the genesis of the photopic electroretinogram (ERG) b-wave evoked to a flash of short-duration results from a balanced interaction between the retinal ON and OFF pathways.1 Time-frequency analysis obtained using the discrete wavelet transform (DWT) suggested that the 20-Hz component of the photopic b-wave was more closely related to the activity of the ON pathway, while the 40-Hz component appeared to mainly reflect the activity of the OFF pathway. This claim was based on the fact that the 20- and 40-Hz components of the photopic b-wave were selectively attenuated in diseases differently affecting the ON and OFF pathways.2
When the photopic ERG is evoked in response to a flash of short duration (e.g. <5 ms), activities of the ON and OFF pathways are merged to form the response we record. However, with stimuli of longer duration (e.g. >150 ms), a distinct OFF component, known as the d-wave, is seen at the offset of the stimulus.1,3,4 Studies in non-human primates revealed that the b-wave of the long-flash ERG mostly originated from ON-bipolar cell activity1 while the source of the d-wave was mostly attributed to OFF-bipolar cell activity.4
Based on the above, the purpose of this study is to determine the time-frequency composition of the ERG ON and OFF responses separately and how each response is modulated by the intensity and/or the duration of the stimulus.
Methods
This study was performed on 10 normal subjects (one male and nine females aged 23–43 years old; mean age 31.9 years). The research was conducted according to the tenets of the Declaration of Helsinki and was approved by the National Ethics Committee. All subjects signed an informed consent form previously approved by the Institutional Review Board. The IRB also allowed us to make use of archived clinical ERG data for which the acquisition of a clear informed consent could not be readily demonstrated. In all cases, subjects provided consent to the ERG procedure.
ERG Recordings
Electroretinogram recordings were performed with an Espion visual electrophysiology testing system (Diagnosys LLC, Littleton, MA). The recording electrode (HK-loop5) was hooked to the lower lid as previously reported elsewhere.6,7 The reference and ground electrodes (Grass silver cup electrodes; Grass Technologies, West Warwick, RI) were pasted at the level of the external canthus and on the forehead, respectively. The pupils were maximally dilated with 1% tropicamide (Mydriacyl; Alcon, Inc., Fort Worth, TX). Following a 10-minute period of light adaptation, photopic ERGs were elicited with a Ganzfeld ColorDome stimulator (Diagnosys LLC). Broadband white stimuli were delivered against a white 20-cd.m−2 rod desensitizing background as previously documented.6,7 Flash strength was gradually increased in steps of 0.5 log units, covering a range of 6.3 to 630 cd.m−2 (i.e., 0.8–2.8 log cd.m−2). These luminance series were recorded using flash durations of 5, 10, 20, 50, and 150 ms. Flashes were delivered at 1-Hz intervals, and 20 responses were averaged to yield a single waveform. The signals were recorded with a bandpass filter (bandwidth: 0.15–300 Hz), exported as ASCII files, and imported in Matlab R2015a (Mathworks, Natick, MA) for further analysis.
Wavelet Analysis
According to a previously published method,2,8,9 the DWT of each ERG signal was computed using the fast wavelet transform algorithm10 implemented with Matlab R2015a and adapted to achieve shift invariance. In order to reduce edge effects, before DWT computation, each response was padded with 512 additional samples (by repeating the first and last value 256 times on both sides of the signal). Discrete wavelet transform scalograms were then normalized to the maximal coefficient. Each scalogram included eight frequency bands, each with a distinct central frequency (10, 20, 40, 80, 160, 320, 640, and 1280 Hz; see Fig. 1A), where each band quantified the contribution of a range of components oscillating around the central frequency. This time-frequency approach allows for the identification of energy descriptors, each defined by their respective time and frequency coordinates. As previously suggested, the DWT could potentially yield measurements of the ON and OFF components of the ERG (local wavelet maxima found in the 20- and 40-Hz bands, respectively) through the quantification of their respective associated wavelet coefficients.2 In the present study, this claim is further investigated by assessing the major time-frequency components of the ON and OFF ERGs evoked to long-flash (i.e., 150 ms) stimulus. Finally, numerous mother wavelets can be used to extract the time-frequency components of the ERG (e.g., 20-Hz and 40-Hz components). In this study, we wished to analyze ERG components that were well-localized in time (such as the b- and d-waves). The Haar wavelet (which has a square wave-like shape) was chosen not only for its simplicity but also because, among all the wavelets considered, it is the one that provided the highest temporal accuracy; the Haar wavelet thus has the ability to optimally identify the local components of the ERG signal.2 Furthermore, the Haar wavelet has the shortest wavelet filter length, making it less prone to contamination from neighboring components (such as a-wave contamination on the b-wave). Additional rationales for the use of this mother wavelet were also discussed elsewhere.2
Figure 1.
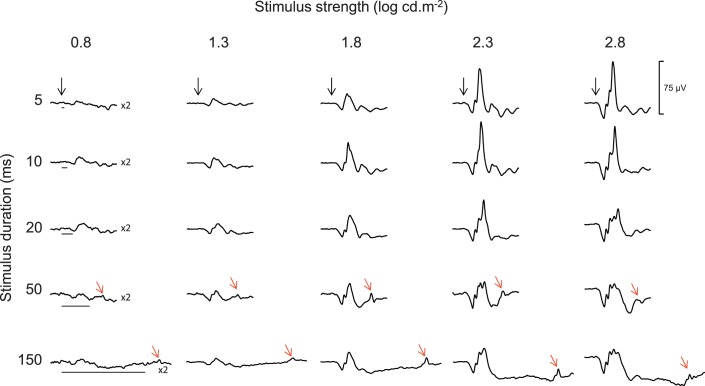
Representative ERG traces. Composite ERG signals that were obtained (by averaging the responses of all 10 subjects) using short (5 ms) and long (10, 20, 50 and 150 ms) white flash stimuli of various strengths (0.8, 1.3, 1.8, 2.3, 2.8 log cd.m−2) against a white background of 20 cd.m−2. Vertical black arrows indicate the onset of the stimulus, while black horizontal lines indicate the luminous phase of the stimulus. Red arrows indicate the OFF responses (d-waves). The vertical calibration bar (75 μV) applies to each trace. Traces evoked to the 0.8 log cd.m−2 stimulus were magnified by a factor of 2 for visualization purposes.
Statistical Analysis
Two-way analysis of variance (ANOVA) was used to evaluate the interaction of the two main effects (i.e., stimulus duration and strength) on the ON and OFF ERG components. When the interaction effect was significant, a post hoc analysis was conducted using Bonferroni correction for multiple comparisons. Finally, Pearson correlations were used to assess relationships between selected variables.
Results
Representative ERG tracings evoked to each of the 25 combinations (i.e., 5 × 5) of stimulus strength and duration used in this study are shown in Figure 1 as an average of all the waveforms obtained from all 10 subjects. One can note that with the shortest (5 ms) flash duration (top tracings), the amplitude of the b-wave increases steadily with progressively stronger stimuli (from left to right) to reach the largest amplitude with a flash luminance of 2.8 log cd.m−2. When increasing the flash duration to 10 and 20 ms, the peak amplitude of the b-wave was reached with a 0.5 log-unit dimmer stimulus (2.3 log cd.m−2). A d-wave (OFF response) could only be seen (red arrows) in ERGs evoked to a 50-ms or greater stimulus (after the offset of the stimulus).
DWT Components of ON and OFF Responses
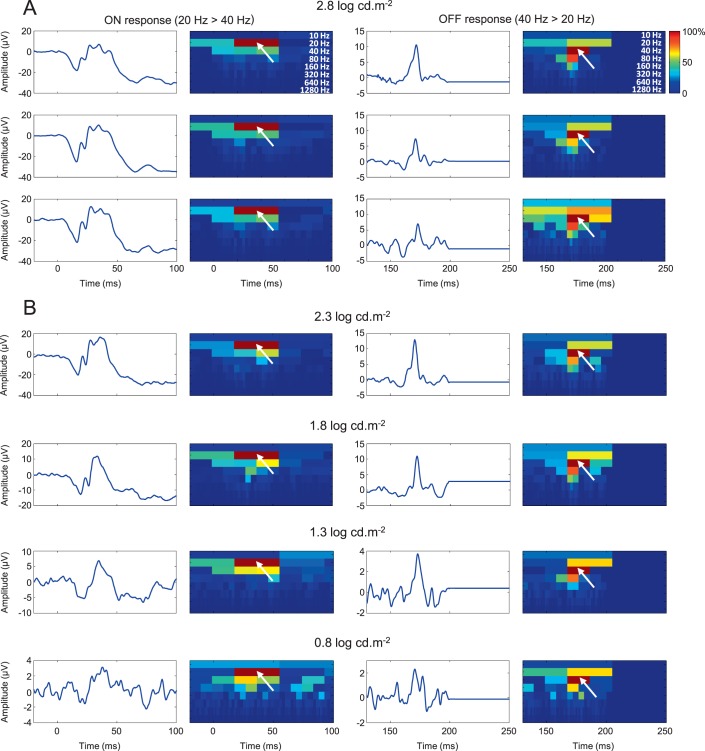
The longest stimulus duration (150 ms) combined to the brightest flash luminance (2.8 log cd.m−2) optimally separated the b- and d-waves (i.e., ON and OFF ERGs, respectively) in all subjects. Responses obtained using this stimulus condition were used to assess the main frequency component of the ON and OFF ERGs, respectively. As shown with the DWT scalograms reported in Figure 2A, ON ERGs are characterized with a predominant 20-Hz component (white arrows), with the same timing as the b-wave, whereas OFF ERGs are characterized with a strong 40-Hz component (white arrows) that is time-locked to the d-wave. This time-frequency signature remains quantifiable in ERGs evoked to progressively dimmer stimuli and even in noisy (blink and/or muscular twitch corruption) recordings (see the bottom tracings of Fig. 2B). In this study, the ON response was therefore quantified by identifying the maximal 20-Hz component that immediately followed the onset of the stimulus, while the OFF response was quantified by measuring the maximal 40-Hz component that immediately followed the offset of the stimulus.
Figure 2.
Main time-frequency component of ON and OFF responses. (A) Three examples of representative ON and OFF response traces, along with their associated DWT scalograms, obtained using a long (150 ms) white flash stimulus of 2.8 log cd.m−2 in strength. Each ON response is characterized by a strong 20-Hz component (white arrows) that is time-locked to the b-wave. Each OFF response is characterized by a strong 40-Hz component (white arrows) that is time-locked to the d-wave. Each scalogram is normalized to the maximal coefficient (0%–100%). (B) Representative ON and OFF responses, elicited with progressively dimmer flashes (from 2.3 to 0.8 cd.m−2), demonstrating that 20- and 40-Hz components dominated ON and OFF responses, respectively, independently of the stimulus strength. This was not evident for the dimmest flash, where the response was almost at the level of noise.
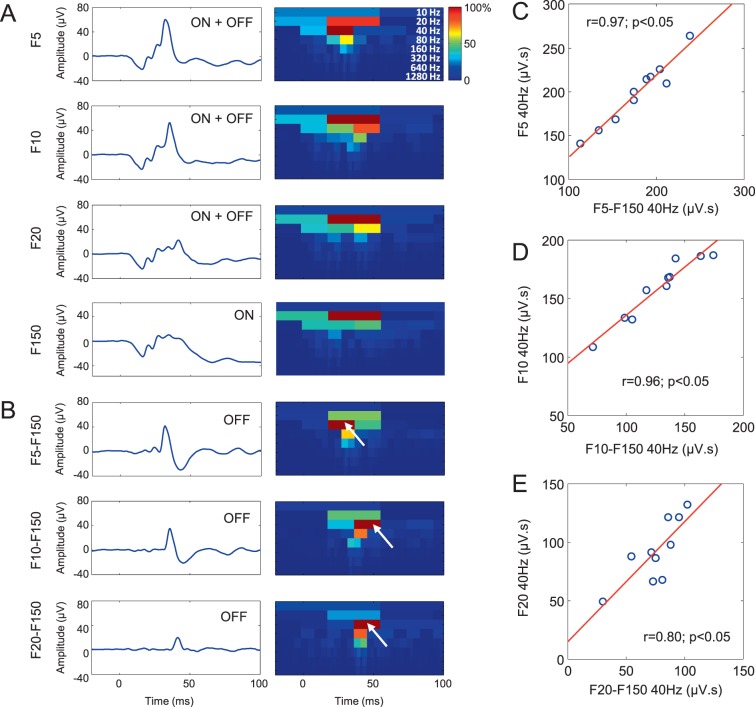
As shown in Figure 3A–B, the ON ERG waveform evoked at the onset of the 150-ms stimulus was algebraically subtracted from ERG waveforms evoked to stimuli of shorter durations (i.e., 5, 10, and 20 ms), where both the ON and OFF ERG components are mixed. This was done to extract the hidden OFF ERG components (shown in Fig. 3B). The corresponding DWT scalograms (reported at the right of the OFF ERGs in Fig. 3B) confirm that the extracted OFF ERGs are also dominated by a 40-Hz component (white arrows). Of note, the 40-Hz component isolated algebraically is slightly (but not significantly; P > 0.05) less energetic (mean of all extracted OFF ERG energy: 127.36 μV.s) compared to that included in the short-flash (ON-OFF) ERG responses (mean of all: 149.93 μV.s). However, as shown in Figures 3C–E, this algebraically isolated OFF ERG component was highly (Pearson scores of up to 0.97) and significantly (P < 0.05) correlated with the 40-Hz component included in the short-flash (ON-OFF) ERG response. The latter supports the claim that the 40-Hz component directly measured in its scalogram accurately quantify the OFF ERG contribution to the making of the short-flash ON-OFF ERG waveform.
Figure 3.
Main time-frequency component of algebraically extracted OFF responses. (A) Electroretinogram signals obtained by averaging the responses of all 10 subjects and acquired using short-duration stimuli of 5, 10, and 20 ms (identified as F5, F10, F20) where both the ON and OFF responses are merged (ERG = ON + OFF) and a long-duration stimulus of 150 ms (identified as F150) with separated ON and OFF responses. Associated DWT scalograms are shown on the right-hand side of the ERG tracings and are normalized to their maximal coefficients (0%–100%). (B) Algebraically extracted OFF responses obtained by subtracting the long-flash (F150) ON ERG from the mixed ON-OFF ERGs (F5, F10, F20). Associated DWT scalograms are shown on the right-hand side of each tracing. The dominant 40-Hz component contained within these OFF responses is indicated by white arrows. (C–E) Correlations between the 40-Hz component of the mixed ON-OFF ERGs (ordinate) and the 40-Hz component of the algebraically extracted OFF responses (abscissa). Pearson coefficients (r) and associated P values are given in each panel.
Stimulus Strength/Duration-Dependence of the 20- and 40-Hz Components
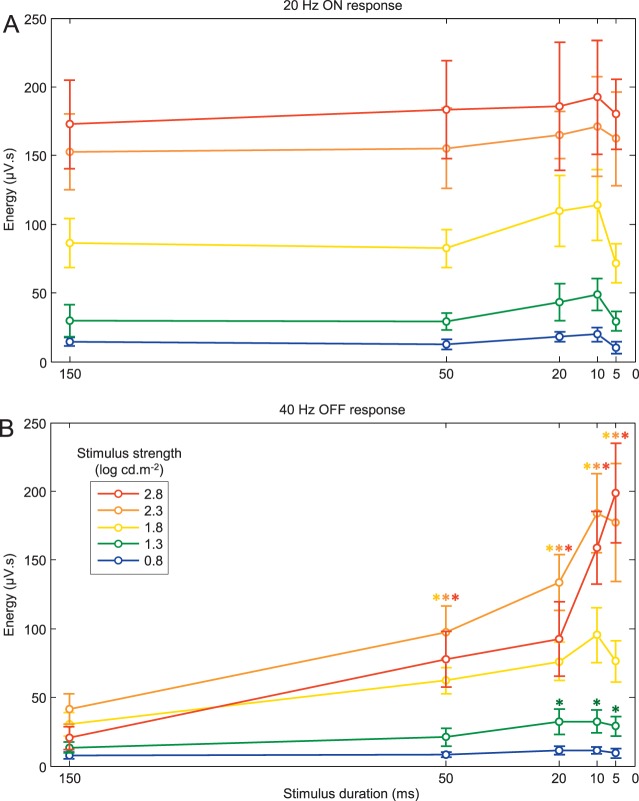
The stimulus strength/duration-dependence (mean ± SD) of the 20-Hz and 40-Hz ERG components are displayed in Figure 4A and B, respectively. As shown in Figure 4A, with progressively brighter stimuli (irrespective of stimulus duration), the 20-Hz component (ON response) regularly increases to reach a maximal value with a flash of 2.8 log cd.m−2 in strength. In contrast, a gradual shortening of the flash duration from 150 to 5 ms, minimally impacts the energy level of the 20-Hz component (averaged variation [i.e., range divided by mean] of 37.22%). The maximal values were reached with the 10-ms flash, irrespective of stimulus strength. The relatively small effect of the stimulus duration on the 20-Hz component is confirmed with the two-way ANOVA statistic, where the F value for the duration effect (F = 6.6; P < 0.05) was 75 times smaller than that of the stimulus strength effect (F = 494.1; P < 0.05). Although both main effects significantly (P < 0.05) modulated the 20-Hz component, the interaction effect was not significant (F = 0.79; P = 0.69), and consequently, no further statistical analyses (i.e., post hoc analyses) were conducted. A different picture emerged with the 40-Hz component (OFF response). As shown in Figure 4B, progressively brighter stimuli increased the 40-Hz component to a maximal value reached with a flash of 2.3 log cd.m−2 in strength, except for the shortest stimulus duration where the maximal value was reached with the 2.8 log cd.m−2 stimulus. Similarly, a progressive shortening of the flash duration from 150 to 5 ms always enhanced this component, albeit to different extents. For example, for the brightest stimulus (red curve), shortening the flash duration from 150 to 5 ms enhanced the 40-Hz component from 20.41 to 198.63 μV.s, representing an increase of 973.21% compared to one of 122.71% when the dimmest stimulus is used. The latter indicates that the enhancement of the OFF component seen with the shorter stimuli is intensity dependent. This claim is best illustrated in Figure 5A, where this facilitatory effect of the OFF component witnessed with progressively shorter stimuli is plotted against the stimulus strength. As shown, this facilitatory effect (i.e., a value greater than 100%) was seen irrespective of the intensity of the stimulus strength. However, the strength of the stimulus exponentially amplified this effect. Consequently, in contrast to the 20-Hz component, both main effects (stimulus duration and strength) of the 40-Hz OFF component were strong. This is best exemplified with the two-way ANOVA statistic with F values of 153.5 and 400.7 (P < 0.05) for stimulus duration and strength, respectively. The interaction effect was also found to be significant (F = 31; P < 0.05). Post hoc analyses revealed that flashes of 50, 20, 10, and 5 ms significantly (P < 0.05) increased (as marked by the colored asterisks) the 40-Hz energy (compared to values obtained with flashes of 150 ms) for stimulus strength of 1.3, 1.8, 2.3, and 2.8 log cd.m−2, but not for the dimmest stimulus (0.8 log cd.m−2).
Figure 4.
Duration/luminance-dependence of 20- and 40-Hz components. (A) Mean (±SD) 20-Hz energy obtained using progressively brighter stimulus strength (0.8: blue curve; 1.3: green curve; 1.8: yellow curve; 2.3: orange curve; 2.8: red curve) and progressively shorter stimulus (from 150 to 5 ms). (B) Mean (±SD) 40-Hz energy obtained using progressively brighter stimulus strength same-color coding as panel A) and progressively shorter stimulus (from 150 to 5 ms).
Figure 5.
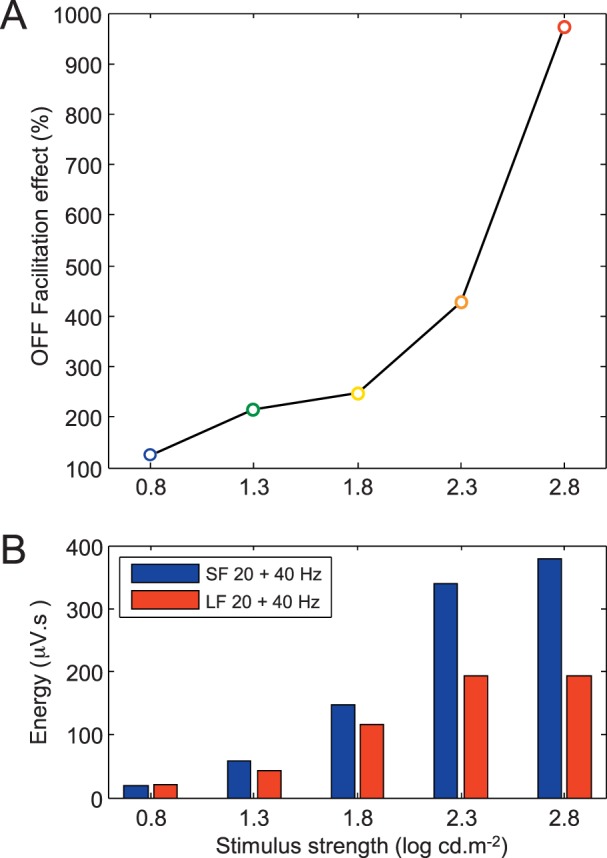
Stimulus strength dependence of the OFF facilitatory effect. (A) Enhancement of the OFF facilitatory effect (i.e., increase in the energy level of the ERG OFF component with progressively shorter stimuli) with progressively brighter stimuli (abscissa). The OFF facilitatory effect was obtained by dividing the 40-Hz energy level measured in the short-flash (i.e., 5 ms) ERG with that measured in the long-flash (i.e., 150 ms) ERGs multiplied by 100. (B) Comparison between the summation of the 20- and 40-Hz components of the short-flash (SF: 5 ms) ERG (blue bars) with the summated 20- and 40-Hz components of the ON and OFF ERGs evoked to a long-flash (LF: 150 ms) stimuli (red bars) of increasing intensities (as indicated at the bottom of each bar graph).
Finally, as shown in Figure 5B, summating the 20- and 40-Hz components of the short-flash (SF: 5 ms) ERG or of the 20- and 40-Hz component of the ON and OFF components of the long-flash (LF: 150 ms) ERGs resulted in similar values (SF: 19.57 μV.s; LF: 22.06 μV.s; P > 0.05) in ERGs evoked to the dimmest flash (0.8 log cd.m−2), but resulted in progressively larger differences when using brighter stimuli (e.g., SF: 378.78 μV.s; LF: 193.04 μV.s; P < 0.05 with the 2.8 log cd.m−2 stimulus). These results would suggest that short-flash ERGs evoked to the dimmest stimulus would result from a simple summation of the ON and OFF components, while with brighter stimulus strengths, this simple addition would not be enough to explain the resulting ERG response, most probably due to the OFF facilitatory effect evidenced at Figure 5A.
Correlations between Frequency Components of Short and Long-Flash Responses
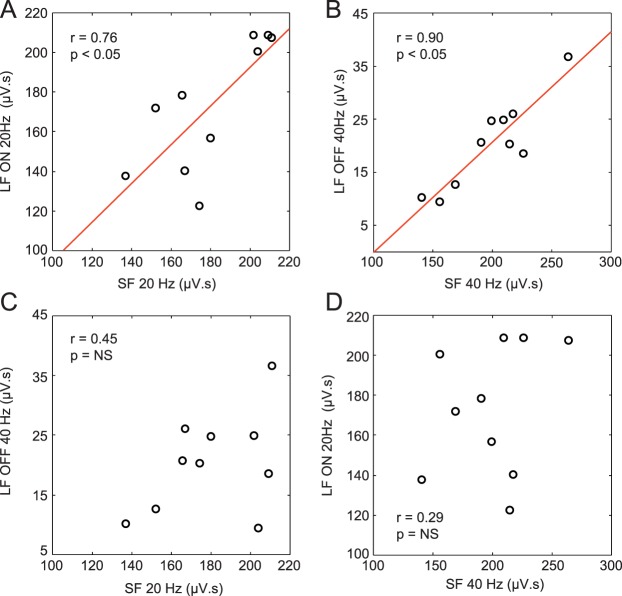
The relationship between 20-Hz and 40-Hz components of the ERG responses evoked by long and short stimuli in the 10 subjects is presented in Figure 6. As exemplified in Figure 6A, there is a strong correlation (r = 0.76; P < 0.05) between the energy level of the 20-Hz component of the short-flash ERG and the 20-Hz component of the ON ERG evoked to the long-duration stimulus. An even stronger correlation (r = 0.90; P < 0.05) was found between the 40-Hz component of ERGs evoked to the short stimuli and the 40-Hz of the OFF ERGs evoked by long-duration stimuli (Fig. 6B). However, no correlation could be found between the 20-Hz component of short-flash ERGs and the 40-Hz component of long-flash OFF ERGs (Fig. 6C) or between the 40-Hz component of short-flash ERGs and the 20-Hz component of long-flash OFF ERGs (Fig. 6D).
Figure 6.
Correlations between short- (SF) and long-duration flash (LF) responses. (A) Correlation between the 20-Hz component of the SF ERG and the 20-Hz component of the ON response of the long-flash ERG. (B) Correlation between the 40-Hz component of the short-flash ERG and the 40-Hz component of the OFF response of the long-flash ERG. (C) Correlation between the 20-Hz component of the short-flash ERG and the 40-Hz component of the OFF response of the long-flash ERG. (D) Correlation between the 40-Hz component of the short-flash ERG and the 20-Hz component of the ON response of the long-flash ERG. Coefficients of correlation (r) and associated P values are indicated on each graph. Nonsignificant P values are indicated as NS. In panels A to D, the black circles represent the data points from each of the 10 subjects.
Discussion
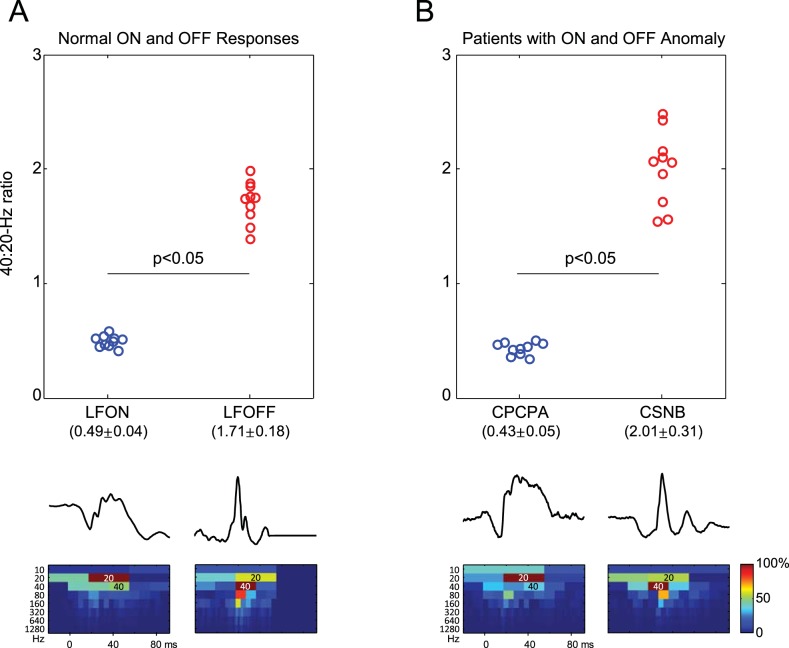
Our results show that the DWT of photopic ERGs evoked to stimuli of long duration allows for the identification of distinct frequency components where the ON ERG is mostly dominated by a 20-Hz component and the OFF ERG by a 40-Hz component, thus confirming previously published findings.2 Consequently, as presented in Figure 7A, the 40:20-Hz energy ratio was smaller than 1 for the ON response (0.49 ± 0.04) and greater than 1 for the OFF response (1.71 ± 0.18). These values are reminiscent of the 40:20-Hz energy ratio previously reported2 (see also Fig. 7B) for the ERGs of patients affected with an OFF-specific anomaly (0.43 ± 0.06; congenital postreceptoral cone pathway anomaly [CPCPA] patients11,12) or an ON-specific anomaly (2.01 ± 0.30; congenital stationary night blindness [CSNB] type 1 patients13–15). Taken together, our findings support the claim that the 20- and 40-Hz components of the short-flash photopic ERG are intimately linked to electrical events within the retinal ON and OFF pathways, respectively. Furthermore, we showed a significant (P < 0.05) correlation (Fig. 6) between the 20-Hz component of the short- and long-flash ERGs as well as between the 40-Hz component of the short- and long-flash ERGs, raising the possibility that, irrespective of flash duration, both components would be generated by the same retinal pathway (such as ON and OFF bipolar cells, 20 and 40 Hz, respectively), a claim that needs to be further investigated.
Figure 7.
Comparison of normal ON and OFF ERG components with CPCPA and CSNB responses. (A) The 40:20-Hz energy ratio was used to segregate the long-flash (LF) ON responses (LFON; blue circles) from the LF OFF responses (LFOFF; red circles). Representative LFON and LFOFF responses and the corresponding DWT scalograms are shown at the bottom of panel A. (B) A similar 40:20-Hz energy ratio was obtained from the short-flash ERGs recorded in patients presenting with an OFF-specific anomaly (CPCPA; blue circles) or an ON-specific anomaly (CSNB; red circles). Representative CPCPA and CSNB ERGs and corresponding DWT scalograms are shown at the bottom of panel B. In the scalograms, the highly energetic dark-red coefficients (indicated as 20 Hz or 40 Hz) further demonstrate the dominant 20- or 40-Hz component measured in LFON and CPCPA ERGs or in LFOFF and CSNB ERGs, respectively.
ON and OFF responses of the photopic ERG can be easily delineated with the use of long-duration stimuli, while these two components blend in ERGs evoked to shorter (< 50 ms) stimuli.16–19 Of interest, the DWT permitted us to quantify the ON and OFF responses based on their separable time-frequency features and therefore unmasked ON-OFF interactions that would have otherwise remained unquantifiable (Fig. 4). While the 20-Hz component of the ON response increases gradually with brighter stimuli, the duration of the stimulus appears to negligibly impact this component (Fig. 4A). In contrast, both flash strength and duration seem to positively impact the 40-Hz component of the OFF ERG (Fig. 4B).
Other authors previously studied ON-OFF interactions within the short-flash ERG. Earlier studies assumed that there was a simple algebraic addition of the two components,20 but this concept was later shown to hold only for ERGs evoked to dim flashes, as selected brighter flashes enhanced the OFF response.21 Similar to what was previously proposed by Howarth (1961), our findings also suggest a simple summation of the ON and OFF components for ERGs evoked to low stimulus strengths (see Fig. 5B).20 However, confirming the claim of Walters et al.,21 our findings also suggest that for the short-duration ERGs evoked to brighter flashes, the algebraic addition no longer works (see Fig. 5B), most probably due to the exponential enhancement of the OFF response (see Fig. 5A). Supporting the latter are findings in patients with an ON-specific anomaly (CSNB) which clearly suggested a facilitating contribution of the OFF pathway in ERGs evoked to bright, short-duration, flashes.7,22 Similarly, Kondo et al.17 showed that reconstructed ERGs obtained by adding the ON and OFF (b-wave + d-waves of a 250-ms ERG response) ERG responses, yielded a waveform that was consistently smaller in amplitude than that measured for the short-flash (5 ms) ERG, where the ON and OFF components are fused together.17 We believe that the above findings find an explanation in our demonstration of the OFF facilitatory effect. Finally, similar to what was previously advanced,2,11,17,23–25 our study further confirms that the OFF pathway significantly contributes to the short-flash ERG. The OFF facilitatory effect could add diagnostically meaningful information to the clinical ERG, a claim that will, however, require further testing. Finally, it is worth remembering that our claims are based on a flash stimulus in which the light is turned ON first and then turned OFF. It would be interesting to investigate if similar conclusions would be reached when the short-flash ERG response is evoked to an OFF-ON stimulus, where the OFF component precedes the ON component.
In conclusion, our results clearly demonstrate that use of the DWT allows for an easy, fast, and reproducible quantification of the ON and OFF retinal pathways using a short-flash ERG, which is the most widely used stimulus in clinical electrophysiology, as it is the standard ERG stimulus prescribed by the International Society for Clinical Electrophysiology of Vision (ISCEV).26 The addition of this novel analytical tool to the armamentarium of retinal electrophysiologists should therefore prove useful in diagnosing, classifying, and staging retinal disorders impairing the retinal function postreceptorally, as an imbalance between the ON and OFF retinal pathways were previously shown to characterize some retinal dystrophies (see Sieving3 for review).
Acknowledgments
This study was funded by grants-in-aid from the Canadian Institutes for Health Research (CIHR) (MOP-126082), scholarships from the Fonds de Recherche du Québec–Santé (FRQ-S) and its thematic research network (Vision Network), as well as by the CIHR (ERA-132932) and FRQ-S (JTC 2013), under the frame of E-Rare-2, the ERA-Net for Research on Rare Diseases. This study was also partially supported by the Slovenian Research Agency (ARRS P3-0333).
References
- 1. Sieving PA,, Murayama K,, Naarendorp F. Push-pull model of the primate photopic electroretinogram: a role for hyperpolarizing neurons in shaping the b-wave. Vis Neurosci. 1994. ; 11: 519–532. [DOI] [PubMed] [Google Scholar]
- 2. Gauvin M,, Little JM,, Lina JM,, Lachapelle P. Functional decomposition of the human ERG based on the discrete wavelet transform. J Vis. 2015. ; 15: 14. [DOI] [PubMed] [Google Scholar]
- 3. Sieving PA, Photopic ON- and OFF-pathway abnormalities in retinal dystrophies. Trans Am Ophthalmol Soc. 1993. ; 91: 701–773. [PMC free article] [PubMed] [Google Scholar]
- 4. Ueno S,, Kondo M,, Ueno M,, Miyata K,, Terasaki H,, Miyake Y. Contribution of retinal neurons to d-wave of primate photopic electroretinograms. Vision Res. 2006. ; 46: 658–664. [DOI] [PubMed] [Google Scholar]
- 5. Hawlina M,, Konec B. New noncorneal HK-loop electrode for clinical electroretinography. Doc Ophthalmol. 1992. ; 81: 253–259. [DOI] [PubMed] [Google Scholar]
- 6. Sustar M,, Hawlina M,, Brecelj J. ON- and OFF-response of the photopic electroretinogram in relation to stimulus characteristics. Doc Ophthalmol. 2006. ; 113: 43–52. [DOI] [PubMed] [Google Scholar]
- 7. Sustar M,, Stirn-Kranjc B,, Hawlina M,, Brecelj J. Photopic ON- and OFF-responses in complete type of congenital stationary night blindness in relation to stimulus intensity. Doc Ophthalmol. 2008. ; 117: 37–46. [DOI] [PubMed] [Google Scholar]
- 8. Gauvin M,, Lina JM,, Lachapelle P. Advance in ERG analysis: from peak time and amplitude to frequency, power, and energy. Biomed Res Int. 2014. ; 2014: 246096. [DOI] [PMC free article] [PubMed] [Google Scholar]
- 9. Gauvin M,, Chakor H,, Koenekoop RK,, Little JM,, Lina JM,, Lachapelle P. Witnessing the first sign of retinitis pigmentosa onset in the allegedly normal eye of a case of unilateral RP: a 30-year follow-up. Doc Ophthalmol. 2016. ; 132: 213–229. [DOI] [PubMed] [Google Scholar]
- 10. Mallat SG. A Wavelet Tour of Signal Processing: The Sparse Way. 3rd ed. Boston: Elsevier/Academic Press; 2009: xx, 805. [Google Scholar]
- 11. Garon ML,, Dorfman AL,, Racine J,, Koenekoop RK,, Little JM,, Lachapelle P. Estimating ON. and OFF contributions to the photopic hill: normative data and clinical applications. Doc Ophthalmol. 2014. ; 129: 9–16. [DOI] [PubMed] [Google Scholar]
- 12. Lachapelle P,, Rousseau S,, McKerral M,, et al. Evidence supportive of a functional discrimination between photopic oscillatory potentials as revealed with cone and rod mediated retinopathies. Doc Ophthalmol. 1998. ; 95: 35–54. [DOI] [PubMed] [Google Scholar]
- 13. Bech-Hansen NT,, Naylor MJ,, Maybaum TA,, et al. Mutations in NYX, encoding the leucine-rich proteoglycan nyctalopin, cause X-linked complete congenital stationary night blindness. Nat Genet. 2000. ; 26: 319–323. [DOI] [PubMed] [Google Scholar]
- 14. Pusch CM,, Zeitz C,, Brandau O,, et al. The complete form of X-linked congenital stationary night blindness is caused by mutations in a gene encoding a leucine-rich repeat protein. Nat Genet. 2000. ; 26: 324–327. [DOI] [PubMed] [Google Scholar]
- 15. Miyake Y. Establishment of the concept of new clinical entities–complete and incomplete form of congenital stationary night blindness [in Japanese]. Nippon Ganka Gakkai Zasshi. 2002. ; 106: 737–755, discussion 756. [PubMed] [Google Scholar]
- 16. Alexander KR,, Fishman GA,, Peachey NS,, Marchese AL,, Tso MO. ‘On' response defect in paraneoplastic night blindness with cutaneous malignant melanoma. Invest Ophthalmol Vis Sci. 1992. ; 33: 477–483. [PubMed] [Google Scholar]
- 17. Kondo M,, Piao CH,, Tanikawa A,, Horiguchi M,, Terasaki H,, Miyake Y. Amplitude decrease of photopic ERG b-wave at higher stimulus intensities in humans. Jpn J Ophthalmol. 2000. ; 44: 20–28. [DOI] [PubMed] [Google Scholar]
- 18. Miyake Y,, Yagasaki K,, Horiguchi M,, Kawase Y. On-responses and Off-responses in photopic electroretinogram in complete and incomplete types of congenital stationary night blindness. Jpn J Ophthalmol. 1987. ; 31: 81. [PubMed] [Google Scholar]
- 19. Ruether K,, Kellner U. Inner retinal function in hereditary retinal dystrophies. Acta Anat. 1998. ; 162: 169–177. [DOI] [PubMed] [Google Scholar]
- 20. Howarth CI. On-off interaction in the human electroretinogram. J Opt Soc Am. 1961. ; 51: 345–352. [DOI] [PubMed] [Google Scholar]
- 21. Walters JW,, Smith EL,, Manny RE. Erg off-effects produced by short duration stimuli. Am J Optom Physiol Opt. 1981. ; 58: 792–796. [DOI] [PubMed] [Google Scholar]
- 22. Sustar M,, Brecelj J,, Stirn-Kranjc B,, Racine J,, Lachapelle P. On-off summation in the short flash photopic ERG is intensity-dependent. Doc Ophthalmol. 2012. ; 124: 37–38.
- 23. Ueno S,, Kondo M,, Niwa Y,, Terasaki H,, Miyake Y. Luminance dependence of neural components that underlies the primate photopic electroretinogram. Invest Ophthalmol Vis Sci. 2004. ; 45: 1033–1040. [DOI] [PubMed] [Google Scholar]
- 24. Young RSL. Low-frequency component of the photopic Erg in patients with X-linked congenital stationary night blindness. Clin Vision Sci. 1991. ; 6: 309–315. [Google Scholar]
- 25. Hamilton R,, Bees MA,, Chaplin CA,, McCulloch DL. The luminance-response function of the human photopic electroretinogram: a mathematical model. Vision Res. 2007. ; 47: 2968–2972. [DOI] [PubMed] [Google Scholar]
- 26. McCulloch DL,, Marmor MF,, Brigell MG,, et al. ISCEV standard for full-field clinical electroretinography (2015 update). Doc Ophthalmol. 2015. ; 130: 1–12. [DOI] [PubMed] [Google Scholar]


