Abstract
A significant change in the Western diet, concurrent with the obesity epidemic, was a substitution of saturated fatty acids with polyunsaturated, specifically linoleic acid (LA). Despite increasing investigation on type as well as amount of fat, it is unclear which fatty acids are most obesogenic. The objective of this study was to determine the obesogenic potency of LA vs. saturated fatty acids, and the involvement of hypothalamic inflammation. Forty-eight mice were divided into 4 groups: low-fat or 3 high fat diets (HFD, 45% kcals from fat) with LA comprising 1%, 15%, and 22.5% of kilocalories, the balance being saturated fatty acids. Over 12 weeks, bodyweight and composition, food intake, calorimetry, and glycemia assays were performed. Arcuate nucleus and blood were collected for mRNA and protein analysis. All HFD-fed mice were heavier and less glucose tolerant than control. 22.5% LA caused greater bodyweight gain, decreased activity and insulin resistance compared to control and 1% LA. All HFDs elevated leptin and decreased ghrelin in plasma. Neuropeptides gene expression was higher in 22.5% HFD. The inflammatory gene Ikk was suppressed in 1% and 22.5% LA. No consistent pattern of inflammatory gene expression was observed, with suppression and augmentation of genes by one or all of the HFDs relative to control. These data indicate that in male mice, LA induces obesity and insulin resistance, and reduces activity, more than saturated fat, supporting the hypothesis that increased LA intake may be a contributor to the obesity epidemic.
Keywords: obesity, HFD, hypothalamic inflammation, saturated fat, PUFA, linoleic acid
1. Introduction
Obesity in the United States is increasing in prevalence, and shows association with many serious, non-communicable diseases [1]. This has motivated an extensive effort to discover causes of obesity and develop methods for prevention and treatment. The high-fat diet (HFD)-fed mouse is a widely used model for diet-induced obesity (DIO) [2]. Compared to the “cafeteria diet,” it provides nutrient consistency, and high sucrose diets, unless also high in fat [3,4], produce a lean mouse [5,6]. Although recognized as the best DIO model, a better understanding of the influence of fatty acid (FA) profile would aid in discovery of mechanisms and treatments.
Both saturated [7,8] and n-6 polyunsaturated [9,10] fatty acids (SFA and PUFA) have been identified as obesogenic compared to other FA. Incorrect FA profile reporting may be causing these divergent results. The FA profile of experimental diets is rarely confirmed with gas chromatography, but instead reported from a nutrient database. Recent testing by Research Diets (Research Diets, Inc., New Brunswick, NJ) showed that lard, commonly used in HFDs, contains twice the amount of PUFA, mostly as linoleic acid (LA), reported on the USDA National Nutrient Database for Standard Reference Release [11]. Similarly, the FAs consumed by the relevant human population should factor into DIO research. Total fat intake was not greatly changed during the 20th century, and any change in total fat was dwarfed by the increase in PUFA (primarily LA) at the expense of SFA and oleic acid [12]. Accurate reporting of FA profile and integrating epidemiological data are necessary prerequisites to theorizing on mechanisms of obesity.
One candidate mechanism for DIO is hypothalamic inflammation (HI), in which fatty acids play a large part [13–17]. In short, chronic low-grade inflammation impairs neuronal sensing of energy status, resulting in a melanocortin system that acts as if adipose storage was insufficient on downstream neuronal circuits controlling feeding behavior and energy expenditure. One proposed HI pathway is activation of Toll-like receptor 4 (TLR4) by SFA [7,18]. Indeed, knockout of TLR4 abrogated DIO from an SFA-rich HFD but, interestingly, not from an LA-rich HFD, which produced greater obesity regardless of TLR4 status [19]. Although important to innate immunity through the recognition of lipopolysaccharide, TLR4 is not the entirety of the inflammatory system. Central inflammation [20] and metabolic derangement due to HI [21] can be a response to reactive oxidative species. PUFA are the only fatty acids prone to non-enzymatic oxidation at mammalian body temperatures. Acyl chain carbon-hydrogen bonds surrounded by carbon-carbon double bonds are susceptible to nucleophilic attack [22]. Thus, inflammatory mechanisms exist for SFA and PUFA.
Due to the contradictory data on FAs in rodent DIO research, the Western diet being modeled, and the involvement of FA in HI, we hypothesized that LA will cause more weight gain, metabolic derangements, and greater expression of HI markers than SFA. We fed male WT C57BL6/J mice one of three HFDs with equal fat content but different FA profiles and measured weight, food intake, glucose metabolism, indirect calorimetry, and activity. Upon sacrifice, we measured plasma metabolic peptides and biomarker mRNA of HI and metabolism in the arcuate nucleus of the hypothalamus.
2. Material and methods
2.1 Animal Care
All animal treatments were in accordance with institutional guidelines based on National Institutes of Health standards and performed with Institutional Animal Care and Use Committee approval at Rutgers University. Male WT C57BL6/J mice were selectively bred in-house, maintained under controlled temperature (23°C) and photoperiod conditions (12/12 h light/dark cycle), and given access to food and water ad libitum. Mice were weaned and ear-tagged at post-natal day 21 and housed in groups until start of experiment.
2.2 Experimental Diets
All experimental diets were prepared as pellets by Research Diets (New Brunswick, NJ). FA profile was assured through in-house gas chromatography/mass spectroscopy. Our control diet (CON) was Research Diets D12450B (10% kcals from fat). This was to control for environmental effects, no diet can truly control for fat amount or type, as macronutrient exclusion requires either compensatory nutrient inclusion or relative caloric deficit. Our 3 HFDs were isocaloric and isolipidic to Research Diets D12451 (45% kcals from fat) and named for the amount of calories derived from LA; 1% = mostly coconut oil with some seed oils, 15% = a more even mixture of coconut oil and seed oils, 22.5% = mostly safflower and sunflower seed oils (see Table 1 for FA profile). We chose to maintain a constant n-3 content rather than a constant n-6/n-3 ratio, as this is more similar to the Western dietary change we are modeling. Coconut oil was used for SFA because all other food sources, such as lard, butter, or tallow, have significant amounts of n-3 and n-6 PUFA, and comparing synthetic- with food-derived FAs would also confound the interpretation. Although the chain length is probably a factor in obesity, palmitate from tallow has been shown to be less obesogenic than safflower oil [23]. All diets had identical protein, fiber, and micronutrient contents.
Table 1.
Diet Fat Compositions
| Diets | CON | 1% | 15% | 22.5% |
|---|---|---|---|---|
| kcals/g | 3.85 | 4.7 | 4.7 | 4.7 |
| Oils (g) | 45 | 202.5 | 202.5 | 202.5 |
| Coconut oil | 0 | 133 | 64.5 | 21.5 |
| Flaxseed oil | 0 | 10 | 10 | 10 |
| Lard | 20 | 0 | 0 | 0 |
| Safflower oil | 0 | 0 | 45 | 45 |
| Soybean oil | 25 | 2 | 2 | 2 |
| Sunflower oil | 0 | 57.5 | 81 | 124 |
| Carbohydrate (g) | 700 | 255.6 | 255.6 | 255.6 |
| Protein (g) | 203 | 203 | 203 | 203 |
| % energy from carbohydrate | 70 | 31 | 31 | 31 |
| % energy from protein | 20 | 24 | 24 | 24 |
| % energy from fat | 10 | 45 | 45 | 45 |
| % from SFA | 2.26 | 31 | 17 | 8 |
| % from LA | 4.22 | 1 | 15 | 22.5 |
| Fatty acids (g) | 43.3 | 199.8 | 199.9 | 199.6 |
| C6, Caproic | 0.0 | 0.8 | 0.4 | 0.1 |
| C8, Caprylic | 0.0 | 10.2 | 5.0 | 1.7 |
| C10, Capric | 0.0 | 7.8 | 3.8 | 1.3 |
| C12, Lauric | 0.0 | 63.3 | 30.7 | 10.2 |
| C14, Myristic | 0.2 | 23.9 | 11.6 | 3.9 |
| C16, Palmitic | 6.5 | 14.0 | 12.9 | 11.9 |
| C16:1, Palmitoleic | 0.3 | 0.0 | 0.0 | 0.0 |
| C18, Stearic | 3.1 | 16.9 | 11.0 | 7.4 |
| C18:1, Oleic | 12.6 | 52.4 | 51.0 | 55.8 |
| C18:2, Linoleic | 18.3 | 4.7 | 67.7 | 101.4 |
| C18:3, Linolenic | 2.2 | 5.8 | 5.8 | 5.9 |
| C20:4, Arachidonic | 0.1 | 0.0 | 0.0 | 0.0 |
| C20:5, Eicosapentaenoic | 0.0 | 0.0 | 0.0 | 0.0 |
| C22:6, Docosahexaenoic | 0.0 | 0.0 | 0.0 | 0.0 |
| SFA (%) | 22.7 | 69 | 37.7 | 18.3 |
| MUFA (%) | 29.9 | 26 | 25.5 | 28.0 |
| PUFA (%) | 47.4 | 5 | 36.8 | 53.7 |
2.3 Experimental Design
Experimental feeding began at 12 weeks of age. See Table 2 for timeline. Mice were housed 3 per cage and given ad libitum access to food and water. Body weight and food intake (per cage food intake) were recorded weekly for 12 weeks followed by body composition measurements using an EchoMRI 3-in-1 Body Composition Analyzer (Echo Medical Systems, Houston, TX, USA) and calorimetric and activity measurements (48 h run) via Columbus Instruments’ Comprehensive Lab Animal Monitoring System (CLAMS) (Columbus Instruments, Inc., Columbus, OH, USA). A glucose tolerance test (GTT), following an overnight fast, was administered via intraperitoneal (ip) injection of 2g/kg glucose in 0.9% saline solution. Blood glucose (BG) from tail blood was measured with an AlphaTrak 2 Blood Glucose Monitoring System (Abbott Laboratories, Abbott Park, IL, USA) pre-injection and 15, 30, 60, 90, 120 and 180 minutes post-injection. An insulin tolerance test (ITT) following a 5 h fast involved an injection of 0.5 U/kg insulin (Humulin R, Lilly, Indianapolis, IN, USA) in 0.9% saline solution and followed the same BG measurement scheme as GTT. Mice were given 4 days of rest each between CLAMS, GTT, and ITT.
Table 2.
Primer sequences
| Gene Name |
Forward Primer | Reverse Primer | Accession # |
|---|---|---|---|
| Actb | GCCCTGAGGCTCTTTTCCA | TAGTTTCATGGATGCCACAGGA | NM_007393.3 |
| Agrp | CTCCACTGAAGGGCATCAGAA | ATCTAGCACCTCCGCCAAA | NM_007427.2 |
| Cart | GCTCAAGAGTAAACGCATTCC | GTCCCTTCACAAGCACTTCAA | NM_013732 |
|
Cx3cl 1 |
ACGAAATGCGAAATCATGTGC | CTGTGTCGTCTCCAGGACAA | NM_009142.3 |
| Hprt | GCTTGCTGGTGAAAAGGACCTCTCGAA G |
CCCTGAAGTACTCATTATAGTCAAGGGC AT |
NM_013556 |
| Icam1 | GTGATGCTCAGGTATCCATCCA | CACAGTTCTCAAAGCACAGCG | NM_010493.2 |
| Ikk | CCATATCCTGGCTGTCACCT | GGCACCTTGGATGACCTAGA |
NM_001159774. 1 |
| Il-1 | GCAACTGTTCCTGAACTCAACT | ATCTTTTGGGGTCCGTCAACT | NM_008361.3 |
| Il-6 | GAGATCGACTCTCTGTTCGAGG | GCCCGTTGAAGAAGTCCTG | NM_010479.2 |
| Il-15 | ACATCCATCTCGTGCTACTTGT | GCCTCTGTTTTAGGGAGACCT | NM_008357.2 |
| Insr | GTGTTCGGAACCTGATGAC | GTGATACCAGAGCATAGGAG | NM_010568 |
| Lepr | AGAATGACGCAGGGCTGTAT | TCCTTGTGCCCAGGAACAAT | NM_146146.2 |
| Npy | ACTGACCCTCGCTCTATCTC | TCTCAGGGCTGGATCTCTTG | NM_023456 |
| Pai1 | TTCAGCCCTTGCTTGCCTC | ACACTTTTACTCCGAAGTCGGT | NM_008871.2 |
| Pomc | GGAAGATGCCGAGATTCTGC | TCCGTTGCCAGGAAACAC | NM_008895 |
| Socs3 | TTCACGGCTGCCAACATCT | GCTAGTCCCGAAGCGAAATCT | NM_007707.3 |
| Stat3 | TTCCTGGCACCTTGGATTG | CGAAGGTTGTGCTGATAGAG | NM_213659.2 |
| Tlr4 | ATGGCATGGCTTACACCACC | GAGGCCAATTTTGTCTCCACA | NM_021297.2 |
| Traf6 | ATCTCTGAGGATCATCAAGTACATTGT | TGTGTGTATTAACCTGGCACTTCTG | NM_009424.2 |
2.4 Tissue Collection
At completion of physiological assays, mice were given another 4 days of rest while remaining on the same diet and then killed by decapitation after ketamine sedation (100 µl of 100 mg/ml, ip). Trunk blood was collected and prepared for plasma analysis of peptide hormones and cytokines by Luminex Magpix multiplex (EMD Millipore, Billerica, Massachusetts, USA). Plasma was prepared by adding a protease inhibitor, 4-(2-Aminoethyl) benzenesulfonyl fluoride hydrochloride (AEBSF, 1 mg/mL, Sigma-Aldrich) to each K+ EDTA collection tube. Samples were maintained on ice until centrifugation at 3,000 rpm for 10 min at 4°C. Supernatant was then collected and stored at −80°C until analysis. In preparation for RNA extraction and measurement, the basal hypothalamus was cut using a brain slicer matrix (Ted Pella, Inc., Redding, CA, USA), into one mm thick coronal rostral and caudal slices corresponding to Plates 42 to 47 and Plates 48 to 53, respectively, from The Mouse Brain in Stereotaxic Coordinates [24]. The slices were transferred to RNAlater (Life Technologies, Inc., Grand Island, NE, USA) and stored overnight at 4°C. The rostral and caudal parts of the arcuate nucleus were dissected using a dissecting microscope. The combined arcuate tissue was stored at −80°C. Total RNA was extracted from combined nuclei (rostral and caudal arcuate) using Ambion RNAqueous-Micro Kits (Life Technologies, Inc.) according to the manufacturer’s protocol. Total RNA was DNase I-treated, using the extraction kits, at 37°C for 30 min to minimize genomic DNA contamination. RNA quantity and quality were determined using a NanoDrop ND-2000 spectrophotometer (ThermoFisher, Inc., Waltham, MA, USA) and an Agilent 2100 Bioanalyzer and RNA Nano Chips (Agilent Technologies, Inc., Santa Clara, CA, USA). Samples with an RNA Integrity Number below 6 were not used.
2.5 Quantitative Real-Time PCR
cDNA was synthesized from 200 ng of total RNA using Superscript III reverse transcriptase (Life Technologies, Inc.), 4 µl 5× Buffer, 25 mM MgCl2, 10 mM dNTP (Clontech Laboratories, Inc., Mountain View, CA, USA), 100 ng random hexamer primers (Promega Corporation, Madison, WI, USA), 40 U/µl Rnasin (Promega) and 100 mM DTT in DEPC-treated water (GeneMate, Bioexpress, Inc., Kaysville, UT, USA) to a total volume of 20 µl. Reverse transcription was conducted using the following protocol: 5 min at 25°C, 60 min at 50°C, and 15 min at 70°C. The cDNA was diluted 1:20 with Nuclease-free water (GeneMate, Bioexpress) for a final cDNA concentration of 0.5 ng/µl and stored at −20°C. All primers were designed to span exon-exon junctions and synthesized by Life Technologies, Inc., using Clone Manager 5 software (Sci Ed Software, Cary, NC, USA). See Table 2 for a list of all primer sets used for quantitative real-time PCR (qPCR). For qPCR, 4 µl of cDNA template (an equivalent of 2 ng total RNA) was amplified using either PowerSYBR Green master mix (Life Technologies) or Sso Advanced SYBR Green (BioRad, Inc., Hercules, CA, USA) on CFX-Connect Real-time PCR instrument (BioRad). Standard curves for each primer pair were prepared using serial dilutions of BH cDNA in triplicate to determine the efficiency [E = 10(−1/m) – 1, m = slope] of each primer pair. All efficiencies expressed as percent efficiency were approximately equal (one doubling per cycle, 90–110%). The relative mRNA expression data was analyzed using the ΔΔCT method [25,26]. Amplification protocol for all the genes was as follows: initial denaturing at 95°C for 10 min (PowerSYBR) or 3 min (Sso Advanced) followed by 40 cycles of amplification at 94°C for 10 s (denaturing), 60°C for 45 s (annealing), and completed with a dissociation step for melting point analysis with 60 cycles of 95°C for 10 s, 65°C to 95°C (in increments of 0.5°C) for 5 s and 95°C for 5 s. The Cq geomean of reference genes, ActB and Hprt, were used to calculate fold change. Quantification values were generated only from samples showing a single product at the expected melting point.
2.6 Data analysis
All data are expressed as means ± SEM. All data from the weekly body weight measurements, GTT, ITT, and all CLAMS data were analyzed using a repeated measures two-way ANOVA followed by a post hoc Bonferroni-Dunn multiple comparisons test. All data from the food intake, body composition, plasma protein, and arcuate qPCR experiments were analyzed using a one-way ANOVA followed by a post hoc Bonferroni-Dunn multiple comparisons test (unpaired). All data analyses were performed on GraphPad Prism 6 software (GraphPad Software, Inc., La Jolla, CA, USA) and in all cases, effects were considered significant at p<0.05.
3. Results
3.1 Body weight is affected primarily by HFD, secondarily by LA
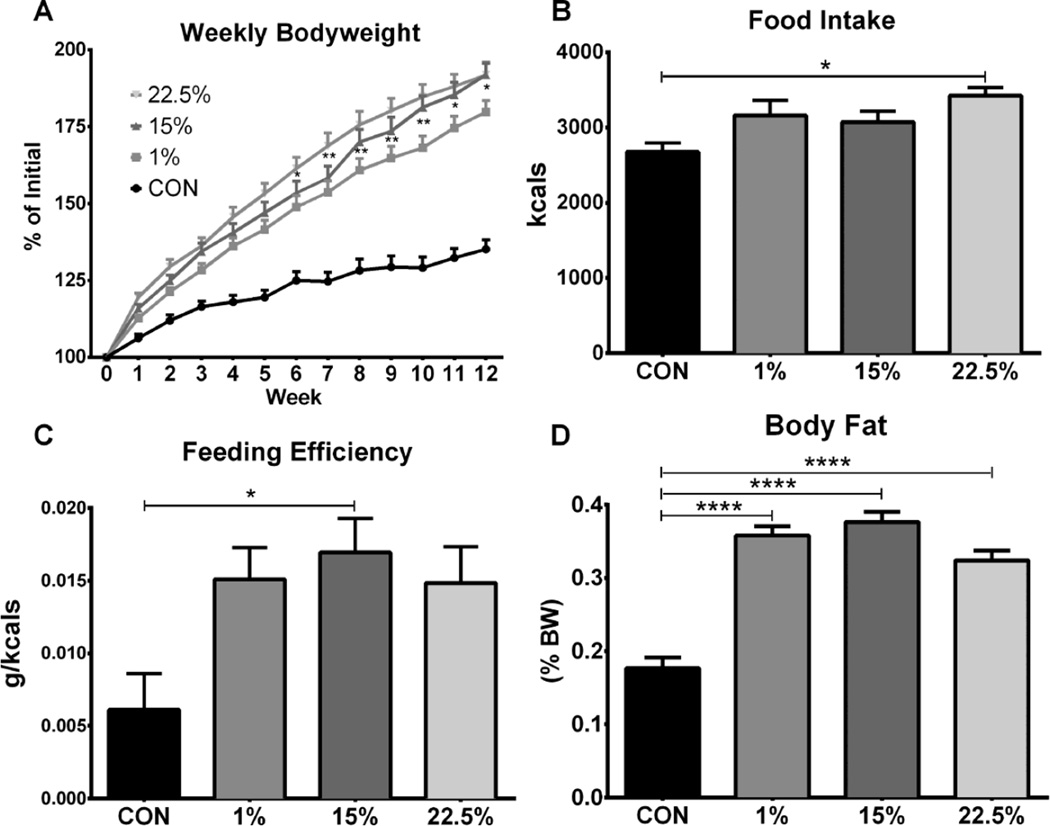
To determine the potential of LA vs. SFA to cause obesity, we fed male mice one of three HFDs with a range of LA concentrations (1%, 15%, 22.5%), or a low fat control diet (CON) for 12 weeks. All 3 HFD groups gained more than twice the amount of weight as CON (F (3, 44) = 33.58, p < 0.0001). Weight gain of 22.5% became greater than CON at week 1, which persisted for the remaining 11 weeks; 15% and 1% diverged from CON at weeks 2 and 3, respectively (Figure 1A). At week 6, weight gain of 22.5% became greater than 1% (p < 0.05), and remained so through week 12. Weight gain of 15% was higher than 1% at weeks 10 and 12 (p < 0.05). Food intake (F (3, 12) = 4.448, p = 0.0254) and feeding efficiency (F (3, 40) = 4.148, p < 0.0119) trended higher for all HFDs; food intake of 22.5% (p<0.05, Figure 1B) and feeding efficiency of 15% (p < 0.05, Figure 1C) were different than CON. All 3 HFD (p < 0.0001) groups had a similar body fat percentage, which was higher than CON (Figure 1D; F (1, 88) = 743.1, p < 0.0001).
Fig. 1.
Body weight gain, composition, and food intake in mice fed low vs. high LA HFD. (A) Three month old male mice fed either CON, 1%, 15% or 22.5% were weighed weekly for 12 weeks. Asterisks at weeks 7 and 8 denote comparison between 1% and 22.5% and at weeks 9–12 between 1% and both 15% and 22.5%. (B) Weekly food weight (g) was summed and multiplied by caloric content (kcals/g) to calculate cumulative intake in kcals. (C) Feeding efficiency was calculated by dividing weight gained (g) by food consumed (kcals) over 12 weeks. (D) Body composition was measured after 12 weeks by EchoMRI; body fat was divided by body weight. Data (n=12) were analyzed by a repeated measures, two-way ANOVA (A) or one-way ANOVA (B, C, D) with Bonferroni-Dunn multiple comparisons test. (* p<0.05; ** p<0.01; **** p<0.0001).
3.2 Glucose metabolism altered by HFD and LA
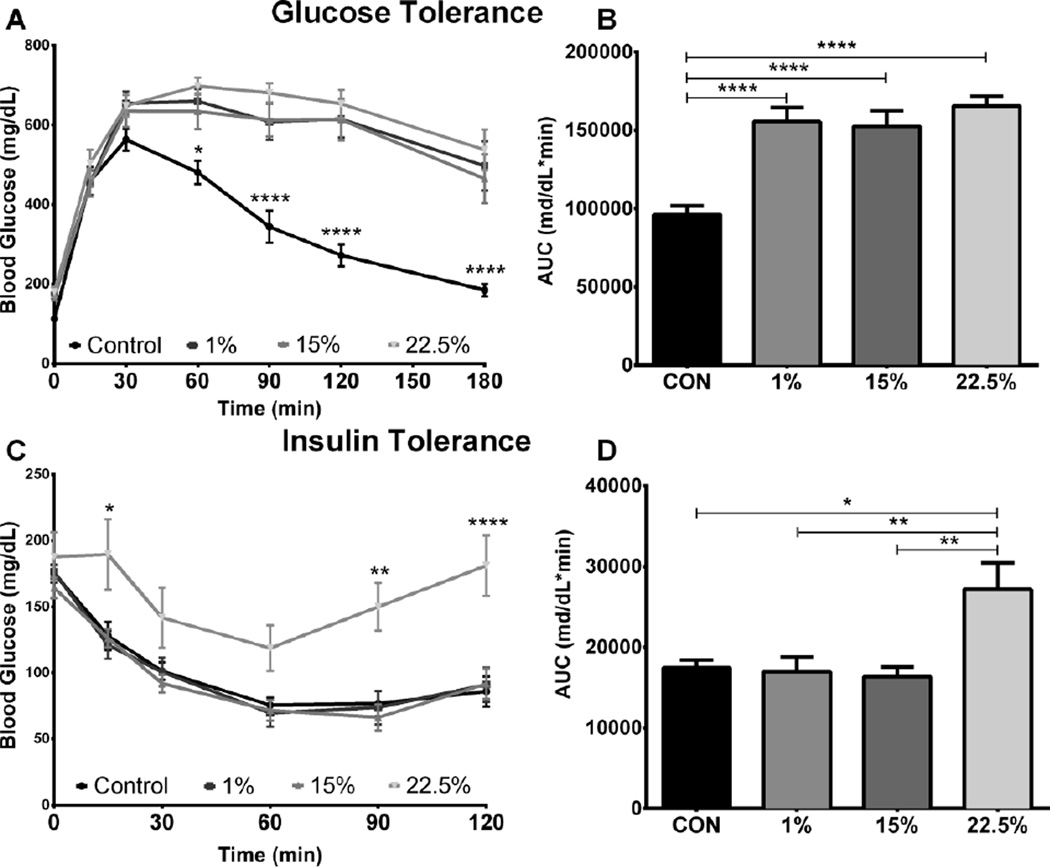
The effects of LA and SFA on glucose metabolism were measured through glucose and insulin tolerance tests administered post 12-week experimental feeding. Fasting glucose was elevated in all HFD groups (mean BG = 165.4 ± 6.0 mg/dl, 171.6 ± 7.8 mg/dL, and 180.3 ± 12.6 mg/dL for 1%, 15%, and 22.5%, respectively) compared to CON (mean = 112.8 ± 6.7 mg/dL; F (3, 44) = 148.0, p < 0.0001). Glucose disposal during GTT was similarly impaired in all 3 HFD groups compared to CON from the 60 through 180-min time points (Figure 2A; F (3, 43) = 12.98, p < 0.0001). GTT AUC values for the HFD groups (p < 0.0001) were higher than CON (Figure 2B; F (3, 43) = 14.59, p < 0.0001), suggesting fat content was the primary factor influencing glucose tolerance.
Fig. 2.
Glucose metabolism is impaired by HFD and LA. (A) Blood glucose was measured for 3 hours post IP glucose injection into fasted mice (n=11). (B) Area under the curve integrated from glucose challenge time point measurements. (C) Blood glucose was measured for 2 hours post IP insulin injection into fasted mice (n=9). (D) Area under the curve integrated from insulin challenge time point measurements. Data were analyzed by a repeated measures, two-way (A, C) or one-way (B, D) ANOVA with Bonferroni-Dunn multiple comparisons test. (* p<0.05; ** p<0.01; **** p<0.0001).
Insulin suppressed BG equally in CON, 1% and 15%; 22.5% had higher BG during most time points, including the endpoint (Figure 2C; p < 0.0001), of the 2-hour challenge (F (3, 41) = 6.056, p < 0.0016). ITT AUC was higher in 22.5% than CON (p < 0.05) and also higher than 1% and 15% (Figure 2D; p < 0.01), indicating insulin resistance from LA (F (3, 41) = 6.065, p < 0.0016).
3.3 CO2 production reduced by HFD, O2 consumption mildly reduced by SFA
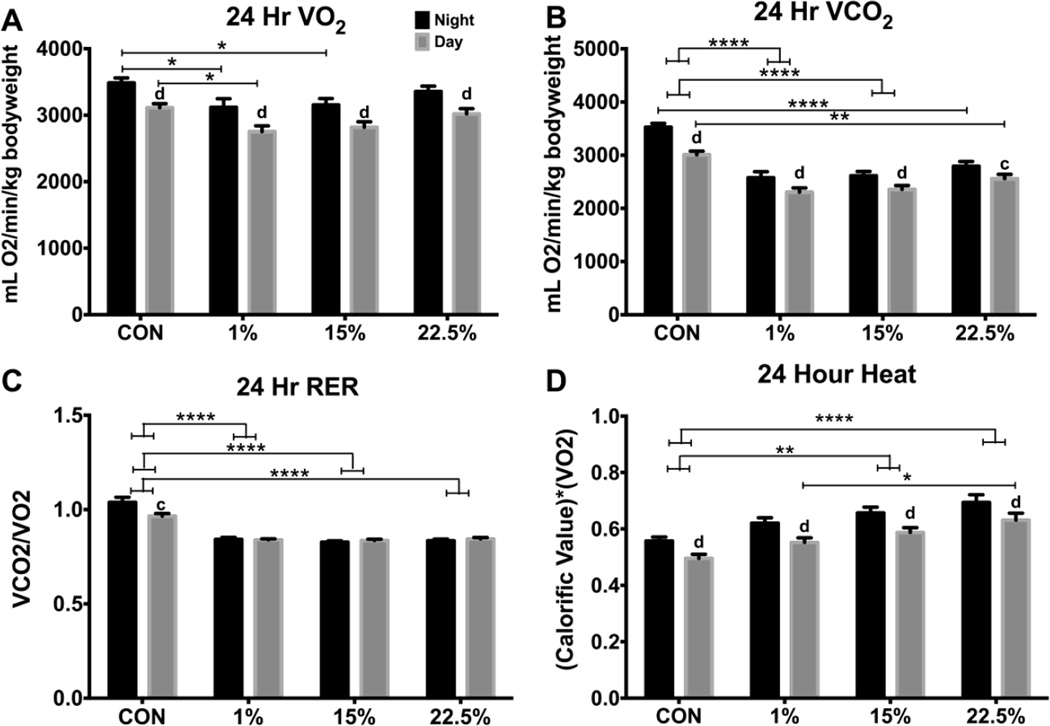
To characterize the effect of LA and SFA on metabolism, we measured O2 consumption and CO2 production by mice singly housed in Columbus Instruments CLAMS cages. Data from light (day) and dark (night) periods from the last 24 h were analyzed separately. Nighttime O2 consumption was higher than daytime for all diets (F (1, 80) = 31.76, p < 0.0001). Within nighttime hours, O2 consumption was lower in 1% (p < 0.05) and 15% (p < 0.05) than CON (Figure 3A; diet: F (3, 40) = 3.989, p < 0.05; time: F (1, 40) = 252.3, p < 0.0001), while daytime O2 consumption was only lower in 1% (p < 0.05, Figure 3A). This suggests suppressed respiration by SFA or increased extra-respiratory consumption of O2 by PUFA [22]. All 3 HFD groups had lower day and night CO2 production than CON (Figure 3B; p < 0.0001 except daytime CON vs. 22.5% p < 0.01). As expected from greater availability of fat for use as energy substrate, there were effects of diet (F (3, 40) = 24.26, p < 0.0001), time (F (1, 40) = 136.8, p < 0.0001); and time*diet (F (3, 40) = 5.998, p < 0.01). Respiratory exchange ratio (RER), or VCO2/VO2, followed the VCO2 pattern; all 3 HFD groups had lower RER than CON during both day and night (p < 0.0001, Figure 3C; diet: F (3, 40) = 69.8, p < 0.0001; time*diet: F (3, 40) = 5.811, p < 0.01). Interestingly, daytime vs. nighttime RER was only different for CON (p < 0.001) and was not different within HFD groups. Heat, an indirect measurement of metabolism using the product of RER and VO2, was higher in 15% (p < 0.01) and 22.5% (p < 0.0001) than CON (Figure 3D; diet: F (3, 40) = 9.135, p < 0.0001; time: F (1, 40) = 216.9, p < 0.0001). Daytime heat was higher in 22.5% than 1% (p < 0.05).
Fig. 3.
Twenty-four hour indirect calorimetry of mice fed low vs. high LA HFD. (A) Nighttime (black bars) and daytime (grey bars) average O2 consumption (mL/min) was divided by bodyweight (kg). (B) Nighttime and daytime average CO2 production (mL/min) was divided by bodyweight (kg). (C) VCO2/VO2. (D) Heat is the product of “calorific value” (3.815 + 1.232 * RER) and VO2. Data (n=10) were analyzed by a repeated measures, two-way ANOVA with Bonferroni-Dunn multiple comparisons test Asterisks denote comparisons between diets and letters denote comparisons within diets (a,* p<0.05; b,** p<0.01; c,***p<0.001; d,**** p<0.0001).
3.4 Nighttime activity reduced by LA
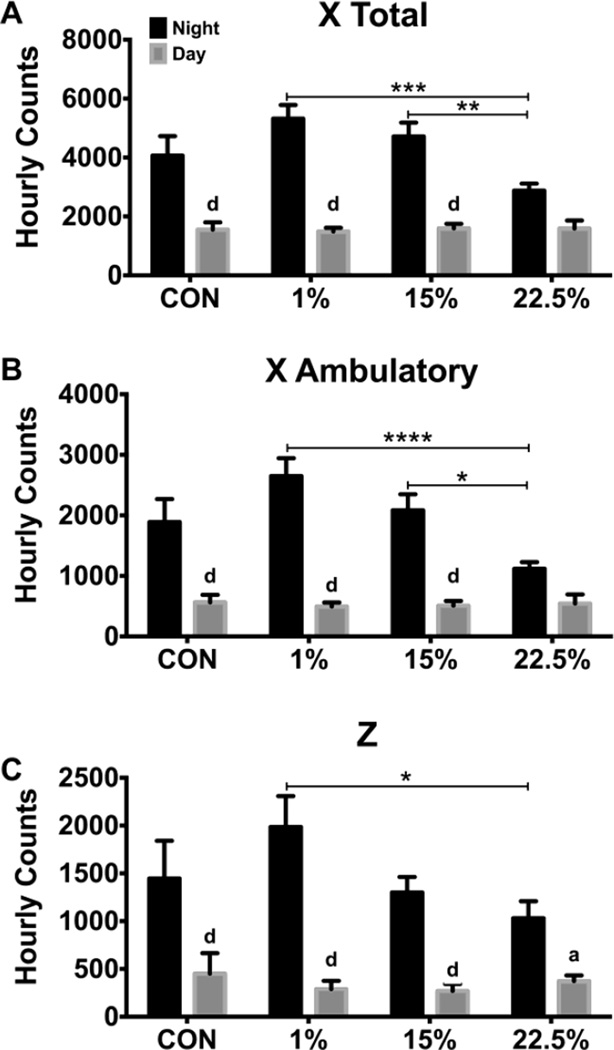
Beam breaks in the X and Z-axes were counted to determine differences in spontaneous activity. Daytime activity was similar across all groups. Activity was different between the daytime and nighttime in all diets except for the 22.5% diet in both X total and X ambulatory (Figure 4A–B). Elevated LA content in the HFD reduced X total and X ambulatory nighttime activity. Nighttime total X plane activity was lower in the 22.5% than both the 1% (p < 0.001) and 15% (p < 0.01; time: F (1, 40) = 179.1, p < 0.0001; time*diet: F (3, 40) = 6.897, p < 0.001). Nighttime ambulatory X plane activity was also lower in the 22.5% diet than both the 1% (p < 0.0001) and 15% (p < 0.05; diet: F (3, 40) = 2.875, p < 0.05; time: F (1, 40) = 128.7, p < 0.0001; time*diet: F (3, 40) = 6.67, p < 0.001). Nighttime Z plane activity was reduced by 22.5% LA compared to 1% (p < 0.05; time: F (1, 40) = 116.0, p < 0.00001; time*diet: F (3, 40) = 4.439, p < 0.01).
Fig. 4.
Nighttime movement was reduced by LA. (A) Average nighttime (black bars) and daytime (grey bars) beam breaks in the X plane. (B) Average nighttime and daytime novel beam breaks, indicating movement (ambulation) in the X plane. (C) Average nighttime and daytime beam breaks in the Z plane. Data (n=10) were analyzed by a repeated measures, two-way ANOVA with Bonferroni-Dunn multiple comparisons test. Asterisks denote comparisons between diets and letters denote comparisons within diets (a,* p<0.05; b,** p<0.01; c,***p<0.001; d,**** p<0.0001).
3.5 Plasma ghrelin and leptin affected by HFD
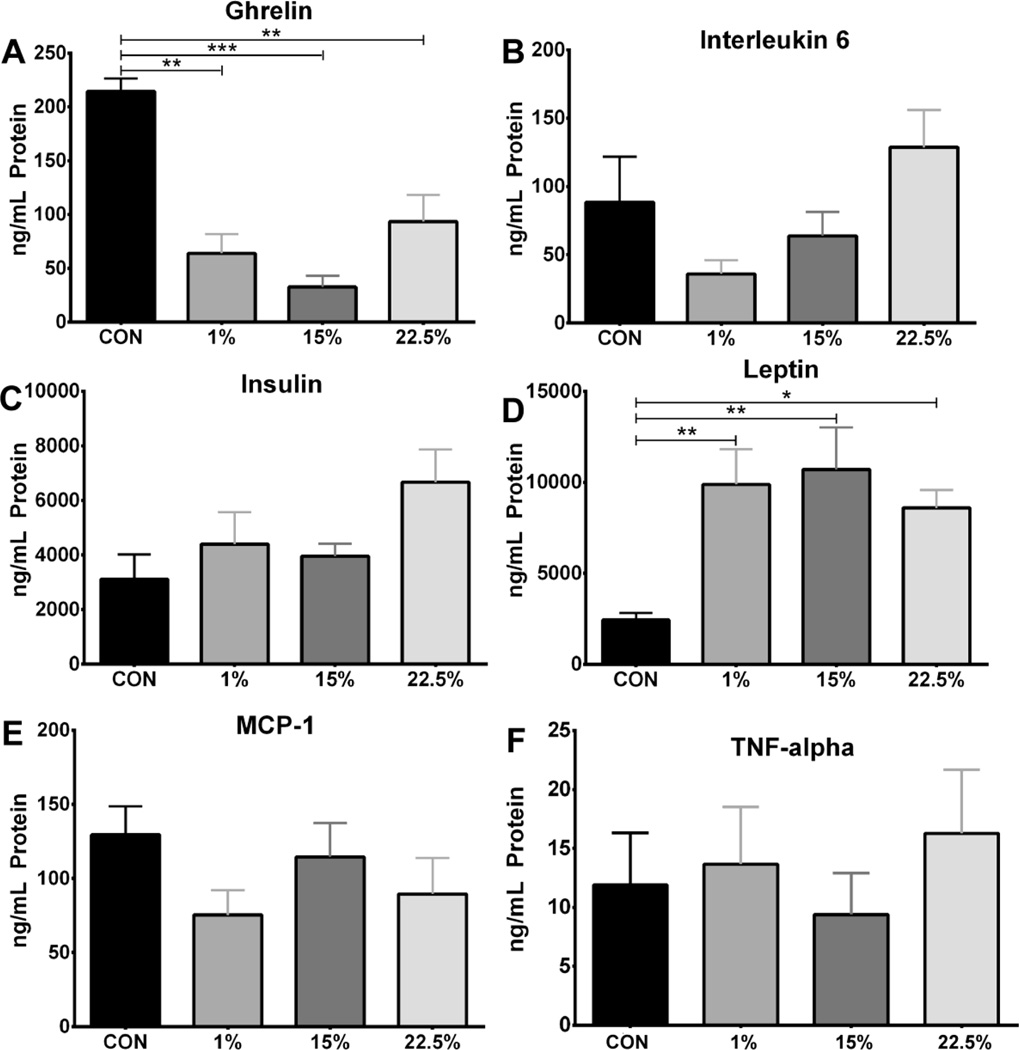
Plasma concentrations of the cytokines IL-6, MCP-1, and TNF-α and the peptide hormones ghrelin, insulin, and leptin were measured to indicate systemic inflammation and metabolic syndrome from LA and SFA feeding. There were no differences in plasma levels of IL-6, insulin, MCP-1, or TNF-α (Figure 5B, C, E, F). Plasma ghrelin was higher in CON than 1% (p < 0.01), 15% (p < 0.001) and 22.5% (p < 0.01), indicating a suppression of ghrelin by dietary fat (Figure 5A; F (3, 23) = 9.630, p < 0.001). Plasma leptin had an opposite pattern to ghrelin, being lower in CON than 1% (p < 0.01), 15% (p < 0.01), and 22.5% (p < 0.05; Figure 5D; F (3, 43) = 5.795, p < 0.01). All HFD groups had similar leptin levels, consistent with the correlation between fat mass and circulating leptin.
Fig. 5.
Serum ghrelin and leptin affected by HFD. Average serum protein levels (ng/mL) of (A) ghrelin (n=6), (B) interleukin-6 (n=11), (C) insulin (n=12), (D) leptin (n=12), (E) MCP-1 (n=8), and (F) TNF-α (n=8). Data were analyzed by a one-way ANOVA with Bonferroni-Dunn multiple comparisons test (* p<0.05; ** p<0.01; *** p<0.001).
3.6 Hypothalamic neuropeptide expression affected by LA
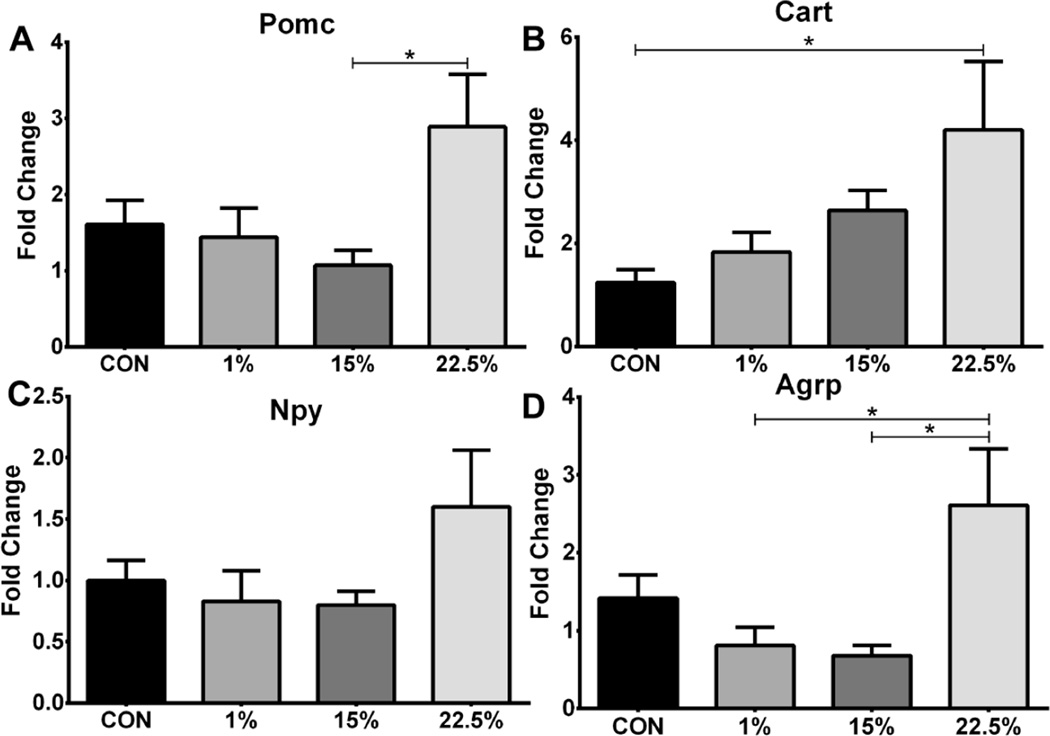
The expression of orexigenic and anorexigenic genes from the arcuate nucleus was measured to identify differences in energy balance related neuronal activity between groups. mRNA of all neuropeptides trended higher in 22.5%. Expression of Pomc was higher in 22.5% than 15% (p<0.05; Figure 6A; F (3, 37) = 3.300, p < 0.05), and that of Cart was higher in 22.5% than CON (p<0.05; Figure 6B; F (3, 37) = 3.259, p < 0.05). Agrp expression was greater in 22.5% than both 1% and 15% (p<0.05; Figure 7D; F (3, 36) = 4.431, p < 0.01)).
Fig. 6.
Neuropeptide mRNA levels of mice fed low vs. high LA HFD. Average relative expression of (A) Pomc, (B) Cart, (C) Npy, and (D) Agrp neuropeptides in arcuate nucleus. Data (n=9–11) were analyzed by a one-way ANOVA with Bonferroni-Dunn multiple comparisons test (* p<0.05).
Fig. 7.
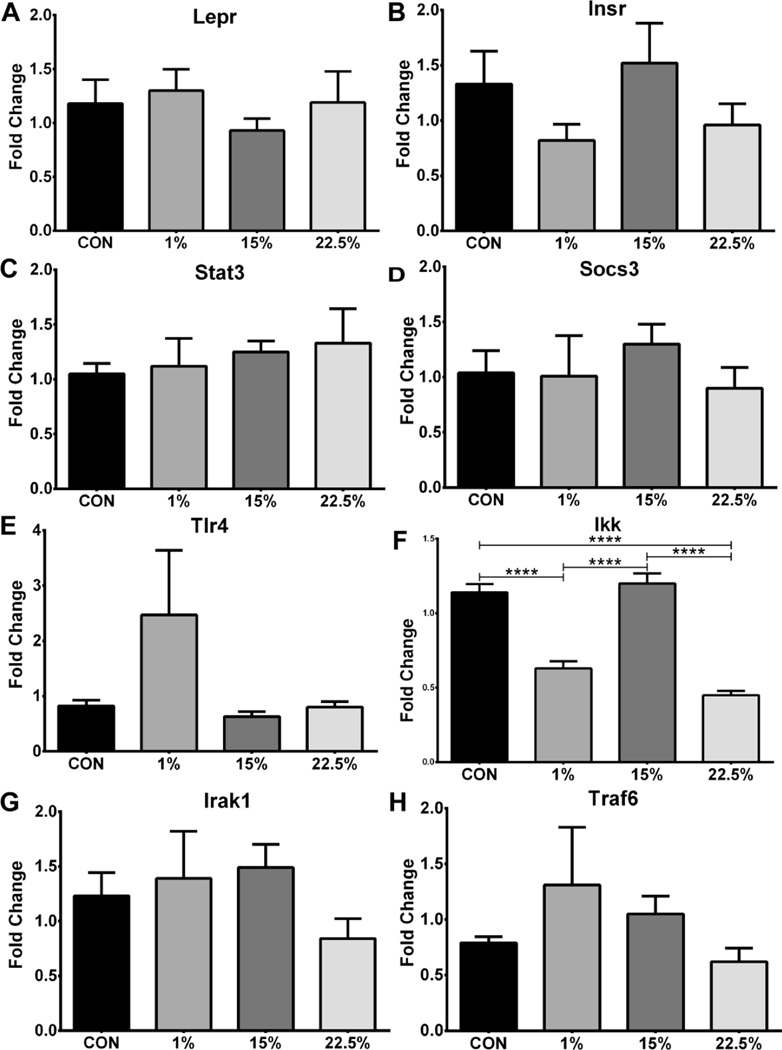
Receptor and signal transducer mRNA. Average relative expression of (A) Lepr, (B) Stat3, (C) Tlr4, (D) Irak1, (E) Insr, (F) Socs3, (G) Traf6, and (H) Ikk mRNA in arcuate nucleus. Data (n=7–11) were analyzed by a one-way ANOVA with Bonferroni-Dunn multiple comparisons test (**** p<0.0001).
3.7 Ikk expression suppressed by LA and SFA in arcuate nucleus
In order to further characterize a central obesogenic profile, expression of hormone receptors and down-stream transducers of hormone and cytokine signaling was measured. Despite higher serum leptin in the HFD groups, arcuate Lepr expression was not different between diets (Figure 7A). Insr, Stat3, Socs3, Irak1 and Traf6 likewise were not different between groups. Tlr4 trended higher in 1% but exhibited large variability (Figure 7C; F (3, 30) = 2.293; p < 0.0981). The inflammatory switch Ikk was slightly lower in 22.5% than 1% (p<0.0001; Figure 7F; F (3, 31) = 52.44, p < 0.0001), but both 1% and 22.5% had greatly reduced Ikk expression compared to CON and 15% (p<0.0001).
3.8 CX3CL1 suppressed by LA, Il-6 by LA and SFA, other cytokines unchanged
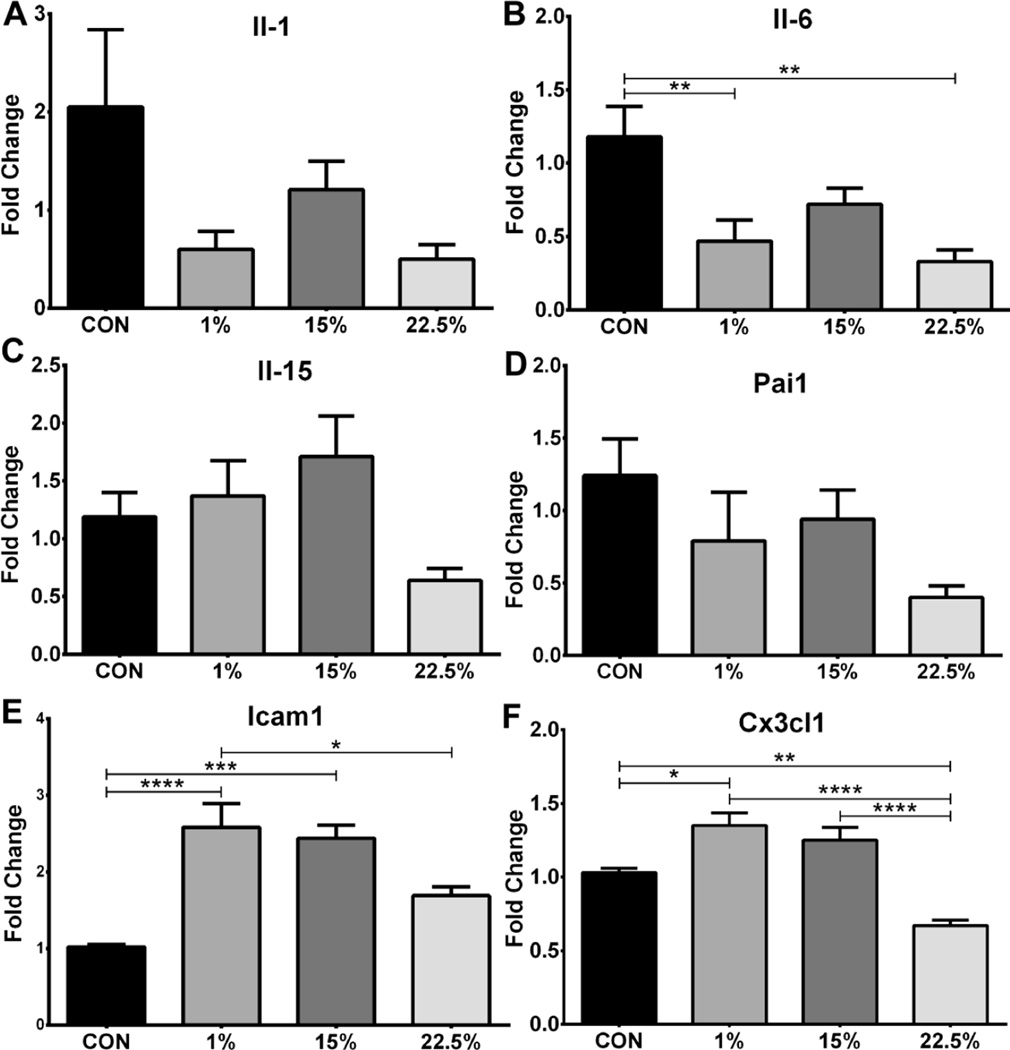
Expression of inflammation-related cytokine and chemo-attractant genes was measured in the arcuate nucleus as an indication of HI. The cytokines Il-1 and Il15 (Figures 8A, C) were not changed by diet. The serine protease inhibitor Pai1 (Figure 8D) was also not different between groups. Il-6 expression was suppressed in 1% and 22.5% relative to CON (p<0.01; Figure 8B; F (3, 30) = 6.473, p < 0.01), similar to Ikk. Expression of the adhesion molecule Icam1 was similar between 1% and 15% but was lower in 22.5% than 1% (p<0.05) and lower in CON than both 1% and 15% (p<0.001; Figure 8E; F (3, 26) = 13.22, p < 0.0001) The chemokine Cx3cl1 had similar expression in 1% and 15% and CON expression was lower than 1% (p<0.05) and 22.5% was less than CON (p<0.01) and both 1% and 15% (p<0.0001; Figure 8F; F (3, 29) = 20.08, p < 0.0001).
Fig. 8.
Inflammatory cytokine and chemoattractant mRNA. Average relative expression of (A) Il-1, (B) Il-6, (C) Il-15, (D) Pai1, (E) Icam1, and (F) Cx3cl1 mRNA in arcuate nucleus. Data (n=7–10) were analyzed by a one-way ANOVA with Bonferroni-Dunn multiple comparisons test (* p<0.05; ** p<0.01; *** p<0.001; **** p<0.0001).
4. Discussion
There is a body of working showing LA to be more obesogenic than SFA. In the current study, we showed that LA-rich HFD caused greater weight gain than SFA, although the effect is not as large as the results obtained previously by other groups. In those studies, mice or rats were fed SFA from coconut oil, which resulted in no difference in weight gain and adiposity compared to CON [10] or greater weight gain than CON but much less than the LA group [9]. In another study, rats were fed HFDs made with either tallow, olive oil, or sunflower seed oil; the tallow HFD caused the least weight gain [23]. Although total dietary fat was the most important metabolic factor in our study, 22.5% LA HFD did decrease activity and induce insulin resistance compared to 1%, and altered arcuate melanocortin gene expression compared to the other groups. Arcuate expression of inflammatory genes was variably suppressed, depending on the gene, by both SFA and LA.
Alternatively, there are studies showing SFA to be more obesogenic than PUFA, but the majority of these studies used lard as the SFA source. Lard is not a suitable fat for comparing weight gain from different fatty acids since most lard now contains an FA profile approximately balanced between SFA, PUFA, and MUFA [11]. When demonstrating lard to be more obesogenic than soy and cottonseed oil [27] or flaxseed and olive oil [28], the comparison is not between SFA and PUFA in general but between palmitic and oleic acids, or stearic and linolenic acids, depending on the study. In both cases, LA is not an experimental variable, maintaining a steady content in those experimental HFDs. The dietary change that occurred in Western countries, however, was a large increase in LA at the expense of other FAs. The effects of LA compared to other FAs should be a focus of DIO research.
The maintenance of glucose homeostasis was affected by HFD and LA. In response to a glucose challenge, all 3 HFD groups responded with similarly impaired glucose disposal relative to CON. This is in agreement with the Randle Cycle [29], whereby the oxidation of fatty acids in mitochondria inhibits that of glucose and by extension cellular glucose uptake. The amount of insulin needed to drive the observed clearance of glucose is unknown because we did not measure blood insulin during the GTT. When a dose of insulin based on body weight was given, however, it had a similar effect on blood glucose for CON, 1%, and 15%, but elicited a reduced effect in 22.5%. These results suggest that the 22.5% group would require more insulin in order to achieve a rate of glucose disposal equal to CON, 1% and 15%. Previously, impairment of glucose disposal has been shown during both GTT and hyperinsulinemic-euglycemic clamp proportional to dietary n-6 PUFA [30]. This suggests fatty acids are not equal in their participation in the Randle Cycle. Indeed, medium chain saturated fatty acids are not dependent on nor do they affect the carnitine acyltransferase system as do the longer, unsaturated fatty acids [31,32].
All HFD groups had lower RER than CON, a result of their depressed VCO2. This is consistent with the ability of RER to predict substrate intake [33] as mitochondrial oxidation of FA produces less CO2 per molecule ATP than does carbohydrate oxidation. VO2 between the 3 HFD groups was not different, but compared to CON both 1% and 15% nighttime and 1% daytime VO2 was slightly lower, indicating a trend of VO2 suppression by SFA or increase by LA. Presumably, this effect is not due to an increased metabolic rate by LA as 22.5% was the heaviest group and had similar feeding efficiency as 1% and 15%. In indirect calorimetry, VO2 is measured at the whole animal rather than cellular/organelle level, hence the quotient of VCO2/VO2 reported as RER and not respiratory quotient. This is because non-respiratory O2 consumption is counted the same as respiratory consumption. An example of non-respiratory O2 consumption is lipid peroxidation, such as oxidation of PUFA-rich LDL [34]. As previously mentioned, only PUFA oxidize non-enzymatically at physiological temperatures, with greater chain length and number of double bonds increasing oxidative risk.
There was an effect of LA in reducing activity, particularly during nighttime, as shown in X and Z plane counts for 22.5% vs. 1%. In our study, calorimetry was performed after the 12-week experimental feeding, at which time all HFD mice were obese. Therefore, reduced activity may have been causal of or caused by DIO. Previous studies have alternately concluded activity does [35] and does not [36] contribute to DIO in mice. Our study suggests that LA may contribute more to reduced activity than SFA. Previously, substitution of n-3 with n-6 PUFA causes anxiety-like behavior in mice such as reduced spontaneous activity [37], but it is unclear whether it is the presence of n-6 or absence of n-3 PUFA that is responsible. The nature of removing nutrients, such as FA, in experimental diets cannot be isolated from the presence of its substitute, obfuscating causation.
We found that plasma ghrelin levels were lower and leptin levels higher in all HFD groups compared to CON. Ghrelin is an orexigen, and a ligand for the growth hormone secretagogue receptor. It has been shown in obese humans [38] and HFD-fed mice [39] that ghrelin levels are lower as an adaptation to positive energy balance. Our results with plasma leptin suggest that fatty acid type does not strongly affect leptin secretion and confirms its correspondence to adiposity.
Food intake was fairly consistent across groups, with only an increase in 22.5% compared to CON; this could be due to higher Agrp expression. A high SFA-containing HFD has been shown to suppress Npy and Agrp expression [40]; the higher SFA content in the 1% and 15% groups may explain why they did not have increased expression of either gene compared to CON, while maintaining high food intake during positive energy balance. The pattern of neuropeptide expression did not fully correlate with observed food intake and body weight gain. Although leptin, a stimulator of hypothalamic Pomc production, was higher in the plasma of all HFD groups, only 22.5% had increased Pomc expression. The co-expressed neuropeptide Cart, also stimulated by leptin, showed a similar expression pattern. Npy and Agrp, neuropeptides associated with orexigenic behavior, were largely unchanged between groups except for 22.5% having increased Agrp.
Arcuate mRNA levels of hormone receptors, cytokine receptors, and their ligands did not point to any group having significantly elevated HI or blunted receptor signaling. Interestingly, arcuate Lepr expression was not different between groups, despite higher plasma leptin in the HFD groups. Expression of Tlr4 trended higher in 1% compared to the other groups, consistent with previous studies showing SFA activation of Tlr4 [7,18,19], supposedly through resemblance to the putative ligand, lipopolysaccharide. Production of TLR4 transcription targets, however, was mostly suppressed by 1% and 22.5%, especially Ikk, Il-1 and Il-6. Furthermore, it is unclear whether increased expression of Tlr4 indicates receptor activation or, if it has negative feedback, absence of activation. Among TLR4’s many proposed ligands, pathways, and targets, some hundreds of positive and negative feedback loops occur [41]; little is known about what controls receptor abundance. TLR4 activation by SFA could have caused the slightly increased expression in 1% of CX3CL1, a chemokine that is produced by dendritic cells under lipopolysaccharide stimulation [42], and Icam1.
Furthermore, the hypothesis that SFA induces TLR4 activation may be artifactual or, at least, confounded by the unforeseen effects of experimental reagents. Indeed, the research showing this is primarily treatment of immortalized cell lines with FA in bovine serum albumin (BSA); treatment of BSA with polymyxin-B to rid it of LPS does not remove other immune-activating contaminants such as di and tri-acyl lipopeptides and flagellin [43]. While showing BSAs ability to activate TLR4 by itself, Erridge and Samani also showed that SFA, whether in decontaminated BSA or delivered purely, is unable to do so. TLR4 activation by dietary SFA in vivo has not been investigated to the same extent as in vitro, and how the two phenomenon are related is unknown.
In conclusion, SFA- and LA-rich HFDs induced obesity and disturbed metabolic profiles in the mouse compared to a low-fat diet. However, LA produced greater body weight gain and insulin resistance, and suppressed activity more than the SFA. The dissimilar results between this study and many others [9,10,23] describing the effects of HFD differing in FA composition illustrates the need for carefully designing and reporting experimental diets and viewing results within that context. Although it seems obvious that fat intake is involved in the obesity epidemic, at the molecular level it is unclear which fats mediate DIO or the particular mechanism. It may be that different FAs induce obesity through different mechanisms, for example SFA through TLR signaling and LA through inhibiting glucose oxidation via the Randle Cycle. Future experiments should characterize the effects of these FA on hypothalamic neuronal activity (POMC and NPY/AgRP) and on other measurements and pathways activated during hypothalamic inflammation from DIO. Other elements in experimental diets and overall experimental design may potentiate or contribute to these mechanisms. Improved attention to these details of experimental design and observation will be necessary to fully elucidate mechanisms of DIO in humans and in animal models.
Highlights.
High linoleic acid (LA) diet caused greater weight gain than high saturated fat (SFA) diet
All diets reduced glucose clearance but only high LA diet reduced insulin sensitivity
All diets reduced V.C02 and RER but only high LA diet reduced nighttime activity
High LA diet augmented arcuate Pomc, Cart, and Agrp expression
Both high LA and SFA diets altered expression of inflammatory genes – Ikk, Il6, Icam1, and Cx3cl1
Acknowledgments
The authors thank Dr. Sara Campbell for the use of the EMD Millipore MAGPIX® Multiplex® System and Dr. Judy Storch for the use of the Comprehensive Lab Animal Monitoring System and EchoMRI Body Composition Analyzer. This research was supported by funds from USDA-NIFA NJ06107 and from National Institutes of Health R00DK083457, R00DK083457-S1, and P30ES005022.
Footnotes
Publisher's Disclaimer: This is a PDF file of an unedited manuscript that has been accepted for publication. As a service to our customers we are providing this early version of the manuscript. The manuscript will undergo copyediting, typesetting, and review of the resulting proof before it is published in its final citable form. Please note that during the production process errors may be discovered which could affect the content, and all legal disclaimers that apply to the journal pertain.
References
- 1.Flegal KM, Carroll MD, Ogden CL, Curtin LR. Prevalence and Trends in Obesity Among US Adults, 1999–2008. JAMA. 2013;303:235–241. doi: 10.1001/jama.2009.2014. [DOI] [PubMed] [Google Scholar]
- 2.Tschöp M, Heiman ML. Rodent obesity models: An overview Endocrinology & Diabetes. Exp Clin Endocrinol Diabetes. 2001;109:307–319. doi: 10.1055/s-2001-17297. [DOI] [PubMed] [Google Scholar]
- 3.Murase T, Mizuno T, Omachi T, Onizawa K, Komine Y, Kondo H, et al. Dietary diacylglycerol suppresses high fat and high sucrose diet-induced body fat accumulation in C57BL/6J mice. J Lipid Res. 2001;42:372–378. [PubMed] [Google Scholar]
- 4.Lomba A, Milagro FI, García-Díaz DF, Marti A, Campión J, Martínez JA. Obesity induced by a pair-fed high fat sucrose diet: methylation and expression pattern of genes related to energy homeostasis. Lipids Health Dis. 2010;9:60. doi: 10.1186/1476-511X-9-60. [DOI] [PMC free article] [PubMed] [Google Scholar]
- 5.Surwit RS, Feinglos JR, Sutherland A, Petro AE, Opara EC, Kuhn CM, et al. Differential Effects of Fat and Sucrose on the Development of Obesity and Diabetes in C57BL/6J and A/J Mice. Metabolism. 1995;44:645–651. doi: 10.1016/0026-0495(95)90123-x. [DOI] [PubMed] [Google Scholar]
- 6.Black BL, Croom J, Eisen EJ, Petro a E, Edwards CL, Surwit RS. Differential effects of fat and sucrose on body composition in A/J and C57BL/6 mice. Metabolism. 1998;47:1354–1359. doi: 10.1016/s0026-0495(98)90304-3. [DOI] [PubMed] [Google Scholar]
- 7.Milanski M, Degasperi G, Coope A, Morari J, Denis R, Cintra DE, et al. Saturated Fatty Acids Produce an Inflammatory Response Predominantly through the Activation of TLR4 Signaling in Hypothalamus: Implications for the Pathogenesis of Obesity. J Neurosci. 2009;29:359–370. doi: 10.1523/JNEUROSCI.2760-08.2009. [DOI] [PMC free article] [PubMed] [Google Scholar]
- 8.Kim F, Pham M, Luttrell I, Bannerman DD, Tupper J, Thaler J, et al. Toll-Like Receptor-4 Mediates Vascular Inflammation and Insulin Resistance in Diet-Induced Obesity. 2007:1589–1596. doi: 10.1161/CIRCRESAHA.106.142851. [DOI] [PubMed] [Google Scholar]
- 9.Diniz YS, Cicogna AC, Padovani CR, Santana LS, Faine La, Novelli ELB. Diets Rich in Saturated and Polyunsaturated Fatty Acids: Metabolic Shifting and Cardiac Health. Nutrition. 2004;20:230–234. doi: 10.1016/j.nut.2003.10.012. [DOI] [PubMed] [Google Scholar]
- 10.Alvheim AR, Malde MK, Osei-Hyiaman D, Lin YH, Pawlosky RJ, Madsen L, et al. Dietary Linoleic Acid Elevates Endogenous 2-AG and Anandamide and Induces Obesity. Obesity. 2012;20:1984–1994. doi: 10.1038/oby.2012.38. [DOI] [PMC free article] [PubMed] [Google Scholar]
- 11.Research Diets I. Typical Composition of Lard Used by Research Diets, Inc. Research Diets, Inc; 2012. [Google Scholar]
- 12.Blasbalg TL, Hibbeln JR, Ramsden CE, Majchrzak SF, Rawlings RR. Changes in consumption of omega-3 and omega-6 fatty acids in the United States during the 20th century. Am J Clin Nutr. 2011;93:950–962. doi: 10.3945/ajcn.110.006643. [DOI] [PMC free article] [PubMed] [Google Scholar]
- 13.Cai D, Liu T. Hypothalamic inflammation: a double-edged sword to nutritional diseases. Ann N Y Acad Sci. 2011;1243:E1–E39. doi: 10.1111/j.1749-6632.2011.06388.x. [DOI] [PMC free article] [PubMed] [Google Scholar]
- 14.Wisse BE, Schwartz MW. Does Hypothalamic Inflammation Cause Obesity? Cell Metab. 2009;10:241–242. doi: 10.1016/j.cmet.2009.09.003. [DOI] [PubMed] [Google Scholar]
- 15.Thaler JP, Schwartz MW. Minireview: Inflammation and obesity pathogenesis: the hypothalamus heats up. Endocrinology. 2010;151:4109–4115. doi: 10.1210/en.2010-0336. [DOI] [PMC free article] [PubMed] [Google Scholar]
- 16.Velloso La, Araújo EP, de Souza CT. Diet-induced inflammation of the hypothalamus in obesity. Neuroimmunomodulation. 2008;15:189–193. doi: 10.1159/000153423. [DOI] [PubMed] [Google Scholar]
- 17.De Souza CT, Araujo EP, Bordin S, Ashimine R, Zollner RL, Boschero AC, et al. Consumption of a fat-rich diet activates a proinflammatory response and induces insulin resistance in the hypothalamus. Endocrinology. 2005;146:4192–4199. doi: 10.1210/en.2004-1520. [DOI] [PubMed] [Google Scholar]
- 18.Shi H, Kokoeva MV, Inouye K, Tzameli I, Yin H, Flier JS. TLR4 links innate immunity and fatty acid – induced insulin resistance. J Clin Invest. 2006;116:3015–3025. doi: 10.1172/JCI28898. [DOI] [PMC free article] [PubMed] [Google Scholar]
- 19.Davis JE, Gabler NK, Walker-Daniels J, Spurlock ME. Tlr-4 deficiency selectively protects against obesity induced by diets high in saturated fat. Obesity (Silver Spring) 2008;16:1248–1255. doi: 10.1038/oby.2008.210. [DOI] [PubMed] [Google Scholar]
- 20.Farooqui T, Farooqui AA. Lipid-Mediated Oxidative Stress and Inflammation in the Pathogenesis of Parkinson’s Disease. 2011:2011. doi: 10.4061/2011/247467. [DOI] [PMC free article] [PubMed] [Google Scholar]
- 21.Cai D, Liu T. Inflammatory cause of metabolic syndrome via brain stress and NF-κB. Aging (Albany NY) 2012;4:98–115. doi: 10.18632/aging.100431. [DOI] [PMC free article] [PubMed] [Google Scholar]
- 22.Yin H, Xu L, Porter NA. Free Radical Lipid Peroxidation: Mechanisms and Analysis. Chem Rev. 2011;111:5944–5972. doi: 10.1021/cr200084z. [DOI] [PubMed] [Google Scholar]
- 23.Pan DA, Storlien LH. Dietary Lipid Profile Is a Determinant of Tissue Phospholipid Fatty Acid Composition and Rate of Weight Gain in Rats. J Nutr. 1993:512–519. doi: 10.1093/jn/123.3.512. [DOI] [PubMed] [Google Scholar]
- 24.Keith B, Franklin G, Paxinos G. The mouse brain in stereotaxic coordinates. Calif Acad. 2008 [Google Scholar]
- 25.Livak KJ, Schmittgen TD. Analysis of relative gene expression data using real-time quantitative PCR and the 2-ÄÄCT method. Methods. 2001;25:402–408. doi: 10.1006/meth.2001.1262. [DOI] [PubMed] [Google Scholar]
- 26.Pfaffl MW. A new mathematical model for relative quantification in real-time RT-PCR. Nucleic Acids Res. 2001;29:2002–2007. doi: 10.1093/nar/29.9.e45. [DOI] [PMC free article] [PubMed] [Google Scholar]
- 27.Akoum SEl, Lamontagne V, Cloutier I, Tanguay J. Nature of fatty acids in high fat diets differentially delineates obesity-linked metabolic syndrome components in male and female C57BL / 6J mice. Diabetol Metab Syndr. 2011;3:34. doi: 10.1186/1758-5996-3-34. [DOI] [PMC free article] [PubMed] [Google Scholar]
- 28.Cintra DE, Ropelle ER, Moraes JC, Pauli JR, Morari J, de Souza CT, et al. Unsaturated fatty acids revert diet-induced hypothalamic inflammation in obesity. PLoS One. 2012;7 doi: 10.1371/journal.pone.0030571. [DOI] [PMC free article] [PubMed] [Google Scholar]
- 29.Randle PJ, Garland PB, Hales CN, Newsholme EA. The glucose fatty-acid cycle its role in insulin sensitivity and the metabolic disturbances of diabetes mellitus. Lancet. 1963;281:785–789. doi: 10.1016/s0140-6736(63)91500-9. [DOI] [PubMed] [Google Scholar]
- 30.Ikemoto S, Takahashi M, Tsunoda N, Maruyama K, Itakura H, Ezaki O. High-fat diet-induced hyperglycemia and obesity in mice: Differential effects of dietary oils. Metabolism. 1996;45:1539–1546. doi: 10.1016/s0026-0495(96)90185-7. [DOI] [PubMed] [Google Scholar]
- 31.Power GWW, Yaqoob P, Harvey DJJ, Newsholme EAA, Calder PCC. The effect of dietary lipid manipulation on hepatic mitochondrial phospholipid fatty acid composition and carnitine palmitoyltransferase I activity. Biochem Mol Biol Int. 1994;34:671–684. [PubMed] [Google Scholar]
- 32.Friedman MI, Ramirez I, Bowden CR, Tordoff MG. Fuel partitioning and food intake : role for mitochondrial fatty acid transport. Am J Physiol Regul Integr Comp Physiol. 1990;258:R216–R221. doi: 10.1152/ajpregu.1990.258.1.R216. [DOI] [PubMed] [Google Scholar]
- 33.Longo Ka, Charoenthongtrakul S, Giuliana DJ, Govek EK, McDonagh T, Distefano PS, et al. The 24-hour respiratory quotient predicts energy intake and changes in body mass. Am J Physiol Regul Integr Comp Physiol. 2010;298:R747–R754. doi: 10.1152/ajpregu.00476.2009. [DOI] [PubMed] [Google Scholar]
- 34.Young IS, Mceneny J. Lipoprotein oxidation and atherosclerosis. Biochem Soc Trans. 2001;29:358–362. doi: 10.1042/0300-5127:0290358. [DOI] [PubMed] [Google Scholar]
- 35.Bjursell M, Gerdin A-K, Lelliott CJ, Egecioglu E, Elmgren A, Törnell J, et al. Acutely reduced locomotor activity is a major contributor to Western diet-induced obesity in mice. Am J Physiol Endocrinol Metab. 2008;294:E251–E260. doi: 10.1152/ajpendo.00401.2007. [DOI] [PubMed] [Google Scholar]
- 36.Brownlow BS, Petro A, Feinglos MN, Surwit RS. The role of motor activity in diet-induced obesity in C57BL/6J mice. Physiol Behav. 1996;60:37–41. doi: 10.1016/0031-9384(95)02210-4. doi: http://dx.doi.org/10.1016/0031-9384(95)02210-4. [DOI] [PubMed] [Google Scholar]
- 37.Larrieu T, Madore C, Joffre C, Layé S. Nutritional n-3 polyunsaturated fatty acids deficiency alters cannabinoid receptor signaling pathway in the brain and associated anxiety-like behavior in mice. J Physiol Biochem. 2012;68:671–681. doi: 10.1007/s13105-012-0179-6. [DOI] [PubMed] [Google Scholar]
- 38.Tschöp M, Weyer C, Tataranni PA, Devanarayan V, Ravussin E, Heiman ML. Circulating ghrelin levels are decreased in human obesity. Diabetes. 2001;50:707–709. doi: 10.2337/diabetes.50.4.707. [DOI] [PubMed] [Google Scholar]
- 39.Perreault M, Istrate N, Wang L, Nichols AJ, Tozzo E, Stricker-Krongrad A. Resistance to the orexigenic effect of ghrelin in dietary-induced obesity in mice: reversal upon weight loss. Int J Obes Relat Metab Disord. 2004;28:879–885. doi: 10.1038/sj.ijo.0802640. [DOI] [PubMed] [Google Scholar]
- 40.Wang H, Storlien LH, Huang X-F. Effects of dietary fat types on body fatness, leptin, and ARC leptin receptor, NPY, and AgRP mRNA expression. Am J Physiol Endocrinol Metab. 2002;282:E1352–E1359. doi: 10.1152/ajpendo.00230.2001. [DOI] [PubMed] [Google Scholar]
- 41.Padwal MK, Sarma U, Saha B. Comprehensive logic based analyses of Toll-like receptor 4 signal transduction pathway. PLoS One. 2014;9:e92481, 1–12. doi: 10.1371/journal.pone.0092481. [DOI] [PMC free article] [PubMed] [Google Scholar]
- 42.Imaizumi T, Yoshida H, Satoh K. Regulation of CX3CL1/fractalkine expression in endothelial cells. J Atheroscler Thromb. 2004;11:15–21. doi: 10.5551/jat.11.15. [DOI] [PubMed] [Google Scholar]
- 43.Erridge C, Samani NJ. Saturated fatty acids do not directly stimulate toll-like receptor signaling. Arterioscler Thromb Vasc Biol. 2009;29:1944–1949. doi: 10.1161/ATVBAHA.109.194050. [DOI] [PubMed] [Google Scholar]


